 |
 |
|
 |
Non-Farm Payroll | Employment |
|
 |
|
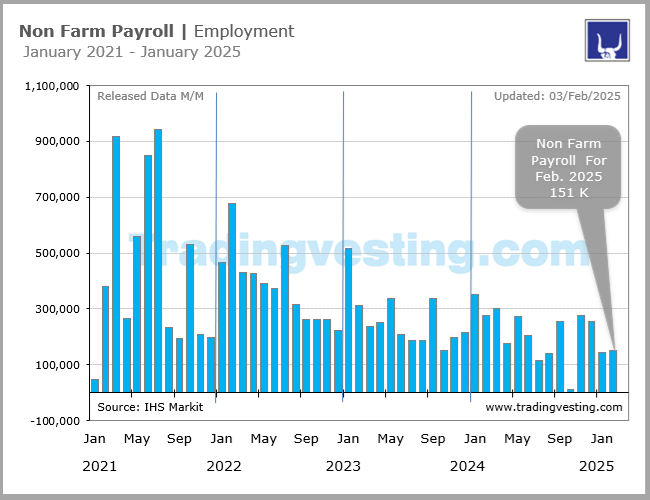
Non farm Payrolls is an economic indicator released by the Department of Labor monthly. The data reflect the change in nonfarm payrolls from the previous month and represent the total number of paid U.S. workers of any business.. Read More...
|
|
|
|
|
|
|
| |
|
| |
 1. Non Farm Payroll (1 of 5) 1. Non Farm Payroll (1 of 5) 1. Non Farm Payroll (1 of 5) 1. Non Farm Payroll (1 of 5) 2. Unemployment Rate (2 of 5) 2. Unemployment Rate (2 of 5) 3. ADP Employment Rate (3 of 5) 3. ADP Employment Rate (3 of 5) 4. JOLTS (4 of 5) 4. JOLTS (4 of 5) 5. Jobless Claims (5 of 5) 5. Jobless Claims (5 of 5)
|
 |
|
|
|
|
| |
|
→ Big Chart |
|
→ Release |
|
| |
|
|
|
|
|
|
|
|
|
|
|
|
|
|
|
|
|
|
|
 |
|
Big Chart | Large Data |
 |
|
Non-Farm Payroll | Employment |
|
Today's Week |
 |
|
|
|
|
|
|
|
|
|
|
|
|
|
| |
|
|
|
|
|
|
|
|
|
|
|
|
|
| |
|
|
|
|
|
|
|
|
|
|
|
|
|
|
|
|
|
|
|
|
|
Release Schedule | 2026 |
|
|
Non-Farm Payroll | Employment |
|
Today's Week |
|
|
|
|
|
|
|
|
|
|
|
|
|
Non-Farm Payroll | Employment (At 8:30 a.m ET)
| SCHEDULE 2026 |
No 1 |
No 2 |
No 3 |
No 4 |
No 5 |
No 6 |
No 7 |
No 8 |
No 9 |
No 10 |
No 11 |
No 12 |
| Release | Week |
|
|
|
|
|
|
|
|
|
|
|
|
| Release | Date |
|
|
|
|
|
|
|
|
|
|
|
|
| Release | Day |
|
|
|
|
|
|
|
|
|
|
|
|
 |
|
|
|
|
|
|
|
|
|
|
|
|
| NON-FARM |
No 1 |
No 2 |
No 3 |
No 4 |
No 5 |
No 6 |
No 7 |
No 8 |
No 9 |
No 10 |
No 11 |
No 12 |
| Prior |
64,000 |
50,000 |
130,000 |
... |
... |
... |
... |
... |
... |
... |
... |
... |
| Prior Revised |
56,000 |
48,000 |
126,000 |
... |
... |
... |
... |
... |
... |
... |
... |
... |
| CONSENSUS |
55,000 |
70,000 |
60,000 |
... |
... |
... |
... |
... |
... |
... |
... |
... |
| Consensus Low |
40,000 |
70,000 |
35,000 |
... |
... |
... |
... |
... |
... |
... |
... |
... |
| Consensus High |
100,000 |
130,000 |
125,000 |
... |
... |
... |
... |
... |
... |
... |
... |
... |
| NON-FARM |
50,000 |
130,000 |
-92,000 |
... |
... |
... |
... |
... |
... |
... |
... |
... |
| RATING |
|
|
|
|
|
|
|
|
|
|
|
|
| Month for |
Dec-24 |
Jan-26 |
Feb-26 |
Mar-26 |
Apr-26 |
May-26 |
Jun-26 |
Jul-26 |
Aug-26 |
Sep-26 |
Oct-26 |
Nov-26 |
|
| PRIVATE PAYROLL |
No 1 |
No 2 |
No 3 |
No 4 |
No 5 |
No 6 |
No 7 |
No 8 |
No 9 |
No 10 |
No 11 |
No 12 |
| Prior |
69 K |
37 K |
172 K |
... |
... |
... |
... |
... |
... |
... |
... |
... |
| Prior Revised |
50 K |
64 K |
146 K |
... |
... |
... |
... |
... |
... |
... |
... |
... |
| CONSENSUS |
55 K |
75 K |
65 K |
... |
... |
... |
... |
... |
... |
... |
... |
... |
| Consensus Low |
40 K |
30 K |
49 K |
... |
... |
... |
... |
... |
... |
... |
... |
... |
| Consensus High |
85 K |
130 K |
80 K |
... |
... |
... |
... |
... |
... |
... |
... |
... |
| PRIVATE PAYROLL |
37 K |
172 K |
-86 K |
... |
... |
... |
... |
... |
... |
... |
... |
... |
| RATINg PRIVATE |
|
|
|
|
|
|
|
|
|
|
|
|
|
| MFG PAYROLL |
No 1 |
No 2 |
No 3 |
No 4 |
No 5 |
No 6 |
No 7 |
No 8 |
No 9 |
No 10 |
No 11 |
No 12 |
| Prior |
-5 K |
-8 K |
5 K |
... |
... |
... |
... |
... |
... |
... |
... |
... |
| Prior Revised |
-2 K |
-8 K |
5 K |
... |
... |
... |
... |
... |
... |
... |
... |
... |
| CONSENSUS |
-10 K |
-7 K |
... |
... |
... |
... |
... |
... |
... |
... |
... |
... |
| Consensus Low |
-15 K |
-10 K |
... |
... |
... |
... |
... |
... |
... |
... |
... |
... |
| Consensus High |
-3 K |
-5 K |
... |
... |
... |
... |
... |
... |
... |
... |
... |
... |
| MFG PAYROLL |
-8 K |
5 K |
-12 K |
... |
... |
... |
... |
... |
... |
... |
... |
... |
|
|
|
|
|
|
|
|
|
|
|
|
|
|
|
|
| |
|
| |
|
|
|
|
|
|
|
|
|
|
|
Release Schedule | 2025 |
|
|
Non-Farm Payroll | Employment |
|
Today's Week |
|
|
|
|
|
|
|
|
|
|
|
|
|
Non-Farm Payroll | Employment (At 8:30 a.m ET)
| SCHEDULE 2025 |
No 1 |
No 2 |
No 3 |
No 4 |
No 5 |
No 6 |
No 7 |
No 8 |
No 9 |
No 10 |
No 11 |
No 12 |
| Release | Week |
|
|
|
|
|
|
|
|
|
|
|
|
| Release | Date |
|
|
|
|
|
|
|
|
|
|
|
|
| Release | Day |
|
|
|
|
|
|
|
|
|
|
|
|
|
|
|
|
|
|
|
|
|
|
|
|
|
| NON-FARM |
No 1 |
No 2 |
No 3 |
No 4 |
No 5 |
No 6 |
No 7 |
No 8 |
No 9 |
No 10 |
No 11 |
No 12 |
| Prior |
227,000 |
256,000 |
143,000 |
151,000 |
228,000 |
177,000 |
139,000 |
147,000 |
73,000 |
22,000 |
119,000 |
-162,000 |
| Prior Revised |
212,000 |
307,000 |
125,000 |
117,000 |
185,000 |
147,000 |
144,000 |
14,000 |
79,000 |
... |
... |
... |
| CONSENSUS |
157,000 |
168,000 |
160,000 |
131,000 |
130,000 |
129,000 |
110,000 |
110,000 |
77,000 |
50,000 |
-60,000 |
... |
| Consensus Low |
125,000 |
125,000 |
130,000 |
80,000 |
25,000 |
100,000 |
70,000 |
0,000 |
59,000 |
... |
... |
... |
| Consensus High |
200,000 |
225,000 |
300,000 |
165,000 |
165,000 |
190,000 |
130,000 |
140,000 |
110,000 |
... |
... |
... |
| NON-FARM |
256,000 |
143,000 |
151,000 |
228,000 |
177,000 |
139,000 |
147,000 |
73,000 |
22,000 |
119,000 |
-162,000 |
64,000 |
| RATING |
|
|
|
|
|
|
|
|
|
|
|
|
| Month for |
Dec-24 |
Jan-25 |
Feb-25 |
Mar-25 |
Apr-25 |
May-25 |
Jun-25 |
Jul-25 |
Aug-25 |
Sep-25 |
Oct-25 |
Nov-25 |
|
| PRIVATE PAYROLL |
No 1 |
No 2 |
No 3 |
No 4 |
No 5 |
No 6 |
No 7 |
No 8 |
No 9 |
No 10 |
No 11 |
No 12 |
| Prior |
194 K |
223 K |
111 K |
140 K |
209 K |
167 K |
140 K |
74 K |
83 K |
38 K |
... |
... |
| Prior Revised |
182 K |
273 K |
... |
116 K |
170 K |
146 K |
137 K |
3 K |
77 K |
... |
... |
... |
| CONSENSUS |
130 K |
140 K |
143 K |
115 K |
125 K |
120 K |
100 K |
100 K |
75 K |
... |
... |
... |
| Consensus Low |
110 K |
95 K |
108 K |
95 K |
95 K |
95 K |
75 K |
55 K |
65 K |
... |
... |
... |
| Consensus High |
185 K |
200 K |
190 K |
143 K |
150 K |
140 K |
125 K |
125 K |
100 K |
... |
... |
... |
| PRIVATE PAYROLL |
223 K |
111 K |
140 K |
209 K |
167 K |
140 K |
74 K |
83 K |
38 K |
... |
... |
69 K |
| RATINg PRIVATE |
|
|
|
|
|
|
|
|
|
|
|
|
|
| MFG PAYROLL |
No 1 |
No 2 |
No 3 |
No 4 |
No 5 |
No 6 |
No 7 |
No 8 |
No 9 |
No 10 |
No 11 |
No 12 |
| Prior |
22 K |
-13 K |
3 K |
10 K |
1 K |
-1 K |
-8 K |
-7 K |
-11 K |
-12 K |
... |
... |
| Prior Revised |
25 K |
-12 K |
-5 K |
8 K |
3 K |
5 K |
-7 K |
-15 K |
-2 K |
... |
... |
... |
| CONSENSUS |
10 K |
5 K |
5 K |
3 K |
-3 K |
0 K |
-1 K |
1 K |
... |
... |
... |
... |
| Consensus Low |
-10 K |
-10 K |
5 K |
4 K |
-10 K |
-5 K |
-4 K |
0 K |
... |
... |
... |
... |
| Consensus High |
29 K |
25 K |
6 K |
5 K |
5 K |
3 K |
15 K |
3 K |
... |
... |
... |
... |
| MFG PAYROLL |
-13 K |
3 K |
10 K |
1 K |
-1 K |
-8 K |
-7 K |
-11 K |
-12 K |
... |
... |
-5 K |
|
|
|
|
|
|
|
|
|
|
|
|
|
|
|
|
| |
|
| |
|
|
|
|
|
|
|
|
|
|
|
Release Schedule | 2024 |
|
|
Non-Farm Payroll | Employment |
|
Today's Week |
|
|
|
|
|
|
|
|
|
|
|
|
|
Non-Farm Payroll | Employment (At 8:30 a.m ET)
| SCHEDULE 2024 |
No 1 |
No 2 |
No 3 |
No 4 |
No 5 |
No 6 |
No 7 |
No 8 |
No 9 |
No 10 |
No 11 |
No 12 |
| Release | Week |
|
|
|
|
|
|
|
|
|
|
|
|
| Release | Date |
|
|
|
|
|
|
|
|
|
|
|
|
| Release | Day |
|
|
|
|
|
|
|
|
|
|
|
|
| NON-FARM |
No 1 |
No 2 |
No 3 |
No 4 |
No 5 |
No 6 |
No 7 |
No 8 |
No 9 |
No 10 |
No 11 |
No 12 |
| Prior |
199,000 |
216,000 |
353,000 |
275,000 |
303,000 |
175,000 |
272,000 |
206,000 |
114,000 |
142,000 |
254,000 |
12,000 |
| Prior Revised |
173,000 |
333,000 |
229,000 |
270,000 |
315,000 |
165,000 |
218,000 |
179,000 |
89,000 |
159,000 |
223,000 |
36,000 |
| CONSENSUS |
164,000 |
170,000 |
190,000 |
200,000 |
243,000 |
182,000 |
189,000 |
180,000 |
160,000 |
132,000 |
125,000 |
211,000 |
| Consensus Low |
100,000 |
120,000 |
95,000 |
150,000 |
190,000 |
150,000 |
150,000 |
70,000 |
100,000 |
70,000 |
57,000 |
160,000 |
| Consensus High |
200,000 |
200,000 |
260,000 |
230,000 |
303,000 |
225,000 |
237,000 |
215,000 |
195,000 |
180,000 |
180,000 |
275,000 |
| NON-FARM |
216,000 |
353,000 |
275,000 |
303,000 |
175,000 |
272,000 |
206,000 |
114,000 |
142,000 |
254,000 |
12,000 |
277,000 |
| RATING |
|
|
|
|
|
|
|
|
|
|
|
|
| Month for |
Dec-23 |
Jan-24 |
Feb-24 |
Mar-24 |
Apr-24 |
May-24 |
Jun-24 |
Jul-24 |
Aug-24 |
Sep-24 |
Oct-24 |
Nov-24 |
|
| PRIVATE PAYROL |
No 1 |
No 2 |
No 3 |
No 4 |
No 5 |
No 6 |
No 7 |
No 8 |
No 9 |
No 10 |
No 11 |
No 12 |
| Prior |
150 K |
164 K |
317 K |
223 K |
232 K |
167 K |
229 K |
136 K |
97 K |
118 K |
223 K |
-28 K |
| Prior Revised |
136 K |
278 K |
177 K |
207 K |
243 K |
158 K |
193 K |
136 K |
74 K |
114 K |
192 K |
-2 K |
| CONSENSUS |
127 K |
142 K |
150 K |
170 K |
190 K |
168 K |
160 K |
155 K |
136 K |
125 K |
90 K |
200 K |
| Consensus Low |
105 K |
120 K |
135 K |
125 K |
152 K |
132 K |
130 K |
130 K |
92 K |
77 K |
40 K |
135 K |
| Consensus High |
140 K |
175 K |
185 K |
180 K |
232 K |
200 K |
195 K |
175 K |
170 K |
150 K |
160 K |
245 K |
| PRIVATE PAYROLL |
164 K |
317 K |
223 K |
232 K |
167 K |
229 K |
136 K |
97 K |
118 K |
223 K |
-28 K |
194 K |
|
| MFG Payroll |
No 1 |
No 2 |
No 3 |
No 4 |
No 5 |
No 6 |
No 7 |
No 8 |
No 9 |
No 10 |
No 11 |
No 12 |
| Prior |
28 K |
6 K |
23 K |
-4 K |
0 K |
8 K |
8 K |
-8 K |
1 K |
-24 K |
-7 K |
-46 K |
| Prior Revised |
26 K |
8 K |
8 K |
-10 K |
-4 K |
6 K |
0 K |
-9 K |
6 K |
-27 K |
-6 K |
-48 K |
| CONSENSUS |
5 K |
5 K |
10 K |
7 K |
7 K |
5 K |
10 K |
-2 K |
-2 K |
... |
-30 K |
25 K |
| Consensus Low |
2 K |
4 K |
5 K |
0 K |
0 K |
3 K |
5 K |
-3 K |
-3 K |
... |
-35 K |
15 K |
| Consensus High |
15 K |
5 K |
17 K |
10 K |
12 K |
7 K |
10 K |
-10 K |
0 K |
... |
-5 K |
35 K |
| MFG PAYROLL |
6 K |
23 K |
-4 K |
0 K |
8 K |
8 K |
-8 K |
1 K |
-24 K |
-7 K |
-46 K |
22 K |
|
|
|
|
|
|
|
|
|
|
|
|
|
|
|
|
| |
|
| |
|
|
|
|
|
|
|
|
|
|
|
Release Schedule | 2023 |
|
|
Non-Farm Payroll | Employment |
|
Today's Week |
|
|
|
|
|
|
|
|
|
|
|
|
|
Non-Farm Payroll | Employment (8:30)
| SCHEDULE 2023 |
No 1 |
No 2 |
No 3 |
No 4 |
No 5 |
No 6 |
No 7 |
No 8 |
No 9 |
No 10 |
No 11 |
No 12 |
| Release | Week |
|
|
|
|
|
|
|
|
|
|
|
|
| Release | Date |
|
|
|
|
|
|
|
|
|
|
|
|
| Release | Day |
|
|
|
|
|
|
|
|
|
|
|
|
| NonFarm Payroll |
No 1 |
No 2 |
No 3 |
No 4 |
No 5 |
No 6 |
No 7 |
No 8 |
No 9 |
No 10 |
No 11 |
No 12 |
| Prior: |
263,000 |
223,000 |
517,000 |
311,000 |
236,000 |
253,000 |
339,000 |
209,000 |
187,000 |
187,000 |
336,000 |
150,000 |
| Prior Revised: |
256,000 |
260,000 |
504,000 |
326,000 |
165,000 |
294,000 |
306,000 |
294,000 |
157,000 |
227,000 |
297,000 |
No |
| Consensus |
200,000 |
185,000 |
223,000 |
240,000 |
178,000 |
190,000 |
213,000 |
200,000 |
170,000 |
160,000 |
179,000 |
180,000 |
| Consensus Low: |
150,000 |
150,000 |
160,000 |
155,000 |
140,000 |
-100,000 |
-110,000 |
-150,000 |
40,000 |
105,000 |
130,000 |
110,000 |
| Consensus High: |
230,000 |
260,000 |
325,000 |
325,000 |
200,000 |
265,000 |
263,000 |
300,000 |
190,000 |
235,000 |
260,000 |
240,000 |
| NONFARM |
223,000 |
517,000 |
311,000 |
236,000 |
253,000 |
339,000 |
209,000 |
187,000 |
187,000 |
336,000 |
150,000 |
199,000 |
| RATING |
|
|
|
|
|
|
|
|
|
|
|
|
| Month for: |
Dec-22 |
Jan-23 |
Feb-23 |
Mar-23 |
Apr-23 |
May-23 |
Jun-23 |
Jul-23 |
Aug-23 |
Sep-23 |
Oct-23 |
Nov-23 |
| Private Payroll |
No 1 |
No 2 |
No 3 |
No 4 |
No 5 |
No 6 |
No 7 |
No 8 |
No 9 |
No 10 |
No 11 |
No 12 |
| Prior: |
221 K |
220 K |
443 K |
265 K |
189 K |
230 K |
283 K |
149 K |
172 K |
179 K |
263 K |
99 K |
| Prior Revised: |
202 K |
269 K |
386 K |
266 K |
123 K |
253 K |
259 K |
128 K |
155 K |
177 K |
246 K |
85 K |
| Consensus: |
175 K |
170 K |
213 K |
223 K |
153 K |
165 K |
199 K |
175 K |
147 K |
150 K |
143 K |
150 K |
| Consensus Low: |
153 K |
150 K |
180 K |
200 K |
125 K |
155 K |
180 K |
145 K |
15 K |
100 K |
110 K |
73 K |
| Consensus High: |
200 K |
200 K |
300 K |
360 K |
170 K |
200 K |
253 K |
225 K |
170 K |
200 K |
170 K |
160 K |
| PRIVATE PAYROLL |
220 K |
443 K |
265 K |
189 K |
230 K |
283 K |
149 K |
172 K |
179 K |
263 K |
99 K |
150 K |
|
|
|
|
|
|
|
|
|
|
|
|
|
|
|
|
| |
|
| |
|
|
|
|
|
|
|
|
|
|
|
Release Schedule | 2022 |
|
|
Non-Farm Payroll | Employment |
|
Today's Week |
|
|
|
|
|
|
|
|
|
|
|
|
|
Non-Farm Payroll | Employment (8:30)
| SCHEDULE 2022 |
No 1 |
No 2 |
No 3 |
No 4 |
No 5 |
No 6 |
No 7 |
No 8 |
No 9 |
No 10 |
No 11 |
No 12 |
| Release | Week |
|
|
|
|
|
|
|
|
|
|
|
|
| Release | Date |
|
|
|
|
|
|
|
|
|
|
|
|
| Release | Day |
|
|
|
|
|
|
|
|
|
|
|
|
| NonFarm Payroll |
No 1 |
No 2 |
No 3 |
No 4 |
No 5 |
No 6 |
No 7 |
No 8 |
No 9 |
No 10 |
No 11 |
No 12 |
| Prior: |
210,000 |
199,000 |
467,000 |
678,000 |
431,000 |
428,000 |
390,000 |
372,000 |
528,000 |
315,000 |
263,000 |
263,000 |
| Prior Revised: |
249,000 |
510,000 |
481,000 |
750,000 |
428,000 |
436,000 |
384,000 |
0,000 |
526,000 |
No |
315,000 |
284,000 |
| Consensus |
400,000 |
150,000 |
390,000 |
490,000 |
400,000 |
325,000 |
270,000 |
0,000 |
293,000 |
250,000 |
210,000 |
200,000 |
| Consensus Low: |
-300,000 |
-400,000 |
200,000 |
200,000 |
300,000 |
250,000 |
190,000 |
0,000 |
200,000 |
220,000 |
125,000 |
150,000 |
| Consensus High: |
500,000 |
280,000 |
650,000 |
700,000 |
500,000 |
370,000 |
350,000 |
0,000 |
390,000 |
340,000 |
250,000 |
275,000 |
| NONFARM |
199,000 |
467,000 |
678,000 |
431,000 |
428,000 |
390,000 |
372,000 |
528,000 |
315,000 |
263,000 |
261,000 |
263,000 |
| RATING |
|
|
|
|
|
|
|
|
|
|
|
|
| Month for: |
Dec-21 |
Jan-22 |
Feb-22 |
Mar-22 |
Apr-22 |
May-22 |
Jun-22 |
Jul-22 |
Aug-22 |
Sep-22 |
Oct-22 |
Nov-22 |
| Private Payroll |
No 1 |
No 2 |
No 3 |
No 4 |
No 5 |
No 6 |
No 7 |
No 8 |
No 9 |
No 10 |
No 11 |
No 12 |
| Prior: |
235 k |
211 k |
444 k |
654 k |
426 k |
406 k |
333 k |
381 k |
471 k |
308 k |
288 k |
233 k |
| Prior Revised: |
270 k |
503 k |
448 k |
739 k |
424 k |
405 k |
336 k |
0 k |
477 k |
275 k |
319 k |
248 k |
| Consensus: |
363 k |
150 k |
330 k |
458 k |
390 k |
310 k |
228 k |
0 k |
280 k |
280 k |
200 k |
200 k |
| Consensus Low: |
300 k |
-375 k |
197 k |
175 k |
340 k |
275 k |
195 k |
0 k |
200 k |
220 k |
195 k |
180 k |
| Consensus High: |
405 k |
250 k |
625 k |
600 k |
455 k |
250 k |
290 k |
0 k |
325 k |
335 k |
250 k |
250 k |
| PRIVATE PAYROLL |
211 k |
444 k |
654 k |
426 k |
406 k |
333 k |
381 k |
471 k |
308 k |
288 k |
233 k |
221 k |
|
|
|
|
|
|
|
|
|
|
|
|
|
|
|
|
| |
|
| |
|
|
|
|
|
|
|
|
|
|
|
Release Schedule | 2021 |
|
|
Non-Farm Payroll | Employment |
|
Today's Week |
|
|
|
|
|
|
|
|
|
|
|
|
|
Non-Farm Payroll | Employment (8:30)
| SCHEDULE 2021 |
No 1 |
No 2 |
No 3 |
No 4 |
No 5 |
No 6 |
No 7 |
No 8 |
No 9 |
No 10 |
No 11 |
No 12 |
| Release | Week |
|
|
|
|
|
|
|
|
|
|
|
|
| Release | Date |
|
|
|
|
|
|
|
|
|
|
|
|
| Release | Day |
|
|
|
|
|
|
|
|
|
|
|
|
|
| NonFarm Payroll |
No 1 |
No 2 |
No 3 |
No 4 |
No 5 |
No 6 |
No 7 |
No 8 |
No 9 |
No 10 |
No 11 |
No 12 |
| Prior: |
245,000 |
-140 K |
49,000 |
379,000 |
916,000 |
266,000 |
559,000 |
850,000 |
943,000 |
235,000 |
194,000 |
531,000 |
| Prior Revised: |
No |
-227K |
No |
536,000 |
770,000 |
278,000 |
583,000 |
938,000 |
938,000 |
483,000 |
312,000 |
546,000 |
| Consensus |
50,000 |
50,000 |
140,000 |
658,000 |
1M |
950,000 |
703,000 |
900,000 |
720,000 |
475,000 |
450,000 |
573,000 |
| Consensus Low: |
35,000 |
45,000 |
-100,000 |
439,000 |
500,000 |
400,000 |
520,000 |
410,000 |
710,000 |
250,000 |
420,000 |
420,000 |
| Consensus High: |
75,000 |
85,000 |
312,000 |
1M |
1.5M |
950,000 |
1M |
2M |
1.4M |
650,000 |
750,000 |
750,000 |
| NONFARM |
-140 K |
49,000 |
379,000 |
916,000 |
266,000 |
559,000 |
850,000 |
943,000 |
235,000 |
194,000 |
531,000 |
210,000 |
| RATING |
|
|
|
|
|
|
|
|
|
|
|
|
| Month for: |
Dec-20 |
Jan-21 |
Feb-21 |
Mar-21 |
Apr-21 |
May-21 |
Jun-21 |
Jul-21 |
Aug-21 |
Sep-21 |
Oct-21 |
Nov-21 |
| Private Payroll |
No 1 |
No 2 |
No 3 |
No 4 |
No 5 |
No 6 |
No 7 |
No 8 |
No 9 |
No 10 |
No 11 |
No 12 |
| Prior: |
|
|
6,000 |
465,000 |
|
218,000 |
492,000 |
662,000 |
703,000 |
243,000 |
|
|
| Prior Revised: |
|
|
No |
558,000 |
|
219,000 |
516,000 |
769,000 |
|
332,000 |
|
|
| Consensus: |
|
|
130,000 |
550,000 |
|
625,000 |
600,000 |
750,000 |
|
445,000 |
|
|
| Consensus Low: |
|
|
10,000 |
420,000 |
|
350,000 |
450,000 |
455,000 |
|
313,000 |
|
|
| Consensus High: |
|
|
20,000 |
910,000 |
|
750,000 |
675,000 |
1M |
|
600,000 |
|
|
| PRIVATE PAYROLL |
|
|
465,000 |
780,000 |
|
492,000 |
662,000 |
703,000 |
243,000 |
317,000 |
|
|
|
|
|
|
|
|
|
|
|
|
|
|
|
|
|
|
| |
|
|
| |
|
|
|
|
|
|
|
|
|
|
|
|
|
|
|
|
|
|
|
|
|
Brief News | 2026 |
|
|
Non-Farm Payroll | Employment |
|
Today's Week |
|
|
|
|
|
|
|
|
|
|
|
|
|
Non-Farm Payroll | Employment (8:30)
| DATE/WEEK |
HIGHLIGHTS |
FOR |
ACTUAL |
|
Non Farm Payroll |
No 12 |
... |
|
Nov-2026 |
|
| |
|
|
|
Non Farm Payroll |
No 11 |
... |
|
Oct-2026 |
|
| |
|
|
|
Non Farm Payroll |
No 10 |
... |
|
Sep-2026 |
|
| |
|
|
|
Non Farm Payroll |
No 9 |
... |
|
Aug-2026 |
|
| |
|
|
|
Non Farm Payroll |
No 8 |
... |
|
Jul-2026 |
|
| |
|
|
|
Non Farm Payroll |
No 7 |
... |
|
Jun-2026 |
|
| |
|
|
|
Non Farm Payroll |
No 6 |
... |
|
May-2026 |
|
| |
|
|
|
Non Farm Payroll |
No 5 |
... |
|
Apr-2026 |
|
| |
|
|
|
Non Farm Payroll |
No 4 |
... |
|
Mar-2026 |
|
| |
|
|
|
Non Farm Payroll |
No 3 |
... |
|
Feb-2026 |
|
| |
|
|
|
Non Farm Payroll |
No 2 |
... |
|
Jan-2026 |
|
| |
|
|
|
Non Farm Payroll |
No 1 |
... |
|
Dec-2025 |
|
| |
|
|
|
|
|
|
|
|
| |
|
|
|
|
|
| |
|
|
|
|
|
|
|
|
|
|
|
|
|
|
|
Brief News | 2025 |
|
|
Non-Farm Payroll | Employment |
|
Today's Week |
|
|
|
|
|
|
|
|
|
|
|
|
|
Non-Farm Payroll | Employment (8:30)
| DATE/WEEK |
HIGHLIGHTS |
FOR |
ACTUAL |
|
Payroll employment showed little net change from April through November, with a slight uptick of 64,000 in November. In November 2025, U.S. nonfarm payroll employment increased by 64,000, exceeding expectations of 45,000–50,000, while the unemployment rate rose to 4.6%. Job growth was driven by gains in health care (+46,000) and construction (+28,000),Bureau of Labor Statistics (.gov). The data indicates a cooling, yet positive, labor market. Unemployment Rate: 4.6% (highest since July 2021). Private Sector Jobs: +69,000. |
No 12 |
64,000 |
|
Nov-2025 |
|
| |
|
|
|
The official October 2025 US Non-Farm Payroll (NFP) report was delayed due to a government shutdown, with data eventually released on December 16, 2025, alongside November figures. The report showed a significant slump, with federal government employment falling by 162,000 in October, contributing to a weak overall labor market picture.The Bureau of Labor Statistics (BLS) delayed the release due to a federal government shutdown that began on October 1. The October report highlighted a substantial decline in government payrolls by 162,000.Prior to the report, economists had expected a decline of up to 60,000 jobs, with major corporate workforce reductions adding to the negative sentiment. |
No 11 |
-162,000 |
|
Oct-2025 |
|
| |
|
|
|
U.S. nonfarm payrolls increased by 119,000 in September 2025, exceeding the median estimate of 50,000 and marking the best result since April, according to the Bureau of Labor Statistics (.gov). Despite the gain, the unemployment rate edged up to 4.4%, a four-year high. Job growth was led by health care (+43,000) and food services (+37,000) Unemployment Rate: 4.4%. Average Hourly Earnings: Increased by 0.2% for the month, and 3.8% annually. Labor Force Participation Rate: Ticked up to 62.4%. |
No 10 |
119,000 |
|
Sep-2025 |
|
| |
|
|
|
Non Farm Payroll rose 22,000 in August, less than expected in further sign of hiring slowdown. Nonfarm payrolls increased by just 22,000 for the month, lower than the 75,000 forecast, while the unemployment rate rose to 4.3%. The report showed a marked slowdown from the July increase of 79,000, which was revised up by 6,000. Revisions also showed a net loss of 13,000 in June. Health care again led by sectors, adding 31,000 jobs, while social assistance contributed 16,000. Wholesale trade and manufacturing both saw declines of 12,000 on the month. |
No 9 |
22,000 |
|
Aug-2025 |
|
| |
|
|
|
U.S. added just 73,000 jobs in July 2025and numbers for prior months were revised much lower.Nonfarm payrolls growth totaled 73,000 for July, above the June total of 14,000 but below even the meager Dow Jones estimate for a gain of 100,000. June and May totals were revised sharply lower, down by a combined 258,000 from previously announced levels. The weak report, including the dramatic revisions, could provide incentive for the Federal Reserve to lower interest rates when it next meets in September. Health care and social assistance combined for some 94% of the job growth. |
No 8 |
73,000 |
|
Jul-2025 |
|
| |
|
|
|
U.S. payrolls increased by 147,000 in June 2025, more than expected. Nonfarm payrolls increased a seasonally adjusted 147,000 for the month, higher than the estimate for 110,000 and just above the upwardly revised 144,000 in May. Market pricing shifted strongly following the payrolls report, with traders all but taking the chance of a July rate cut off the table. Government employment posted a large gain, leading all categories with an increase of 73,000 due to solid boosts in state and local hiring. |
No 7 |
147,000 |
|
Jun-2025 |
|
| |
|
|
|
U.S. payrolls increased 139,000 in May 2025, more than expected; unemployment at 4.2%. Nonfarm payrolls rose 139,000 for the month, above the Dow Jones estimate for 125,000 and a bit below the downwardly revised 147,000 in April. The unemployment rate held at 4.2%. Worker pay grew more than expected, with average hourly earnings up 0.4% during the month and 3.9% from a year ago.Nearly half the job growth came from health care, which added 62,000. Leisure and hospitality contributed 48,000, while social assistance added 16,000. |
No 6 |
139,000 |
|
May-2025 |
|
| |
|
|
|
In April 2025, the US non-farm payroll employment increased by 177,000, slightly below the revised 185,000 jobs added in March. The unemployment rate remained at 4.2%, and average hourly earnings saw a 0.2% increase. U.S. payroll growth totals 177,000 in April, defying expectations. Nonfarm payrolls increased a seasonally adjusted 177,000 for the month, slightly below the downwardly revised 185,000 in March but above the Dow Jones estimate for 133,000. The unemployment rate, however, stayed at 4.2%, as expected, indicating that the labor market is holding relatively stable. Average hourly earnings rose just 0.2% for the month, below the 0.3% forecast, while the annual rate of 3.8% also was 0.1 percentage point less than expected. |
No 5 |
177,000 |
|
Apr-2025 |
|
| |
|
|
|
In March 2025, the U.S. economy added 228,000 jobs in the nonfarm payrolls report, exceeding the average monthly gain of 158,000 over the prior 12 months. Private-sector employment saw a significant increase of 209,000 jobs, while government employment remained relatively stable, with a slight increase of 19,000 jobs, according to the Bureau of Labor Statistics (BLS). The unemployment rate also saw a slight increase to 4.2%, higher than the previous forecast of 4.1%. |
No 4 |
228,000 |
|
Mar-2025 |
|
| |
|
|
|
U.S. payroll growth totals 151,000 in February, less than expected.Nonfarm payrolls increased by a seasonally adjusted 151,000 on the month, better than the downwardly revised 125,000 in January but less than the 170,000 consensus forecast. Federal government employment declined by 10,000 in February though government payrolls overall rose by 11,000. Average hourly earnings climbed 0.3%, as expected, though the annual increase of 4% was a bit softer than the 4.2% forecast. |
No 3 |
151,000 |
|
Feb-2025 |
|
| |
|
|
|
In January 2025, the US nonfarm payroll report showed a gain of 143,000 jobs, according to the Bureau of Labor Statistics. This increase was slightly below the average monthly gain of 166,000 in 2024, according to the Bureau of Labor Statistics. The unemployment rate also slightly decreased to 4%. Job gains were concentrated in health care, retail trade, and social assistance. U.S. economy added just 143,000 jobs in January but unemployment rate fell to 4%. Nonfarm payrolls in January rose by a seasonally adjusted 143,000 for the month, down from 307,000 in December and below the 169,000 forecast. The unemployment rate nudged lower to 4%. |
No 2 |
143,000 |
|
Jan-2025 |
|
| |
|
|
|
In December 2024, the US economy added 256,000 nonfarm payroll jobs, exceeding economists' expectations. This brought the total job gains for the year to 2.2 million, averaging 186,000 per month. U.S. payrolls grew by 256,000 in December, much more than expected; unemployment rate falls to 4.1%. Nonfarm payrolls surged by 256,000 for the month, up from 212,000 in November and above the 155,000 forecast. The unemployment rate edged down to 4.1%, one-tenth of a point below expectations. A broader jobless measure moved down to 7.5%, a decrease of 0.2 percentage point and the lowest since June 2024. Average hourly earnings increased 0.3% on the month, which was in line with forecasts, but the 12-month gain of 3.9% was slightly below the outlook. Stock market futures plunged after the report while Treasury yields soared as traders price in a lower probability of Fed rate cuts this year. |
No 1 |
256,000 |
|
Dec-2024 |
|
| |
|
|
|
|
|
|
|
|
| |
|
|
|
|
|
| |
|
|
|
|
|
|
|
|
|
|
|
|
|
|
|
Brief News | 2024 |
|
|
Non-Farm Payroll | Employment |
|
Today's Week |
|
|
|
|
|
|
|
|
|
|
|
|
|
Non-Farm Payroll | Employment (8:30)
| DATE/WEEK |
HIGHLIGHTS |
FOR |
ACTUAL |
|
In November 2024, non-farm payroll employment in the U.S. increased by 227,000 jobs. The unemployment rate remained steady at 4.2%. This rise in payrolls followed a month with little change in employment (+36,000 in October) and was higher than the Dow Jones consensus estimate of 214,000. Job gains were concentrated in health care, leisure and hospitality, and government sectors.Payrolls increased 227,000 in November, more than expected; unemployment rate at 4.2%. Nonfarm payrolls rose by 227,000 for the month, compared with an upwardly revised 36,000 in October and the Dow Jones consensus estimate for 214,000. The unemployment rate edged higher to 4.2%, as expected.
Traders accelerated their bets on an interest rate cut this month following the payrolls release. Job gains were focused in health care (54,000), leisure and hospitality (53,000), and government (33,000).
|
No 12 |
277,000 |
|
Nov-2024 |
|
| |
|
|
|
U.S. economy added just 12,000 jobs in October, impacted by hurricanes, Boeing strike. Nonfarm payrolls increased by 12,000 for the month, down sharply from September and below the Dow Jones estimate for 100,000. The unemployment rate held at 4.1%, in line with expectations. The BLS noted that the Boeing strike likely subtracted 44,000 jobs in the manufacturing sector, while hurricanes also likely held back the total. Revisions lowered previously reported job creation totals by 112,000 for August and September combined. |
No 11 |
12,000 |
|
Oct-2024 |
|
| |
|
|
|
In September 2024, non-farm payroll employment in the U.S. increased by 254,000. The unemployment rate fell to 4.1%, and average hourly earnings saw a 0.4% increase. This positive jobs report exceeded initial forecasts and revisions to previous months' data indicate even stronger job growth over the past two months. U.S. job creation roared higher in September as payrolls surged by 254,000. Nonfarm payrolls surged by 254,000 in September, up from a revised 159,000 in August and better than the 150,000 Dow Jones consensus forecast. The unemployment rate fell to 4.1%, down 0.1 percentage point, as the survey of household employment showed an even stronger picture, with a gain of 430,000. Average hourly earnings increased 0.4% on the month and were up 4% from a year ago. Both figures were ahead of respective estimates. |
No 10 |
254,000 |
|
Sep-2024 |
|
| |
|
|
|
In August 2024, the US economy added 142,000 nonfarm payroll jobs, according to the Bureau of Labor Statistics (BLS). This figure fell short of the 160,000 jobs that economists had predicted. The unemployment rate ticked down to 4.2%, while average hourly earnings increased by 0.4%. August payrolls grew by a less-than-expected 142,000, but unemployment rate ticked down to 4.2%. Nonfarm payrolls expanded by 142,000 during August, up from 89,000 in July and below the 161,000 consensus forecast. The unemployment rate ticked down to 4.2%, as expected. However, the “real” unemployment rate edged up to 7.9%, its highest reading since October 2021. The previous two months saw substantial downward revisions. The BLS cut July’s total by 25,000, while June fell to 118,000, a downward revision of 61,000. Average hourly earnings increased by 0.4% on the month and 3.8% from a year ago, both higher than the respective estimates for 0.3% and 3.7%. |
No 9 |
142,000 |
|
Aug-2024 |
|
| |
|
|
|
In July 2024, the US Bureau of Labor Statistics reported a nonfarm payroll increase of 114,000 jobs, with the unemployment rate rising to 4.3%. This growth fell short of economists' expectations, which were around 185,000. Job growth totals 114,000 in July, much less than expected, as unemployment rate rises to 4.3%. Nonfarm payrolls grew by just 114,000 in July, below the downwardly revised 179,000 in June and the Dow Jones estimate for 185,000. The unemployment rate edged higher to 4.3%, its highest since October 2021, triggering an economic rule on recessions. Health care again led, adding 55,000 to payrolls. Other notable gainers included construction (25,000), government (17,000), and transportation and warehousing (14,000). Average hourly earnings increased 0.2% for the month and 3.6% from a year ago. Both figures were below respective forecasts for 0.3% and 3.7%. |
No 8 |
114,000 |
|
Jul-2024 |
|
| |
|
|
|
U.S. economy added 206,000 jobs in June, unemployment rate rises to 4.1%. The U.S. economy again added slightly more jobs than expected in June though the unemployment rate increased, the Labor Department reported Friday. Nonfarm payrolls increased by 206,000 for the month, better than the 200,000 Dow Jones forecast though less than the downwardly revised gain of 218,000 in May, which was cut sharply from the initial estimate of 272,000. The unemployment rate unexpectedly climbed to 4.1%, tied for the highest level since October 2021 and providing a conflicting sign for Federal Reserve officials weighing their next move on monetary policy. The forecast had been for the jobless rate to hold steady at 4%. |
No 7 |
206,000 |
|
Jun-2024 |
|
| |
|
|
|
U.S. adds a much-better-than-expected 272,000 jobs in May, but unemployment rate edges up to 4%. The U.S. economy added far more jobs than expected in May, countering fears of a slowdown in the labor market and likely reducing the Federal Reserve’s impetus to lower interest rates. Nonfarm payrolls expanded by 272,000 for the month, up from 165,000 in April and well ahead of the Dow Jones consensus estimate for 190,000, the Labor Department’s Bureau of Labor Statistics reported Friday. At the same time, the unemployment rate rose to 4%, the first time it has breached that level since January 2022. Economists had been expecting the rate to stay unchanged at 3.9% from April. The increase came even though the labor force participation rate decreased to 62.5%, down 0.2 percentage point. The survey of households used to compute the unemployment rate showed that the level of people who reported holding jobs fell by 408,000. |
No 6 |
272,000 |
|
May-2024 |
|
| |
|
|
|
U.S. job growth totaled 175,000 in April, much less than expected, while unemployment rose to 3.9%. The U.S. economy added fewer jobs than expected in April while the unemployment rate rose, lifting hopes that the Federal Reserve will be able to cut interest rates in the coming months. Nonfarm payrolls increased by 175,000 on the month, below the 240,000 estimate from the Dow Jones consensus, the Labor Department’s Bureau of Labor Statistics reported Friday. The unemployment rate ticked higher to 3.9% against expectations it would hold steady at 3.8%. The unemployment rate ticked higher to 3.9% against expectations it would hold steady at 3.8%. A more encompassing jobless rate edged up, to 7.4%, its highest level since November 2021. |
No 5 |
175,000 |
|
Apr-2024 |
|
| |
|
|
|
The U.S. economy added 303,000 jobs in March, the largest gain in more than a year, the Bureau of Labor Statistics said in its monthly jobs report. The unemployment rate also edged lower, to 3.8%. It’s a bit harder for workers to find jobs relative to the “great resignation” era a few years ago. But overall, the labor market looks healthy and sustainable and is giving inflation-adjusted raises to the average worker, economists said. The strong U.S. job market is in a ‘sweet spot,’ economists say. |
No 4 |
303,000 |
|
Mar-2024 |
|
| |
|
|
|
U.S. job growth totaled 275,000 in February but unemployment rate rose to 3.9%. Job creation topped expectations in February, but the unemployment rate moved higher and employment growth from the previous two months wasn’t nearly as hot as initially reported. Nonfarm payrolls increased by 275,000 for the month while the jobless rate moved higher to 3.9%, the Labor Department’s Bureau of Labor Statistics reported Friday. Economists surveyed by Dow Jones had been looking for payroll growth of 198,000. February was a step higher in growth from January, which saw a steep downward revision to 229,000, from the initially reported 353,000. Job growth in December also was revised down to 290,000 from 333,000, bringing the two-month total to 167,000 fewer jobs than initially reported. |
No 3 |
275,000 |
|
Feb-2024 |
|
| |
|
|
|
The United States produced an unexpectedly sizable batch of jobs last month, a boon for American workers that shows the labor market retains remarkable strength after three years of expansion. Employers added 353,000 jobs in January on a seasonally adjusted basis, the Labor Department reported on Friday, and the unemployment rate remained at 3.7 percent. |
No 2 |
353,000 |
|
Jan-2024 |
|
| |
|
|
|
U.S. payrolls increased by 216,000 in December, much better than expected. December’s jobs report showed employers added 216,000 jobs for the month while the unemployment rate held at 3.7%. That compared with respective estimates of 170,000 and 3.8%. The hiring boost came from a gain of 52,000 in government jobs and another 38,000 in health care-related fields such as ambulatory health-care services and hospitals. Average hourly earnings rose 0.4% on the month and were up 4.1% from a year ago, both higher than the respective estimates for 0.3% and 3.9%. |
No 1 |
216,000 |
|
Dec-2023 |
|
| |
|
|
|
|
|
|
|
|
| |
|
|
|
|
|
| |
|
|
|
|
|
|
|
|
|
|
|
|
|
|
|
Brief News | 2023 |
|
|
Non-Farm Payroll | Employment |
|
Today's Week |
|
|
|
|
|
|
|
|
|
|
|
|
|
Non-Farm Payroll | Employment (8:30)
| DATE/WEEK |
HIGHLIGHTS |
FOR |
ACTUAL |
|
U.S. payrolls rose 199,000 in November, unemployment rate falls to 3.7%. Nonfarm payrolls rose by a seasonally adjusted 199,000 in November, slightly better than the 190,000 Dow Jones estimate and ahead of the October gain of 150,000. The unemployment rate declined to 3.7%, compared with the forecast for 3.9%, as the labor force participation rate edged higher. Average hourly earnings, a key inflation indicator, increased by 0.4% for the month and 4% from a year ago, close to expectations. Health care was the biggest growth industry, adding 77,000. Other big gainers included government (49,000), manufacturing (28,000), and leisure and hospitality (40,000). |
No 12 |
199,000 |
|
Nov-2023 |
|
| |
|
|
|
Total nonfarm payroll employment increased by 150,000 in October 2023, below the average monthly gain of 258,000 over the prior 12 months. Economy U.S. payrolls increased by 150,000 in October, less than expected. Nonfarm payrolls increased by 150,000 for the month, against the consensus forecast for a rise of 170,000. That was a sharp decline from the gain of 297,000 in September. The unemployment rate rose to 3.9%, the highest level since January 2022, amid a drop in household employment. The unemployment rate rose to 3.9%, the highest level since January 2022, against expectations that it would hold steady at 3.8%. Employment as measured in the household survey, which is used to compute the unemployment rate, showed a decline of 348,000 workers, while the rolls of the unemployed rose by 146,000. |
No 11 |
150,000 |
|
Oct-2023 |
|
| |
|
|
|
Payrolls soared by 336,000 in September, defying expectations for a hiring slowdown. Nonfarm payrolls increased by 336,000 for the month, better than the Dow Jones consensus estimate for 170,000. Average hourly earnings rose 0.2% for the month and 4.2% from a year ago, compared to respective estimates for 0.3% and 4.3%. The unemployment rate was 3.8%, compared to the forecast for 3.7%. Leisure and hospitality led job growth, followed by government and health care. |
No 10 |
336,000 |
|
Sep-2023 |
|
| |
|
|
|
Unemployment rate unexpectedly rose to 3.8% in August as payrolls increased by 187,000. Nonfarm payrolls increased by 187,000 in August, ahead of the estimate for 170,000. The counts for June and July were revised considerably lower. However, the unemployment rate was 3.8%, up significantly from July and the highest since February 2022. The “real” unemployment rate jumped to 7.1%. Health care showed the biggest gain by sector, adding 71,000. Other leaders were leisure and hospitality, social assistance, and construction. Average hourly earnings rose 0.2% for the month and 4.3% from a year ago, both slightly below forecasts. |
No 9 |
187,000 |
|
Aug-2023 |
|
| |
|
|
|
July jobs report: U.S. payroll growth totaled 187,000, lower than expected. Nonfarm payrolls expanded by 187,000 for July, slightly below the Dow Jones estimate for 200,000. The unemployment rate was 3.5%, against a consensus estimate that the jobless level would hold steady at 3.6%. Average hourly earnings rose 0.4% for the month, good for a 4.4% annual pace, both above expectations. Health care, social assistance, financial activities and wholesale trade were the leading sectors for job creation. |
No 8 |
187,000 |
|
Jul-2023 |
|
| |
|
|
|
Payrolls rose by 209,000 in June, less than expected, as jobs growth wobbles.Nonfarm payrolls increased 209,000 in June, below the consensus estimate for 240,000. The unemployment rate was 3.6%, down 0.1 percentage point. However, a more encompassing jobless level rose to 6.9%. Government hiring led the job gains, followed by health care, social assistance and construction. Wages rose 4.4% from a year ago, slightly higher than expectations. |
No 7 |
209,000 |
|
Jun-2023 |
|
| |
|
|
|
Payrolls rose 339,000 in May, much better than expected in resilient labor market. Nonfarm payrolls in May increased by 339,000, better than the 190,000 Dow Jones estimate. The unemployment rate rose to 3.7% in May against the estimate for 3.5%. May’s jobless rate was the highest since October 2022. Professional and business services led job creation followed by government and health care. The U.S. economy continued to crank out jobs in May, with nonfarm payrolls surging more than expected despite multiple headwinds, the Labor Department reported Friday. Payrolls in the public and private sector increased by 339,000 for the month, better than the 190,000 Dow Jones estimate and marking the 29th straight month of positive job growth. Markets reacted positively after the report, with the Dow Jones Industrial Average up more than 400 points in early trading. Treasury yields rose as well as markets digested both the strong jobs numbers and a debt deal in Congress. |
No 6 |
339,000 |
|
May-2023 |
|
| |
|
|
|
Broad-based gains across industries helped April nonfarm payroll data top economists’ expectations. Almost 1 in 4 of the new jobs were in health care and social assistance, which added about 64,200 in the month. Professional and business services saw the second-largest growth in April at 43,000, which is more jobs than it has added in an average month over the past half-year. Broad job gains across the economy helped the labor market show resilience in the face of a banking crisis and growing recessionary concerns. Nonfarm payrolls increased by 253,000 in April, according to data from the Bureau of Labor Statistics released Friday. That’s more than the Dow Jones estimate of 180,000. Friday’s data bolsters the argument that the labor market has remained idiosyncratically strong despite signs that the broader economy has slowed. Almost 1 in 4 of the new jobs were in health care and social assistance, which added about 64,200 in the month. The U.S. unemployment rate inched down to 3.4% last month, according to the U.S. Bureau of Labor Statistics. The number not only marked a decrease from 3.5% in March, but it also tied for the lowest rate since 1969. Unemployment dipped sharply for Black workers, declining to 4.7% in April from 5% in the previous month. Similarly, the unemployment rate among Hispanic workers declined to 4.4% last month from 4.6%. |
No 5 |
253,000 |
|
Apr-2023 |
|
| |
|
|
|
Nonfarm payrolls growth in March was about in line with expectations, but showed signs that the jobs picture is in the early stages of a slowdown. The Labor Department reported Friday that payrolls grew by 236,000 for the month, compared to the Dow Jones estimate for 238,000 and below the upwardly revised 326,000 in February. The unemployment rate ticked lower to 3.5%, against expectations that it would hold at 3.6%, with the decrease coming as labor force participation increased to its highest level since before the Covid pandemic. Though it was close to what economists had expected, the total was the lowest monthly gain since December 2020 and comes amid efforts from the Federal Reserve to slow labor demand in order to cool inflation. Along with the payroll gains came a 0.3% increase in average hourly earnings, pushing the 12-month increase to 4.2%, the lowest level since June 2021. The average work week edged lower to 34.4 hours. |
No 4 |
236,000 |
|
Mar-2023 |
|
| |
|
|
|
Payrolls rose 311,000 in February, more than expected, showing solid growth. Nonfarm payrolls rose by 311,000 in February, above the 225,000 Dow Jones estimate. The unemployment rate increased to 3.6%, above expectations. Average hourly earnings increased 4.6% from a year ago, less than expected, in a positive sign for inflation. Leisure and hospitality, retail and government led job creation by sector. Job creation decelerated in February but was still stronger than expected despite the Federal Reserve’s efforts to slow the economy and bring down inflation. Nonfarm payrolls rose by 311,000 for the month, the Labor Department reported Friday. That was above the 225,000 Dow Jones estimate and a sign that the employment market is still hot. |
No 3 |
311,000 |
|
Feb-2023 |
|
| |
|
|
|
Jobs report shows increase of 517,000 in January, crushing estimates, as unemployment rate hit 53-year low. The January jobs report showed nonfarm payrolls increased by 517,000, far higher than the 187,000 market estimate. The unemployment rate fell to 3.4% versus the estimate for 3.6%. That is the lowest jobless level since May 1969. Leisure and hospitality added 128,000 jobs to lead all sectors. Other significant gainers were professional and business services (82,000), government (74,000) and health care (58,000). The employment picture started off 2023 on a stunningly strong note, with nonfarm payrolls posting their biggest gain since July 2022. Nonfarm payrolls increased by 517,000 for January, above the Dow Jones estimate of 187,000 and December’s gain of 260,000, according to a Labor Department report Friday. |
No 2 |
517,000 |
|
Jan-2023 |
|
| |
|
|
|
Nonfarm payrolls increased by 223,000 for the month, above the Dow Jones estimate for 200,000, while the unemployment rate fell to 3.5%, 0.2 percentage point below the expectation. The job growth marked a small decrease from the 256,000 gain in November, which was revised down 7,000 from the initial estimate.Wage growth was less than expected in an indication that inflation pressures could be weakening. Average hourly earnings rose 0.3% for the month and increased 4.6% from a year ago. The respective estimates were for growth of 0.4% and 5%.The relative strength in job growth comes despite repeated efforts by the Fed to slow the economy, the labor market in particular. The central bank raised its benchmark interest rate seven times in 2022 for a total of 4.25 percentage points, with more increases likely on the way. Primarily, the Fed is looking to bridge a gap between demand and supply. As of November, there were about 1.7 job openings for every available worker, an imbalance that has held steady despite the Fed’s rate hikes. The strong demand has pushed wages higher, though they mostly haven’t kept up with inflation |
No 1 |
223,000 |
|
Dec-2022 |
|
| |
|
|
|
|
|
|
|
|
| |
|
|
|
|
|
| |
|
|
|
|
|
|
|
|
|
|
|
|
|
|
|
Brief News | 2022 |
|
|
Non-Farm Payroll | Employment |
|
Today's Week |
|
|
|
|
|
|
|
|
|
|
|
|
|
Non-Farm Payroll | Employment (8:30)
| DATE/WEEK |
HIGHLIGHTS |
FOR |
ACTUAL |
|
The US economy gained 263,000 jobs in November, 63,000 above the consensus estimate. The larger surprise was that average hourly earnings rose by 0.55%, the fastest pace since January. The robust jobs market is good news for American workers, but concerning for the Federal Reserve and equity bulls alike. It indicates that the Fed’s strategy to rein in inflation by raising interest rates isn’t quite working and that more painful interest rate hikes are coming. What’s happening: Executives often try to pass the cost of paying higher wages on to their customers by raising the prices of their goods and services. When prices rise, workers often demand more pay to keep up with the cost of living. And if they receive it, prices rise again to maintain corporate profits. This is the inflation-inducing wage-price spiral that Fed officials are desperately attempting to avoid. The holy grail of economics, then, is often to keep wages up but prices low |
No 12 |
263,000 |
|
Nov-2022 |
|
| |
|
|
|
U.S. payrolls surged by 261,000 in October, better than expected as hiring remains strong. Nonfarm payrolls grew by 261,000 in October, better than the estimate for 205,000. The unemployment rate moved higher to 3.7%, while a broader jobless measure also increased, to 6.8%. Big job gainers by industry included health care, professional and technical services, and leisure and hospitality. Average hourly earnings rose 0.4% for the month and were up 4.7% from a year ago. |
No 11 |
261,000 |
|
Oct-2022 |
|
| |
|
|
|
Payrolls rose 315,000 in August as companies keep hiring. Nonfarm payrolls rose by 315,000 jobs in August, just below the Dow Jones estimate for 318,000. The unemployment rate climbed to 3.7%, two-tenths of a percentage point higher than expectations. Wages also rose, with average hourly earnings up 5.2% from a year ago, slightly lower than the estimate. The biggest sector gainers were professional and business services, health care and retail. Nonfarm payrolls rose solidly in August amid an otherwise slowing economy, while the unemployment rate ticked higher as more workers rejoined the labor force, the Bureau of Labor Statistics reported Friday. The economy added 315,000 jobs for the month, just below the Dow Jones estimate for 318,000 and well off the 526,000 in July and the lowest monthly gain since April 2021. The unemployment rate rose to 3.7%, two-tenths of a percentage point higher than expectations, largely due to a gain in the labor force participation rate to 62.4%, tied for the highest level of the year. A broader measure of unemployment that includes discouraged workers and those holding part-time jobs for economic reasons climbed to 7% from 6.7%. Wages continued to rise, though slightly less than expectations. Average hourly earnings increased 0.3% for the month and 5.2% from a year ago, both 0.1 percentage point below estimates. |
No 10 |
263,000 |
|
Sep-2022 |
|
| |
|
|
|
August’s jobs report showed the economy add 315,000 payrolls last month and well below the shock 528,000 added in July, while the unemployment rate rose slightly to 3.7%. Dow Jones estimates anticipated 318,000 jobs added last month and an unchanged unemployment rate of 3.5%. The report could play a key role in the Federal Open Market Committee’s deliberations over its next monetary policy move. Earlier in the summer, the Fed backed away from forward guidance for future rate adjustments, focusing instead on making data-dependent decisions — potentially making key data points like nonfarm payrolls even more important. On Wednesday, jobs data from payroll processing company ADP showed that private payrolls increased by just 132,000 in August, a fall from the 268,000 rise in July.The unemployment rate rose to 3.7%, two-tenths of a percentage point higher than expectations. |
No 9 |
315,000 |
|
Aug-2022 |
|
| |
|
|
|
Payrolls increased 528,000 in July 2022, much better than expected in a sign of strength for jobs market. Nonfarm payrolls rose 528,000 for the month and the unemployment rate was 3.5%, easily topping the Dow Jones estimates of 258,000 and 3.6%, respectively. Wage growth also surged, as average hourly earnings jumped 0.5% for the month and 5.2% from a year ago, higher than estimates. Traders are now pricing in a higher likelihood of a 0.75 percentage point hike for the next Federal Reserve meeting in September. Nonfarm payrolls rose 528,000 for the month and the unemployment rate was 3.5%, easily topping the Dow Jones estimates of 258,000 and 3.6%, respectively. The unemployment rate is now back to its pre-pandemic level and tied for the lowest since 1969, though the rate for Blacks rose 0.2 percentage point to 6%. Wage growth also surged higher, as average hourly earnings jumped 0.5% for the month and 5.2% from the same time a year ago. |
No 8 |
528,000 |
|
Jul-2022 |
|
| |
|
|
|
Payrolls increased 372,000 in June, more than expected, as jobs market defies recession fears. Nonfarm payrolls in June increased by 372,000, topping the 250,000 estimate. The unemployment rate remained at 3.6%. Average hourly earnings rose 5.1% from a year ago, a touch faster than estimates. Education and health services led job creation, followed by professional and business services and leisure and hospitality.The unemployment rate held steady at 3.6%, still close to the 52-year low last reached in the months before the pandemic hit. The June job total, slightly down from May's revised 384,000 jobs added, far surpassed expectations. |
No 7 |
372,000 |
|
Jun-2022 |
|
| |
|
|
|
Nonfarm payrolls rose by a better-than-expected 390,000 in May, the Labor Department said Friday, in signs of persistent demand and supply shortfalls in the job market. Employment growth was mostly solid across the board. Construction jobs rose by 36,000 after being flat the previous month. Professional and business services employment rose by 75,000, accelerating from 49,000 in the prior month. Leisure and hospitality saw the biggest jump, gaining 84,000 jobs. That was roughly flat month over month but well off the fast pace seen last year. Leisure and hospitality saw the biggest jump, gaining 84,000 jobs. That was roughly the same as the month before but well off the fast pace seen last year. “We’re adding a large number of jobs, but not quite at the pace we saw in 2021. Which makes sense, because we’re getting closer and closer to recovering all the jobs we lost from the pandemic,” said Nick Bunker, economic research director for North America at Indeed Hiring Lab. One negative of the report came in retail, which shed roughly 61,000 jobs in May. |
No 6 |
390,000 |
|
May-2022 |
|
| |
|
|
|
Employment Report Shows Continued Solid Job Growth. Today's jobs report showed further job gains in April, following months of solid growth in the first quarter of 2022. The labor market continues to expand, especially in in-person services and in other industries that have yet to fully recover job losses incurred since the pandemic. Severe labor shortages continue to drive up wages, adding additional pressure on inflation. The labor market remains strong while the Federal Reserve maintains its focus on stabilizing prices with increasing interest rates and a commitment to shrinking their asset portfolio. Nonfarm payroll employment increased by 428,000 in April, after a slight downwardly revised increase of 428,000 in March. The labor force participation rate decreased slightly to 62.2 percent, compared to 62.4 percent in March, while the unemployment rate remained unchanged at 3.6 percent. |
No 5 |
428,000 |
|
Apr-2022 |
|
| |
|
|
|
The US economy added 431,000 jobs in March, bringing the unemployment rate to a new pandemic-era low of 3.6%. The unemployment rate declined to 3.6%, below expectations. U.S. job growth continued at a brisk clip in March, with the unemployment rate falling to a new two-year low of 3.6% and wages re-accelerating, positioning the Federal Reserve to raise interest rates by a hefty 50 basis points in May. The unemployment rate dropped to 3.6%, the lowest since February 2020, from 3.8% in February. An alternative measure of unemployment, which includes discouraged workers and those holding part-time jobs for economic reasons fell to a seasonally adjusted 6.9%, down 0.3 percentage points from the previous month. |
No 4 |
431,000 |
|
Mar-2022 |
|
| |
|
|
|
U.S. economy added a greater-than-forecast 678,000 jobs in February. Job growth accelerated in February, posting its biggest monthly gain since July as the employment picture got closer to its pre-pandemic self. Nonfarm payrolls for the month grew by 678,000 and the unemployment rate was 3.8%, the Labor Department’s Bureau of Labor Statistics reported Friday. That compared to estimates of 440,000 for payrolls and 3.9% for the jobless rate. In a sign that inflation could be cooling, wages barely rose for the month, up just 1 cent an hour or 0.03%, compared to estimates for a 0.5% gain. The year-over-year increase was 5.13%, well below the 5.8% Dow Jones estimate as more lower-wage workers were hired and 12-month comparisons helped mute more recent gains.The unemployment rate for the industry tumbled to 6.6%, a slide of 1.6 percentage points from January and closer to the 5.7% of February 2020. Wages actually declined slightly, falling two cents an hour to $19.35. The increase in hiring for bars, restaurants, hotels and other similar businesses likely is contributing to the slower pace of pay increases. |
No 3 |
678,000 |
|
Feb-2022 |
|
| |
|
|
|
Payrolls rose far more than expected in January despite surging omicron cases that seemingly sent millions of workers to the sidelines, the Labor Department reported Friday. Nonfarm payrolls surged by 467,000 for the month, while the unemployment rate edged higher to 4%, according to the Bureau of Labor Statistics. The Dow Jones estimate was for payroll growth of 150,000 and a 3.9% unemployment rate. December, which initially was reported as a gain of 199,000, went up to 510,000. November surged to 647,000 from the previous reported 249,000. For the two months alone, the initial counts were revised up by 709,000. The revisions came as part of the annual adjustments from the BLS that saw sizeable changes for many of the months in 2021.There was more good jobs news: The labor force participation rate rose to 62.2%, a 0.3 percentage point gain. That took the rate, which is closely watched by Fed officials, to its highest level since March 2020 and within 1.2 percentage points of where it was pre-pandemic. Stock market futures declined on the report while government bond yields rose sharply, with the benchmark 10-year Treasury note rising to 1.9%. Markets have been anticipating an inflation-fighting Fed to hike interest rates at least five times in 2022, so the surprisingly powerful jobs market is likely to do little to dissuade that sentiment. |
No 2 |
467,000 |
|
Jan-2022 |
|
| |
|
|
|
The U.S. economy added far fewer jobs than expected in December2021 just as the nation was grappling with a massive surge in Covid cases, the Labor Department said Friday.Nonfarm payrolls grew by 199,000, while the unemployment rate fell to 3.9%, according to Bureau of Labor Statistics data. That compared with the Dow Jones estimate of 422,000 for the payrolls number and 4.1% for the unemployment rate. The unemployment rate was a fresh pandemic-era low and near the 50-year low of 3.5% in February 2020. That decline came even though the labor force participation rate was unchanged at 61.9% amid an ongoing labor shortage in the U.S. The BLS data conflicted strongly with a report earlier in the week from payrolls processing firm ADP, which said private payrolls surged by 807,000. Weekly jobless claims also have been trending near a 52-year low, mostly recently coming in at 207,000 for the week ended Jan. 1. |
No 1 |
199,00 |
|
Dec-2021 |
|
| |
|
|
|
|
|
|
|
|
| |
|
|
|
|
|
| |
|
|
|
|
|
|
|
|
|
|
|
|
|
|
|
Brief News | 2021 |
|
|
Non-Farm Payroll | Employment |
|
Today's Week |
|
|
|
|
|
|
|
|
|
|
|
|
|
Non-Farm Payroll | Employment (8:30)
| DATE/WEEK |
HIGHLIGHTS |
FOR |
ACTUAL |
|
Job growth disappoints in November, with a gain of just 210,000, despite high hopes. Nonfarm payrolls increased by 210,000 in November, following a gain of 546,000 the previous month. The number was well below Wall Street expectations of 573,000. Despite the big hiring miss, the unemployment rate fell to 4.2%, a 0.4% percentage point decline that came even with rising labor force participation. Professional and business services and transportation and warehousing led gains, while hiring in leisure and hospitality was sluggish and retail lost jobs despite the traditional holiday hiring season. |
No 12 |
210,000 |
|
Nov-2021 |
|
| |
|
|
|
Total nonfarm payroll employment rose by 531,000 in October 2021, following increases of 312,000 in September and 483,000 in August. Employment in leisure and hospitality increased by 164,000, or 1.1 percent in October 2021, while employment in professional and business services rose by 100,000, or 0.5 percent. United States October 2021 Total Nonfarm Payroll Employment Rose By 531,000, the Unemployment Rate Declined to 4.6% - Notable Job Gains in Leisure and Hospitality, October job growth beats expectations, and revisions show August and September were far better than first reported.. |
No 11 |
531,000 |
|
Oct-2021 |
|
| |
|
|
|
Nonfarm payrolls increased by 194,000 in September, compared to the Dow Jones estimate for 500,000. The unemployment rate dropped to 4.8%, better than the expected 5.1%. Leisure and hospitality along with professional and business services and retail led job creation. Markets initially reacted little to what was a mixed bag of a report held back by a sharp decline in government jobs. Nonfarm payrolls increased by 194,000 in September, compared to the Dow Jones estimate for 500,000. The unemployment rate dropped to 4.8%, better than the expected 5.1%. |
No 10 |
194,000 |
|
Sep-2021 |
|
| |
|
|
|
Nonfarm payroll growth in August increased by just 235,000 vs. expectations of 720,000. The unemployment rate fell to 5.2%, in line with estimates. Leisure and hospitality jobs were flat during the month after leading the way for much of the year. Wages rose at a 4.3% year-over-year clip. Total nonfarm employment in the United States rose by only 235,000 jobs in August 2021 – a disappointing figure considering monthly job growth had averaged 586,000 jobs per month so far this year – while the unemployment rate declined to 5.2 percent, |
No 9 |
235,000 |
|
Aug-2021 |
|
| |
|
|
|
Hiring rose in July at its fastest pace in nearly a year despite fears over Covid-19′s delta variant and as companies struggled with a tight labor supply, the Labor Department reported Friday. Nonfarm payrolls increased by 943,000 for the month while the unemployment rate dropped to 5.4%, according to the department’s Bureau of Labor Statistics. The payroll increase was the best since August 2020. Economists surveyed by Dow Jones had been looking for 845,000 new jobs and a headline unemployment rate of 5.7%. However, estimates were diverse amid conflicting headwinds and tailwinds and an uncertain path ahead for the economy. |
No 8 |
943,000 |
|
Jul-2021 |
|
| |
|
|
|
The economy added 850,000 jobs last month, according to the Bureau of Labor Statistics. Economists surveyed by Dow Jones were expecting an addition of 706,000. The print topped the 559,000 jobs created in May. “This is a strong report and should be taken as a sign of things to come for an accelerating labor market,” Aberdeen Standard Investments deputy chief economist James McCann said in a note In addition to the job gains, average hourly wages rose 0.3% for the month and are up 3.6% year over year, matching expectations.Unemployment rate 5.9% vs 5.7% expected. |
No 7 |
850,000 |
|
Jun-2021 |
|
| |
|
|
|
US non-farm payroll employment grew 559k in May, below expectation of 621k. Prior month’s figure was revised slightly up from 266k to 278k. Total non-farm payroll employment is down by -7.6m, or -5.0%, from its pre-pandemic level in February 2020. Unemployment rate dropped to 5.8%, down from 6.1%, slightly below expectation of 5.9%. Number of unemployed persons fell by -496k to 9.3m. The unemployment measures are still well above pre-pandemic levels of 3.5% and 5.7m, in February 2020. Labor force participation rate was little changed at 61.6%, and remained in range of 61% to 61.7% since June 2020. Wage growth was strong, as average hourly earnings rose 0.5% mom, versus expectation of 0.2% mom. |
No 6 |
559,000 |
|
May-2021 |
|
| |
|
|
|
Hiring was a huge letdown in April, with nonfarm payrolls increasing by a much less than expected 266,000 and the unemployment rate rose to 6.1% amid an escalating shortage of available workers. Dow Jones estimates had been for 1 million new jobs and an unemployment rate of 5.8%. Many economists had been expecting an even higher jobs number amid signs that the U.S. economy was roaring back to life. There was more bad news: March’s originally estimated total of 916,000 was revised down to 770,000, though February saw an upward revision to 536,000 from 468,000. |
No 5 |
266,000 |
|
Apr-2021 |
|
| |
|
|
|
Nonfarm payrolls rose by 916,000 in March, while the unemployment rate declined to 6%. The job growth was well ahead of Dow Jones estimates for 675,000 and the fastest since August 2020. Gains were strongest in leisure and hospitality, while construction soared by 110,000. Revisions also added 156,000 jobs to the totals for January and February. Job growth boomed in March at the fastest pace since last summer as stronger economic growth and an aggressive vaccination effort contributed to a surge in hospitality and construction jobs, the Labor Department reported Friday. Nonfarm payrolls increased by 916,000 for the month while the unemployment rate fell to 6%. |
No 4 |
916,000 |
|
Mar-2021 |
|
| |
|
|
|
Job growth surges in February on hiring jump in restaurants and bars Nonfarm payrolls increased by 379,000 in February and the unemployment rate was 6.2%. Dow Jones estimates for were 210,000 new jobs and a headline jobless rate of 6.3%. Most of the hiring came in the hospitality sector, which saw 355,000 new jobs. Education, construction and mining all saw declines.. Hiring surged in February as U.S. economic activity picked up with Covid-19 cases steadily dropping and vaccine rollouts providing hope for more growth. The Labor Department reported Friday that nonfarm payrolls jumped by 379,000 for the month and the unemployment rate fell to 6.2%. That compared with expectations of 210,000 new jobs and the unemployment rate holding steady from the 6.3% rate in January. |
No 3 |
379,000 |
|
Feb-2021 |
|
| |
|
|
|
The economy gained just 49,000 jobs in January 2021 as recovery sputters amid pressure from virus. The U.S. gained back a paltry 49,000 jobs in January, a sign that the economic recovery may be faltering under ongoing pressure from the coronavirus. The unemployment rate fell to 6.3 percent from 6.7 percent in December, but that decline was driven by more than 400,000 people who left the workforce instead of getting jobs.
The January data, released by the Bureau of Labor Statistics, is another reminder of how much ground the labor market still needs to regain to return to pre-pandemic levels. |
No 2 |
49,000 |
|
Jan-2021 |
|
| |
|
|
|
The U.S. lost jobs in December 2020 for the first time in eight months as the coronavirus bore down on the economy again and forced businesses to resort to more layoffs. The government and private sector shed 140,000 jobs last month, the Bureau of Labor Statistics said Friday. The decline in employment was the first since last April, when the U.S. lost a gargantuan 20.8 million jobs in that one month alone.The official unemployment rate, meanwhile, was unchanged at 6.7%. Yet economists estimate true unemployment is several points higher because the official jobless rate doesn’t include about 4 million people who left the labor force last year. |
No 1 |
-140,000 |
|
Dec-2020 |
|
| |
|
|
|
|
|
|
|
|
| |
|
|
|
|
|
|
| |
|
|
|
|
|
|
|
|
|
|
|
|
|
|
|
|
|
|
|
|
|
Definitions | Explain |
|
|
Non-Farm Payroll | Employment |
|
Today's Week |
|
|
|
|
|
|
|
|
|
|
|
|
| |
|
|
|
|
| |
|
| EMPLOYMENT SITUATION |
The Employment Situation Report, also known as the Labor Report, is made up two separate and equally important surveys:
1. The Establishment Survey Data
The payroll employment number comes from the establishment survey, and is mainly based on Social Security tax filings where every employee for who those taxes have been withheld and also paid by employers is counted. This is a very reliable number.
The main reason it is subject to revision from month to month is because large businesses submit their payments weekly, and small businesses submit their payments less often. Generally, the revision numbers are reflections of new data coming from small and mid-size businesses.
2. The Household Survey Data
The unemployment rate comes from the household survey. This is one of the best-run research surveys in the world, actually, and it is the survey used to calculate the unemployment rate. One of the problems withthe BLS releases is that they report the changes in payrolls and the unemployment rate together, leading most people to believe that they are derived from exactly the same data. They are not.
The household survey data are critical, because they include self-employment by proprietors, partners, and freelance workers. This is a broader universe than the payroll employment data, by definition, and a better indicator of economic conditions, especially in this age where workers can be anywhere and they can offer their services well beyond the areas where they reside.
The Employment Situation Report has many significant figures such as: Change in Non Farm Payrolls, Unemployment, Manufacturing Payrolls, and Average Hourly Earnings.
Manufacturing Payrolls
The updated macroeconomic indicators include the new productivity data that show productivity as still greater than GDP, indicating that employment growth will be slow. When GDP is greater than productivity is the time when employment booms occur.
Measures job creation or loss in manufacturing sector. Manufacturing Payroll is reported as the net change in jobs from the previous month's figure. The figure is significant as an indicator of the health of the manufacturing sector. A high Manufacturing Payrolls number can signal increased demand for manufactured goods and a subsequent increase in production.
Average Hourly Earnings
An indicator of how the average level of pay is changing. The Average Hourly Earnings figure provides insight into future spending and inflation. A High Average Hourly Earnings bodes well for future consumption, as workers have more disposable income. High figures may indicate inflationary pressures due to employee's additional potential to spend. The figure is either measured in hourly or weekly averages or as a percent change from the previous month.
The headline figures for this report are reported monthly, as the total number of new jobs in thousands (say, 120K new jobs), and the unemployment rate. |
|
|
| |
|
|
|
|
|
|
|
|
|
|
|
| |
|
|
|
|
|
|
| DATA INFORMATION |
NON-FARM PAYROLL |
| SOURCE |
Bureau of Labor Statistics (BLS), U.S. Department of Labor.
|
| WEB |
www.bls.gov |
| FREQUENCY |
Monthly |
| AVAILABILITY |
Usually the first Friday day of the month |
| COVERAGE |
Data are for the previous month. Data for June are released in July. |
| REVISIONS |
Yes |
| IMPORTANCE |
Employment - Very Important |
|
| |
|
|
|
|
|
|
|
|
|
|
|
|