 |
 |
|
 |
Industrial Production | Manufacturing |
|
 |
|
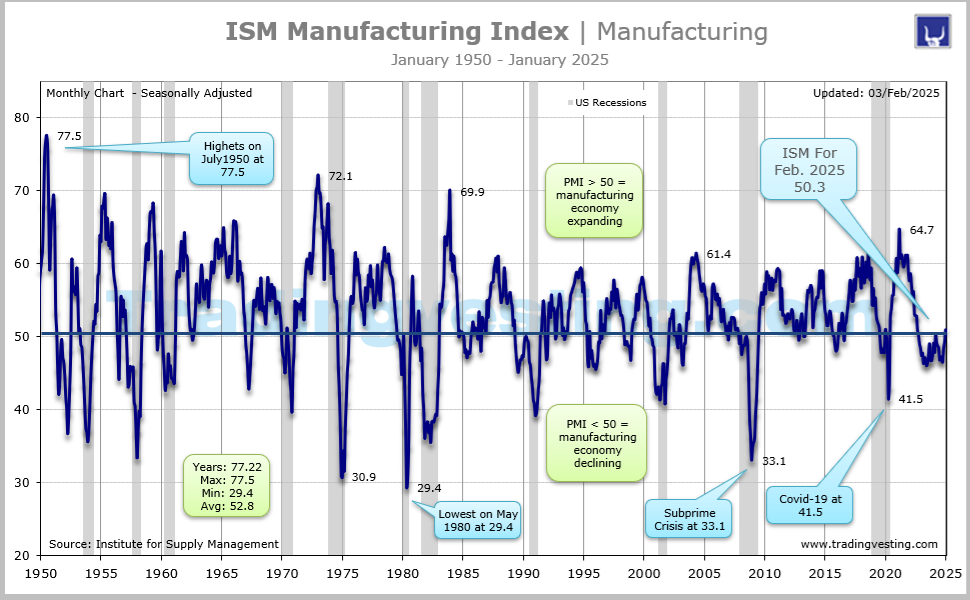
Industrial Production, Manufacturing Output and Capacity Utilization are important measures of current output for the US economy and helps to define turning points in the business cycle and trends in the manufacturing sector. Read More...
|
|
|
|
|
|
|
| |
|
| |
 2. Industrial Production (2 of 9)
 2. Capacity Utilization (2 of 9)
 3. Durable Goods Orders (3 of 9)
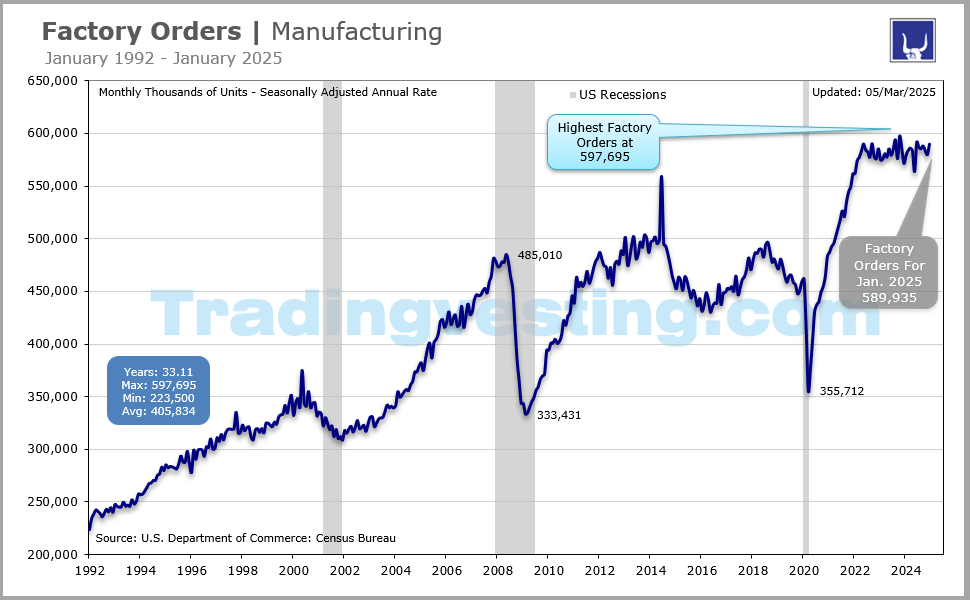
 4. Factory Orders (4 of 9)
 5. Empire State Mafg Index (5 of 9)
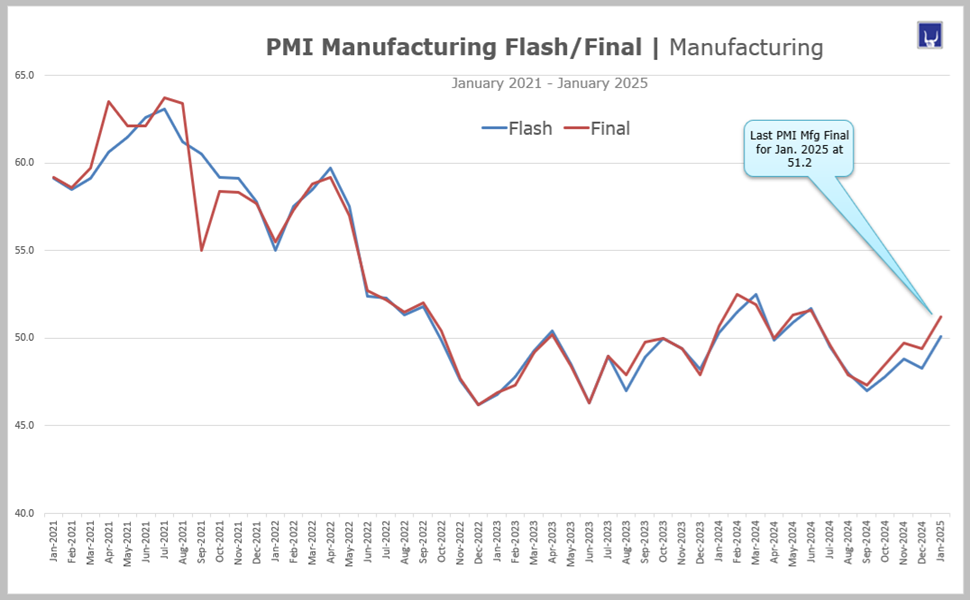
 6. PMI Mfg Final (6 of 9)
 1. ISM Manufacturing Index (1 of 9)
|
 |
|
|
|
|
| |
|
→ Big Chart |
|
→ Release |
|
| |
|
|
|
|
|
|
|
|
|
|
|
|
|
|
|
|
|
|
|
 |
|
Big Chart | Large Data |
 |
|
Industrial Production | Manufacturing |
|
Today's Week |
 |
|
|
|
|
|
|
|
|
|
|
|
|
|
| |
|
|
|
|
|
|
|
|
|
|
|
|
|
|
|
|
|
|
|
|
|
Slides | Nine 9 |
|
|
Industrial Production | Manufacturing |
|
Today's Week |
|
|
|
|
|
|
|
|
|
|
|
|
|
|
| |
|
|
|
|
|
|
|
|
|
|
|
|
|
|
|
|
|
|
|
|
|
Release Schedule | 2026 |
|
|
Industrial Production | Manufacturing |
|
Today's Week |
|
|
|
|
|
|
|
|
|
|
|
|
|
Industrial Production (At 9:15 a.m ET)
| SCHEDULE 2026 |
No 1 |
No 2 |
No 3 |
No 4 |
No 5 |
No 6 |
No 7 |
No 8 |
No 9 |
No 10 |
No 11 |
No 12 |
| Release | Week |
|
|
|
|
|
|
|
|
|
|
|
|
| Release | Date |
|
|
|
|
|
|
|
|
|
|
|
|
| Release | Day |
|
|
|
|
|
|
|
|
|
|
|
|
 |
|
|
|
|
|
|
|
|
|
|
|
|
| Prior |
0.2% |
0.4% |
0.7% |
... |
... |
... |
... |
... |
... |
... |
... |
... |
| Prior Revised |
0.4% |
0.2% |
... |
... |
... |
... |
... |
... |
... |
... |
... |
... |
| CONSENSUS |
0.1% |
0.4% |
0.1% |
... |
... |
... |
... |
... |
... |
... |
... |
... |
| Consensus Low |
-0.4% |
-0.2% |
-0.3% |
... |
... |
... |
... |
... |
... |
... |
... |
... |
| Consensus High |
0.3% |
0.6% |
0.7% |
... |
... |
... |
... |
... |
... |
... |
... |
... |
| INDUSTRIAL PROD |
0.4% |
0.7% |
0.2% |
... |
... |
... |
... |
... |
... |
... |
... |
... |
| RATING |
|
|
|
|
|
|
|
|
|
|
|
|
| Month For: |
Dec-25 |
Jan-26 |
Feb-26 |
Mar-26 |
Apr-26 |
May-26 |
Jun-26 |
Jul-26 |
Aug-26 |
Sep-26 |
Oct-26 |
Nov-26 |
|
|
|
|
|
|
|
|
|
|
|
|
|
| MFG OUTPUT |
No 1 |
No 2 |
No 3 |
No 4 |
No 5 |
No 6 |
No 7 |
No 8 |
No 9 |
No 10 |
No 11 |
No 12 |
| Prior |
0.0% |
0.2% |
0.6% |
... |
... |
... |
... |
... |
... |
... |
... |
... |
| Prior Revised |
0.3% |
0.0% |
0.8% |
... |
... |
... |
... |
... |
... |
... |
... |
... |
| CONSENSUS |
... |
0.2% |
0.2% |
... |
... |
... |
... |
... |
... |
... |
... |
... |
| Mfg Output |
0.2% |
0.6% |
0.2% |
... |
... |
... |
... |
... |
... |
... |
... |
... |
| RATING |
|
|
|
|
|
|
|
|
|
|
|
|
| Month For |
Dec-25 |
Jan-26 |
Feb-26 |
Mar-26 |
Apr-26 |
May-26 |
Jun-26 |
Jul-26 |
Aug-26 |
Sep-26 |
Oct-26 |
Nov-26 |
|
|
|
|
|
|
|
|
|
|
|
|
|
| C. UTILIZATION |
No 1 |
No 2 |
No 3 |
No 4 |
No 5 |
No 6 |
No 7 |
No 8 |
No 9 |
No 10 |
No 11 |
No 12 |
| Prior |
76.0% |
76.3% |
76.2% |
... |
... |
... |
... |
... |
... |
... |
... |
... |
| Prior Revised |
76.1% |
75.7% |
75.3% |
... |
... |
... |
... |
... |
... |
... |
... |
... |
| CONSENSUS |
76.0% |
76.5% |
76.2% |
... |
... |
... |
... |
... |
... |
... |
... |
... |
| Capa.Utilization: |
76.3% |
76.2% |
76.3% |
... |
... |
... |
... |
... |
... |
... |
... |
... |
| Month For |
Dec-25 |
Jan-26 |
Feb-26 |
Mar-26 |
Apr-26 |
May-26 |
Jun-26 |
Jul-26 |
Aug-26 |
Sep-26 |
Oct-26 |
Nov-26 |
|
|
|
|
|
|
|
|
|
|
|
|
|
|
|
| |
|
| |
|
|
|
|
|
|
|
|
|
|
|
Release Schedule | 2025 |
|
|
Industrial Production | Manufacturing |
|
Today's Week |
|
|
|
|
|
|
|
|
|
|
|
|
|
Industrial Production (At 9:15 a.m ET)
| SCHEDULE 2025 |
No 1 |
No 2 |
No 3 |
No 4 |
No 5 |
No 6 |
No 7 |
No 8 |
No 9 |
No 10 |
No 11 |
No 12 |
| Release | Week |
|
|
|
|
|
|
|
|
|
|
|
|
| Release | Date |
|
|
|
|
|
|
|
|
|
|
|
|
| Release | Day |
|
|
|
|
|
|
|
|
|
|
|
|
|
|
|
|
|
|
|
|
|
|
|
|
|
| Prior |
-0.1% |
0.9% |
0.5% |
0.7% |
-0.3% |
0.0% |
-0.2% |
0.3% |
-0.1% |
0.1% |
0.1% |
0.1% |
| Prior Revised |
0.2% |
1.0% |
0.3% |
0.8% |
... |
0.1% |
0.0% |
0.4% |
-0.4% |
0.1% |
-0.3% |
... |
| CONSENSUS |
0.3% |
0.3% |
0.2% |
-0.2% |
0.2% |
0.1% |
0.1% |
0.0% |
0.0% |
-0.1% |
0.1% |
0.1% |
| Consensus Low |
0.1% |
0.1% |
-0.2% |
-0.5% |
-0.1% |
-0.4% |
-0.2% |
-0.3% |
-0.4% |
-0.1% |
-0.1% |
-0.4% |
| Consensus High |
0.5% |
0.4% |
0.4% |
0.3% |
0.5% |
0.2% |
0.3% |
0.3% |
0.3% |
0.1% |
0.2% |
0.3% |
| INDUSTRIAL PROD |
0.9% |
0.5% |
0.7% |
-0.3% |
0.0% |
-0.2% |
0.3% |
-0.1% |
0.1% |
-0.1% |
0.1% |
0.2% |
| RATING |
|
|
|
|
|
|
|
|
|
|
|
|
| Month For: |
Dec-24 |
Jan-25 |
Feb-25 |
Mar-25 |
Apr-25 |
May-25 |
Jun-25 |
Jul-25 |
Aug-25 |
Sep-25 |
Oct-25 |
Nov-25 |
|
|
|
|
|
|
|
|
|
|
|
|
|
| MFG OUTPUT |
No 1 |
No 2 |
No 3 |
No 4 |
No 5 |
No 6 |
No 7 |
No 8 |
No 9 |
No 10 |
No 11 |
No 12 |
| Prior |
0.2% |
0.6% |
-0.1% |
0.9% |
0.3% |
-0.4% |
0.1% |
0.1% |
0.0% |
0.2% |
0.2% |
0.0% |
| Prior Revised |
0.4% |
0.5% |
0.1% |
1.0% |
0.4% |
-0.5% |
0.3% |
0.3% |
-0.1% |
... |
... |
... |
| CONSENSUS |
0.4% |
... |
0.1% |
0.2% |
0.0% |
0.1% |
0.1% |
0.1% |
0.1% |
0.0% |
0.0% |
... |
| Mfg Output |
0.6% |
-0.1% |
0.9% |
0.3% |
-0.4% |
0.1% |
0.1% |
0.0% |
0.2% |
-0.4% |
0.0% |
0.0% |
| RATING |
|
|
|
|
|
|
|
|
|
|
|
|
| Month For |
Dec-24 |
Jan-25 |
Feb-25 |
Mar-25 |
Apr-25 |
May-25 |
Jun-25 |
Jul-25 |
Aug-25 |
Sep-25 |
Oct-25 |
Nov-25 |
|
|
|
|
|
|
|
|
|
|
|
|
|
| C. UTILIZATION |
No 1 |
No 2 |
No 3 |
No 4 |
No 5 |
No 6 |
No 7 |
No 8 |
No 9 |
No 10 |
No 11 |
No 12 |
| Prior |
76.8% |
77.6% |
77.8% |
78.2% |
77.8% |
77.7% |
77.4% |
77.6% |
77.5% |
75.9% |
77.4% |
75.9% |
| Prior Revised |
77.0% |
77.5% |
77.7% |
... |
... |
... |
77.5% |
77.7% |
77.4% |
76.0% |
75.3% |
... |
| CONSENSUS |
77.0% |
77.7% |
77.8% |
78.0% |
77.9% |
77.7% |
77.4% |
77.6% |
77.4% |
77.3% |
77.3% |
75.9% |
| Capa.Utilization: |
77.6% |
77.8% |
78.2% |
77.8% |
77.7% |
77.4% |
77.6% |
77.5% |
77.4% |
75.9% |
75.9% |
76.0% |
| Month For |
Dec-24 |
Jan-25 |
Feb-25 |
Mar-25 |
Apr-25 |
May-25 |
Jun-25 |
Jul-25 |
Aug-25 |
Sep-25 |
Oct-25 |
Nov-25 |
|
|
|
|
|
|
|
|
|
|
|
|
|
|
|
| |
|
| |
|
|
|
|
|
|
|
|
|
|
|
Release Schedule | 2024 |
|
|
Industrial Production | Manufacturing |
|
Today's Week |
|
|
|
|
|
|
|
|
|
|
|
|
|
Industrial Production (At 9:15 a.m ET)
| SCHEDULE 2024 |
No 1 |
No 2 |
No 3 |
No 4 |
No 5 |
No 6 |
No 7 |
No 8 |
No 9 |
No 10 |
No 11 |
No 12 |
| Release | Week |
|
|
|
|
|
|
|
|
|
|
|
|
| Release | Date |
|
|
|
|
|
|
|
|
|
|
|
|
| Release | Day |
|
|
|
|
|
|
|
|
|
|
|
|
|
|
|
|
|
|
|
|
|
|
|
|
|
| Prior |
0.2% |
0.1% |
-0.1% |
0.1% |
0.4% |
0.0% |
0.9% |
0.6% |
-0.6% |
0.8% |
-0.3% |
-0.3% |
| Prior Revised |
0.0% |
0.0% |
-0.5% |
0.4% |
0.1% |
... |
... |
0.3% |
-0.9% |
0.3% |
0.5% |
-0.4% |
| CONSENSUS |
-0.1% |
0.2% |
0.0% |
0.4% |
0.1% |
0.3% |
0.3% |
-0.1% |
0.1% |
-0.1% |
... |
0.3% |
| Consensus Low |
-0.4% |
-0.4% |
-0.5% |
-0.1% |
-0.3% |
0.1% |
0.0% |
-0.7% |
0.0% |
-0.2% |
... |
-0.1% |
| Consensus High |
0.1% |
0.5% |
0.2% |
0.6% |
0.4% |
0.6% |
0.6% |
0.3% |
0.5% |
0.1% |
... |
0.5% |
| INDUSTRIAL PROD |
0.1% |
-0.1% |
0.1% |
0.4% |
0.0% |
0.9% |
0.6% |
-0.6% |
0.8% |
-0.3% |
-0.3% |
-0.1% |
| RATING |
|
|
|
|
|
|
|
|
|
|
|
|
| Month For: |
Dec-23 |
Jan-24 |
Feb-24 |
Mar-24 |
Apr-24 |
May-24 |
Jun-24 |
Jul-24 |
Aug-24 |
Sep-24 |
Oct-24 |
Nov-24 |
|
|
|
|
|
|
|
|
|
|
|
|
|
| MFG OUTPUT |
No 1 |
No 2 |
No 3 |
No 4 |
No 5 |
No 6 |
No 7 |
No 8 |
No 9 |
No 10 |
No 11 |
No 12 |
| Prior: |
0.3% |
0.1% |
-0.5% |
0.8% |
0.5% |
-0.3% |
0.9% |
0.4% |
-0.3% |
0.9% |
-0.4% |
-0.5% |
| Prior Revised: |
0.2% |
... |
-1.1% |
1.2% |
0.2% |
-0.4% |
1.0% |
0.0% |
-0.7% |
0.5% |
-0.3% |
-0.7% |
| Consensus: |
0.0% |
-0.1% |
0.0% |
0.3% |
0.3% |
0.2% |
0.0% |
-0.3% |
0.0% |
-0.1% |
... |
0.5% |
| Mfg Output : |
0.1% |
-0.5% |
0.8% |
0.5% |
-0.3% |
0.9% |
0.4% |
-0.3% |
0.9% |
-0.4% |
-0.5% |
0.2% |
| RATING |
|
|
|
|
|
|
|
|
|
|
|
|
| Month For: |
Dec-23 |
Jan-24 |
Feb-24 |
Mar-24 |
Apr-24 |
May-24 |
Jun-24 |
Jul-24 |
Aug-24 |
Sep-24 |
Oct-24 |
Nov-24 |
|
|
|
|
|
|
|
|
|
|
|
|
|
| C. UTILIZATION |
No 1 |
No 2 |
No 3 |
No 4 |
No 5 |
No 6 |
No 7 |
No 8 |
No 9 |
No 10 |
No 11 |
No 12 |
| Prior: |
78.7% |
78.6% |
78.5% |
78.3% |
78.4% |
78.4% |
78.7% |
78.8% |
77.8% |
78.0% |
77.5% |
77.1% |
| Prior Revised: |
78.6% |
78.7% |
78.3% |
78.2% |
78.5% |
78.2% |
78.3% |
78.4% |
77.4% |
77.8% |
77.4% |
77.0% |
| Consensus: |
78.7% |
78.8% |
78.4% |
78.5% |
78.4% |
78.6% |
78.5% |
78.6% |
77.9% |
77.9% |
... |
77.3% |
| Capa.Utilization: |
78.6% |
78.5% |
78.3% |
78.4% |
78.4% |
78.7% |
78.8% |
77.8% |
78.0% |
77.5% |
77.1% |
76.8% |
| Month For: |
Dec-23 |
Jan-24 |
Feb-24 |
Mar-24 |
Apr-24 |
May-24 |
Jun-24 |
Jul-24 |
Aug-24 |
Sep-24 |
Oct-24 |
Nov-24 |
|
|
|
|
|
|
|
|
|
|
|
|
|
|
|
| |
|
| |
|
|
|
|
|
|
|
|
|
|
|
Release Schedule | 2023 |
|
|
Industrial Production | Manufacturing |
|
Today's Week |
|
|
|
|
|
|
|
|
|
|
|
|
|
Industrial Production (At 9:15 a.m ET)
| SCHEDULE 2023 |
No 1 |
No 2 |
No 3 |
No 4 |
No 5 |
No 6 |
No 7 |
No 8 |
No 9 |
No 10 |
No 11 |
No 12 |
| Release | Week |
|
|
|
|
|
|
|
|
|
|
|
|
| Release | Date |
|
|
|
|
|
|
|
|
|
|
|
|
| Release | Day |
|
|
|
|
|
|
|
|
|
|
|
|
|
|
|
|
|
|
|
|
|
|
|
|
|
| Prior |
-0.2% |
-0.7% |
0.0% |
0.0% |
0.4% |
0.5% |
-0.2% |
-0.5% |
1.0% |
0.4% |
0.3% |
-0.6% |
| Prior Revised |
-0.6% |
-1.0% |
0.3% |
0.2% |
0.0% |
... |
-0.5% |
-0.8% |
0.7% |
0.0% |
0.1% |
-0.9% |
| CONSENSUS |
-0.1% |
0.5% |
0.4% |
0.3% |
0.0% |
0.1% |
0.0% |
0.3% |
0.1% |
0.0% |
-0.3% |
0.3% |
| Consensus Low |
-0.8% |
-0.1% |
-0.2% |
-0.1% |
-0.2% |
-0.2% |
-0.3% |
-0.2% |
-0.1% |
-0.3% |
-0.6% |
0.1% |
| Consensus High |
0.4% |
1.0% |
0.8% |
0.5% |
0.3% |
0.3% |
0.3% |
0.7% |
1.0% |
0.5% |
0.3% |
0.7% |
| INDUSTRIAL PROD |
-0.7% |
0.0% |
0.0% |
0.4% |
0.5% |
-0.2% |
-0.5% |
1.0% |
0.4% |
0.3% |
-0.6% |
0.2% |
| RATING |
|
|
|
|
|
|
|
|
|
|
|
|
| Manufacturing Output |
|
|
|
|
|
|
|
|
|
|
|
| Prior: |
-0.6% |
-1.3% |
1.0% |
0.1% |
-0.5% |
1.0% |
0.1% |
-0.3% |
0.5% |
0.1% |
0.4% |
-0.7% |
| Prior Revised: |
-1.1% |
-1.8% |
1.3% |
0.6% |
-0.8% |
0.9% |
-0.2% |
-0.5% |
0.4% |
-0.1% |
0.2% |
-0.8% |
| Consensus: |
-0.2% |
0.4% |
-0.2% |
-0.1% |
0.1% |
0.2% |
0.0% |
0.0% |
0.1% |
-0.1% |
-0.3% |
No |
| Mfg Output : |
-1.3% |
1.0% |
0.1% |
-0.5% |
1.0% |
0.1% |
-0.3% |
0.5% |
0.1% |
0.4% |
-0.7% |
0.3% |
| Capacity Utilization |
|
|
|
|
|
|
|
|
|
|
|
| Prior: |
79.7% |
78.8% |
78.3% |
78.0% |
79.8% |
79.7% |
79.6% |
78.9% |
79.3% |
79.7% |
79.7% |
78.9% |
| Prior Revised: |
79.4% |
78.4% |
78.0% |
79.6% |
79.4% |
79.8% |
79.4% |
78.6% |
79.5% |
79.5% |
79.5% |
78.7% |
| Consensus: |
79.5% |
79.1% |
78.5% |
78.8% |
79.8% |
79.7% |
79.5% |
79.1% |
79.3% |
79.6% |
79.4% |
79.1% |
| Capa.Utilization: |
78.8% |
78.3% |
78.0% |
79.8% |
79.7% |
79.6% |
78.9% |
79.3% |
79.7% |
79.7% |
78.9% |
78.8% |
|
|
|
|
|
|
|
|
|
|
|
|
|
| Month For: |
Dec-22 |
Jan-23 |
Feb-23 |
Mar-23 |
Apr-23 |
May-23 |
Jun-23 |
Jul-23 |
Aug-23 |
Sep-23 |
Oct-23 |
Nov-23 |
|
|
|
|
|
|
|
|
|
|
|
|
|
|
|
| |
|
| |
|
|
|
|
|
|
|
|
|
|
|
Release Schedule | 2022 |
|
|
Industrial Production | Manufacturing |
|
Today's Week |
|
|
|
|
|
|
|
|
|
|
|
|
|
Industrial Production (At 9:15 a.m ET)
| SCHEDULE 2022 |
No 1 |
No 2 |
No 3 |
No 4 |
No 5 |
No 6 |
No 7 |
No 8 |
No 9 |
No 10 |
No 11 |
No 12 |
| Release | Week |
|
|
|
|
|
|
|
|
|
|
|
|
| Release | Date |
|
|
|
|
|
|
|
|
|
|
|
|
| Release | Day |
|
|
|
|
|
|
|
|
|
|
|
|
|
|
|
|
|
|
|
|
|
|
|
|
|
| Prior |
0.5% |
-0.1% |
1.4% |
0.5% |
0.9% |
1.1% |
0.2% |
-0.2% |
0.6% |
-0.2% |
0.4% |
-0.1% |
| Prior Revised |
0.7% |
... |
... |
... |
... |
1.4% |
0.0% |
0.0% |
0.5% |
-0.1% |
0.1% |
... |
| CONSENSUS |
0.3% |
0.4% |
0.5% |
0.4% |
0.4% |
0.4% |
0.1% |
0.3% |
0.2% |
0.1% |
0.2% |
0.1% |
| Consensus Low |
-0.2% |
-0.1% |
0.2% |
0.0% |
0.2% |
0.2% |
-0.2% |
-0.2% |
-0.2% |
-0.4% |
-0.3% |
-0.2% |
| Consensus High |
0.5% |
1.0% |
0.8% |
0.7% |
0.7% |
0.8% |
0.4% |
0.8% |
0.4% |
0.4% |
0.5% |
0.4% |
| INDUSTRIAL PROD |
-0.1% |
1.4% |
0.5% |
0.9% |
1.1% |
0.2% |
-0.2% |
0.6% |
-0.2% |
0.4% |
-0.1% |
-0.2% |
| RATING |
|
|
|
|
|
|
|
|
|
|
|
|
|
|
|
|
|
|
|
|
|
|
|
|
|
| Consensus: |
... |
0.3% |
0.5% |
0.6% |
0.3% |
0.4% |
0.2% |
0.2% |
0.0% |
0.2% |
0.2% |
-0.1% |
| Mfg Output : |
-0.3% |
0.2% |
1.2% |
0.9% |
0.8% |
-0.1% |
-0.5% |
0.7% |
0.1% |
0.4% |
0.1% |
-0.6% |
|
|
|
|
|
|
|
|
|
|
|
|
|
| Consensus: |
... |
76.7% |
77.3% |
77.8% |
78.6% |
79.2% |
80.4% |
80.1% |
80.3% |
80.0% |
80.4% |
79.8% |
| Capa.Utilization: |
76.5% |
77.6% |
77.6% |
78.3% |
79.0% |
79.0% |
80.0% |
80.3% |
80.0% |
80.3% |
89.9% |
79.7% |
|
|
|
|
|
|
|
|
|
|
|
|
|
| Month For: |
Dec-21 |
Jan-22 |
Feb-22 |
Mar-22 |
Apr-22 |
May-22 |
Jun-22 |
Jul-22 |
Aug-22 |
Sep-22 |
Oct-22 |
Nov-22 |
|
|
|
|
|
|
|
|
|
|
|
|
|
|
|
| |
|
| |
|
|
|
|
|
|
|
|
|
|
|
Release Schedule | 2021 |
|
|
Industrial Production | Manufacturing |
|
Today's Week |
|
|
|
|
|
|
|
|
|
|
|
|
|
Industrial Production (At 9:15 a.m ET)
| SCHEDULE 2021 |
No 1 |
No 2 |
No 3 |
No 4 |
No 5 |
No 6 |
No 7 |
No 8 |
No 9 |
No 10 |
No 11 |
No 12 |
| Release | Week |
|
|
|
|
|
|
|
|
|
|
|
|
| Release | Date |
|
|
|
|
|
|
|
|
|
|
|
|
| Release | Day |
|
|
|
|
|
|
|
|
|
|
|
|
|
|
|
|
|
|
|
|
|
|
|
|
|
| Prior |
1.6% |
1.6% |
0.9% |
-2.2% |
1.4% |
0.7% |
0.8% |
0.4% |
0.9% |
0.4% |
-1.3% |
1.6% |
| Prior Revised |
... |
1.3% |
1.1% |
-2.6% |
2.4% |
0.1% |
0.7% |
0.2% |
0.8% |
-0.1% |
... |
1.7% |
| CONSENSUS |
0.5% |
0.5% |
0.5% |
2.8% |
0.8% |
0.6% |
0.6% |
0.4% |
0.4% |
0.2% |
0.9% |
0.7% |
| Consensus Low |
0.1% |
0.3% |
-0.4% |
0.6% |
0.4% |
0.2% |
0.2% |
0.1% |
0.1% |
-0.4% |
0.3% |
0.4% |
| Consensus High |
0.7% |
0.7% |
1.6% |
3.5% |
1.5% |
0.9% |
0.9% |
0.9% |
0.9% |
0.6% |
1.5% |
0.8% |
| INDUSTRIAL PROD |
1.6% |
0.9% |
-2.2% |
1.4% |
0.7% |
0.8% |
0.4% |
0.9% |
0.4% |
-1.3% |
1.6% |
0.5% |
| RATING |
|
|
|
|
|
|
|
|
|
|
|
|
|
|
|
|
|
|
|
|
|
|
|
|
|
| Mfg Output : |
0.9% |
1.0% |
-3.1% |
2.7% |
0.4% |
0.9% |
-0.1% |
1.4% |
0.2% |
-0.7% |
1.2% |
0.7% |
|
|
|
|
|
|
|
|
|
|
|
|
|
| Capa.Uti.Rate: |
74.5% |
75.6% |
73.8% |
74.4% |
74.9% |
75.2% |
75.4% |
76.1% |
76.4% |
75.2% |
76.4% |
76.8% |
|
|
|
|
|
|
|
|
|
|
|
|
|
| Month For: |
Dec-20 |
Jan-21 |
Feb-21 |
Mar-21 |
Apr-21 |
May-21 |
Jun-21 |
Jul-21 |
Aug-21 |
Sep-21 |
Oct-21 |
Nov-21 |
|
|
|
|
|
|
|
|
|
|
|
|
|
|
|
| |
|
| |
|
Legends: |
 |
Delayed |
 |
Positive View |
 |
Negative View |
 |
Neutral View |
 |
Non Available |
|
|
|
|
|
|
|
|
|
|
|
|
|
|
|
|
|
|
|
|
| |
|
|
|
|
|
|
|
|
|
|
|
|
|
|
|
|
|
|
|
|
|
Brief News | 2026 |
|
|
Industrial Production | Manufacturing |
|
Today's Week |
|
|
|
|
|
|
|
|
|
|
|
|
|
Industrial Production (At 9:15 a.m ET)
| DATE/WEEK |
HIGHLIGHTS |
FOR |
ACTUAL |
|
Industrial Production |
No 12 |
... |
|
Nov-2025 |
|
| |
|
|
|
Industrial Production |
No 11 |
... |
|
Oct-2025 |
|
| |
|
|
|
Industrial Production |
No 10 |
... |
|
Sep-2025 |
|
| |
|
|
|
Industrial Production |
No 9 |
... |
|
Aug-2025 |
|
| |
|
|
|
Industrial Production |
No 8 |
... |
|
Jul-2025 |
|
| |
|
|
|
Industrial Production |
No 7 |
... |
|
Jun-2025 |
|
| |
|
|
|
Industrial Production |
No 6 |
... |
|
May-2025 |
|
| |
|
|
|
Industrial Production |
No 5 |
... |
|
Apr-2025 |
|
| |
|
|
|
Industrial Production |
No 4 |
... |
|
Mar-2025 |
|
| |
|
|
|
Industrial Production |
No 3 |
... |
|
Feb-2025 |
|
| |
|
|
|
Industrial Production |
No 2 |
... |
|
Jan-2025 |
|
| |
|
|
|
Industrial Production |
No 1 |
... |
|
Dec-2024 |
|
| |
|
|
|
|
|
|
|
|
| |
|
|
|
|
|
| |
|
|
|
|
|
|
|
|
|
|
|
|
|
|
|
Brief News | 2025 |
|
|
Industrial Production | Manufacturing |
|
Today's Week |
|
|
|
|
|
|
|
|
|
|
|
|
|
Industrial Production (At 9:15 a.m ET)
| DATE/WEEK |
HIGHLIGHTS |
FOR |
ACTUAL |
|
Industrial Production |
No 12 |
0.2% |
|
Nov-2025 |
|
| |
|
|
|
Industrial Production |
No 12 |
0.1% |
|
Sep-2025 |
|
| |
|
|
|
Industrial Production for Oct-2025: Delayed due to the government shut down, |
No 11 |
... |
|
Oct-2025 |
|
| |
|
|
|
Industrial Production for Sep-2025: Delayed due to the government shut down, |
No 10 |
... |
|
Sep-2025 |
|
| |
|
|
|
U.S. factory production unexpectedly increased in August 2025 st 0.1% amid a rebound in the output of motor vehicles and some nondurable goods, though tariffs continued to cast a shadow over the manufacturing sector. Manufacturing output rose 0.2% last month after a downwardly revised 0.1% fall in July, the Federal Reserve said on Tuesday. Economists polled by Reuters had forecast production for the sector, which accounts for 10.2% of the economy, would slip 0.2% following a previously reported unchanged reading in July. |
No 9 |
0.1% |
|
Aug-2025 |
|
| |
|
|
|
In July 2025, US industrial production edged down 0.1%, driven by declines in mining and utilities, which offset unchanged manufacturing output. This 0.1% decrease missed market expectations for a flat reading and followed a stronger, upwardly revised 0.4% rise in June. Total capacity utilization fell to 77.5% in July, a rate significantly below its long-run average. |
No 8 |
-0.1% |
|
Jul-2025 |
|
| |
|
|
|
June industrial production (IP) rose a better-than-expected 0.3%, beating the market consensus of 0.1%. May industrial production was revised higher to unchanged from the previously reported drop of 0.2%. US Industrial Production expands 0.3% in June vs. 0.1% expected. Industrial Production in the United States (US) expanded by 0.3% on a monthly basis in June, the data published by the Federal Reserve showed on Wednesday. This reading followed the 0.2% contraction recorded in May and came in better than the market expectation for an expansion of 0.1%. Other details of the report showed that manufacturing output rose by 0.1% in this period. Meanwhile, the Capacity Utilization improved to 77.6% from 77.4% in May. |
No 7 |
0.3% |
|
Jun-2025 |
|
| |
|
|
|
Overall industrial production fell 0.2% after gaining 0.1% in April. It rose 0.6% on a year-over-year basis in May. Capacity utilization for the industrial sector, a measure of how fully firms are using their resources, fell to 77.4% from 77.7% in April. It is 2.2 percentage points below its 1972–2024 average. The operating rate for the manufacturing sector was unchanged at 76.7%. It is 1.5 percentage points below its long-run average. |
No 6 |
-0.2% |
|
May-2025 |
|
| |
|
|
|
Overall industrial production was unchanged after easing 0.3% in March. It increased 1.5% on a year-over-year basis in April. Capacity utilization for the industrial sector, a measure of how fully firms are using their resources, dipped to 77.7% from 77.8% in March. It is 1.9 percentage points below its 1972–2024 average. The operating rate for the manufacturing sector dropped four-tenths of a percentage point to 76.8%. It is 1.4 percentage points below its long-run average. |
No 5 |
0.0% |
|
Apr-2025 |
|
| |
|
|
|
Industrial production fell 0.3% after increasing 0.8% in February. It increased 1.3% year-on-year in March and expanded at a 5.5% at a rate in the first quarter. Capacity utilization for the industrial sector, a measure of how fully firms are using their resources, dipped to 77.8% from 78.2% in February. It is 1.8 percentage points below its 1972–2024 average. The operating rate for the manufacturing sector rose 0.2 percentage point to 77.3%. It is 0.9 percentage points below its long-run average. |
No 4 |
-0.3% |
|
Mar-2025 |
|
| |
|
|
|
Industrial production increased 0.7% after climbing 0.3% in January. It surged 1.4% year-on-year in February. Capacity utilization for the industrial sector, a measure of how fully firms are using their resources, increased to 78.2% from 77.7% in January. It is 1.4 percentage points below its 1972–2024 average. The operating rate for the manufacturing sector rose 0.6 percentage point to 77.0%. It is 1.2 percentage points below its long-run average. |
No 3 |
0.7% |
|
Feb-2025 |
|
| |
|
|
|
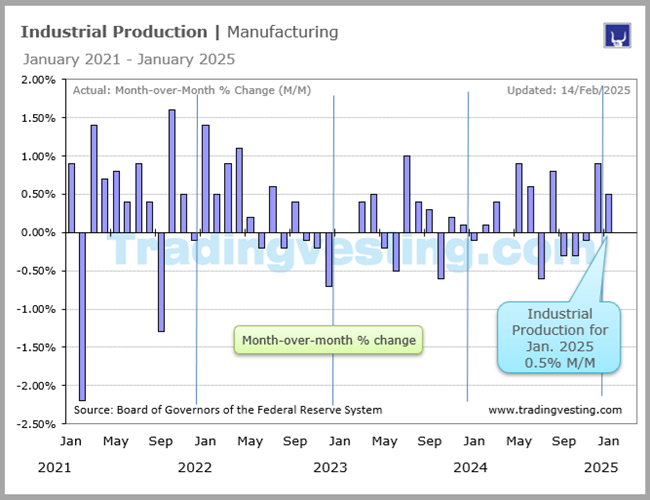
Industrial production rose 0.5% last month after surging 1.0% in December. It advanced 2.0% year-on-year in January. Capacity utilization for the industrial sector, a measure of how fully firms are using their resources, rose to 77.8% from 77.5% in December. It is 1.8 percentage points below its 1972–2024 average. The operating rate for the manufacturing sector slipped 0.1 percentage to 76.3%. It is 1.9 percentage points below its long-run average. |
No 2 |
0.5% |
|
Jan-2025 |
|
| |
|
|
|
Industrial production accelerated 0.9% last month, with aircraft and parts output contributing 0.2 percentage point, after rising 0.2% in November. It increased 0.5% year-on-year in December and contracted at a 0.8% rate in the fourth quarter after shrinking at a 0.6% pace in the July-September quarter. Capacity utilization for the industrial sector, a measure of how fully firms are using their resources, rose to 77.6% from 77.0% in November. It is 2.1 percentage points below its 1972–2023 average. The operating rate for the manufacturing sector picked up 0.4 percentage point in December to 76.6. It is 1.7 percentage points below its long-run average. |
No 1 |
0.9% |
|
Dec-2024 |
|
| |
|
|
|
|
|
|
|
|
| |
|
|
|
|
|
| |
|
|
|
|
|
|
|
|
|
|
|
|
|
|
|
Brief News | 2024 |
|
|
Industrial Production | Manufacturing |
|
Today's Week |
|
|
|
|
|
|
|
|
|
|
|
|
|
Industrial Production (At 9:15 a.m ET)
| DATE/WEEK |
HIGHLIGHTS |
FOR |
ACTUAL |
|
US Industrial Production Unexpectedly Drops on Mining, Utilities. Manufacturing output rose a disappointing 0.2% in November. Aerospace equipment production fell despite strike resolution. US industrial production unexpectedly declined for a third month in November on weaker utility output and mining. The 0.1% decrease in production at factories, mines and utilities followed a downwardly revised 0.4% drop a month earlier, Federal Reserve data showed Tuesday. The median estimate of Bloomberg survey of economists was for a 0.3% increase. US industrial production continued to contract last month, the Federal Reserve said Tuesday, announcing a surprise slump and extending the decline for a third consecutive month. Industrial output fell by 0.1 percent in November after declining in both September and October, the Fed said in a statement. |
No 12 |
-0.1% |
|
Nov-2024 |
|
| |
|
|
|
US industrial production sags in October amid continued drag from Boeing strike, hurricanes. U.S. industrial production fell for a second straight month in October, continuing to be depressed by hurricanes and a strike by factory workers at Boeing (BA.N), opens new tab, but a rebound is likely in November as the drag from these factors lifts. Industrial output dropped 0.3% last month after a downwardly revised 0.5% decline in September, the Federal Reserve said on Friday. Economists polled by Reuters had forecast industrial production falling 0.3% after a previously reported 0.3% decrease in September. |
No 11 |
-0.3% |
|
Oct-2024 |
|
| |
|
|
|
Industrial production decreased in September, reversing output growth in August. Last month, U.S. industrial output declined by 0.3%, according to statistics published by the Federal Reserve Thursday. Economists surveyed by The Wall Street Journal had expected production to fall by 0.2%. August's industrial-production growth also was revised lower, to 0.3% growth, from a previous estimate of 0.8% growth. The Fed now estimates that industrial production has declined by 0.6% overall during the past 12 months. |
No 10 |
|
|
Sep-2024 |
|
| |
|
|
|
US manufacturing output rebounds in August. Production at U.S. factories surged in August amid a rebound in motor vehicle output, but data for the prior month was revised lower, suggesting that manufacturing continued to tread water. Factory output, manufacturing output increased 0.9% last month after a downwardly revised 0.7% drop in July, the Federal Reserve said on Tuesday. Economists polled by Reuters had forecast factory output would rise 0.3% after a previously reported 0.3% decline in July. Industrial production gets short-lived boost from cars, but U.S. manufacturers still depressed. Major part of the economy remains in a slump. Industrial production posted a bigger-than-expected increase in August, but most of the gain was tied to automobiles and there was little sign of a rebound in a depressed U.S. manufacturing sector. Output climbed 0.8% last month. Economists polled by the Wall Street Journal had forecast a 0.2% increase in production. |
No 9 |
0.8% |
|
Aug-2024 |
|
| |
|
|
|
US Industrial Production Contracts Sharply in July. The Fed said industrial production had been held down by the early "July shutdowns concentrated in the petrochemical and related industries due to Hurricane Beryl," which came ashore in Texas. U.S. industrial production fell sharply in July, the Federal Reserve said Thursday, pointing to a larger-than-expected impact from Hurricane Beryl. The news is likely to add to calls for the Fed to cut its key lending rate from a two-decade high next month as its long-running campaign against inflation continues to percolate through to the broader economy. Total industrial output from a month earlier when it rose by a revised figure of 0.3%, the U.S. central bank said in a statement. This was sharply below market expectations of a 0.1% increase, according to Briefing.com. The Fed said industrial production had been held down by the early "July shutdowns concentrated in the petrochemical and related industries due to Hurricane Beryl," which came ashore in Texas. |
No 8 |
-0.6% |
|
Jul-2024 |
|
| |
|
|
|
US manufacturing output beats expectations with 0.4% rise in June. Production at U.S. factories increased 0.6%, more than expected in June, contributing to a solid rebound in output in the second quarter, though higher borrowing costs remain a constraint for the manufacturing industry. Factory output rose 0.4% last month following an upwardly revised 1.0% increase in May, the Federal Reserve said on Wednesday. Economists polled by Reuters had forecast factory output would advance 0.2% after a previously reported 0.9% jump in May. Production at factories shot up 1.1% on a year-on-year basis in June. It increased at a 3.4% annualized rate in the second quarter, rebounding from the 1.3% pace of decline in the January-March quarter. Manufacturing, which accounts for 10.4% of the economy, has at best been treading water as higher interest rates curb demand for goods and make capital investment challenging. There is, however, optimism that activity at factories could pick up, with the U.S. central bank expected to start its monetary policy easing cycle in September amid subsiding inflation. |
No 7 |
0.6% |
|
Jun-2024 |
|
| |
|
|
|
US manufacturing production surges in May. Production at U.S. factories increased more than expected in May, recouping all the declines in the prior two months, but the momentum is unlikely to be sustained amid higher interest rates and softening demand for goods. Manufacturing output jumped 0.9% last month following a downwardly revised 0.4% drop in April, the Federal Reserve said on Tuesday. Economists polled by Reuters had forecast factory output rebounding 0.3% after a previously reported 0.3% fall in April. Production at factories had declined in March and April. It gained 0.1% year-on-year in May. Manufacturing, which accounts for 10.4% of the economy, has been hamstrung by higher borrowing costs.Overall industrial production accelerated 0.9% in May. That followed an unchanged reading in April. Industrial production rose 0.4% year-on-year in May. Capacity utilization for the industrial sector, a measure of how fully firms are using their resources, rose to 78.7% from 78.2% in April. It is 0.9 percentage points below its 1972–2023 average. The operating rate for the manufacturing sector increased to 77.1% from 76.6% in the prior month. It is 1.1 percentage points below its long-run average. |
No 6 |
0.9% |
|
May-2024 |
|
| |
|
|
|
US manufacturing output unexpectedly falls in April. Production at U.S. factories unexpectedly fell in April amid a decline in motor vehicle output, data showed on Thursday. Manufacturing output dropped 0.3% last month following a downwardly revised 0.2% increase in March, the Federal Reserve said. Economists polled by Reuters had forecast factory output rising 0.1% after a previously reported 0.5% advance in March. Production at factories fell 0.5% year-on-year in April. Manufacturing, which accounts for 10.4% of the economy, remains constrained by higher borrowing costs. Overall industrial production was unchanged in April. That followed a 0.1% gain in March. Industrial production fell 0.4% year-on-year in April. Capacity utilization for the industrial sector, a measure of how fully firms are using their resources, fell to 78.4% from 78.5% in March. It is 1.2 percentage points below its 1972-2023 average. The operating rate for the manufacturing sector slipped 0.3 percentage point in to 76.9% in April. It is 1.3 percentage points below its long-run average. |
No 5 |
0.0% |
|
Apr-2024 |
|
| |
|
|
|
Production at U.S. factories increased solidly in March as output at motor vehicle assembly plants and elsewhere rose, suggesting that manufacturing was turning the corner after being constrained by higher borrowing costs. US manufacturing output increases in March; February data revised higher. Manufacturing output rose 0.5% last month after an upwardly revised 1.2% rebound in the prior month, the Federal Reserve said on Tuesday. Factory output was previously reported to have rebounded 0.8% in February. Economists polled by Reuters had forecast factory output rising 0.3%. Production at factories increased 0.8% year-on-year in March. It edged down at a 0.1% annualized rate in the first quarter after contracting at a 0.9% pace in the October-December quarter. Manufacturing accounts for 10.4% of the economy. A survey from the Institute for Supply Management early this month showed manufacturing grew for the first time in 1-1/2 years in March. |
No 4 |
0.4% |
|
Mar-2024 |
|
| |
|
|
|
US factory production rebounds from weather-induced slump. Production at U.S. factories increased more than expected in February amid a rise in temperatures, but data for the prior month was revised sharply down as manufacturing remains hamstrung by high interest rates. Manufacturing, which accounts for 10.3% of the economy, has been squeezed by 525 basis points worth of interest rate hikes from the Federal Reserve since March 2022. The U.S. central bank is expected to leave rates unchanged at the end of a two-day policy meeting next Wednesday. Overall industrial production gained 0.1% in February after falling 0.5% in January. Industrial production fell 0.2% on a year-on-year basis in February. Capacity utilization for the industrial sector, a measure of how fully firms are using their resources, was unchanged at 78.3%. It is 1.3 percentage points below its 1972-2023 average. Financial markets anticipate rate cuts will start in June.The manufacturing sector continues to face headwinds from higher borrowing costs and tighter credit conditions. However, lower interest rates as the Fed starts cutting the target range this year, as well as an onshoring of supply networks may provide support to factory activity in 2024. Manufacturing output rebounded 0.8% last month after a downwardly revised 1.1% drop in the prior month, the Fed said. Factory output was previously reported to have dropped 0.5% in January, weighed down by frigid temperatures. Economists polled by Reuters had forecast factory output would rise 0.3%. Production at factories fell 0.7% on a year-on-year basis in February. Despite the overall weakness, there remain pockets of manufacturing strength. |
No 3 |
0.1% |
|
Feb-2024 |
|
| |
|
|
|
January industrial production slipped. The weakness in January is a break from the strong gains in the previous two months. Industrial production fell 0.1% in January, falling short of expectations for a 0.2% increase. December was revised lower to no change from 0.1% previously reported. Manufacturing output, which accounts for 75% of overall industrial activity, declined 0.5%, the largest drop in three months. The production of motor vehicles and parts decreased 0.2% in January. Several of the Detroit automakers recently announced a scaling back of electric vehicle (EV) production as sales are falling short of robust growth targets. |
No 2 |
-0.1% |
|
Jan-2024 |
|
| |
|
|
|
Production at U.S. factories barely rose in December as increases in motor vehicle output were partially blunted by declines in machinery as well as electrical equipment, appliances and components. Manufacturing output edged up 0.1% last month, the Federal Reserve said on Wednesday. Data for November was revised lower to show production at factories rising 0.2% instead of 0.3% as previously reported. Economists polled by Reuters had forecast factory output would be unchanged. Manufacturing, which accounts for 10.3% of the economy, continues to be hobbled by 525 basis points worth of interest rate hikes from the U.S. central bank since March 2022. Overall industrial production gained 0.1% in December after being unchanged in November. Industrial production decreased at a 3.1% rate in the fourth quarter after increasing at a 1.8% pace in the July-September quarter. Capacity utilization for the industrial sector, a measure of how fully firms are using their resources, was unchanged at 78.6% in December. The operating rate for the manufacturing sector was also unchanged at 77.1%. |
No 1 |
0.1% |
|
Dec-2023 |
|
| |
|
|
|
|
|
|
|
|
| |
|
|
|
|
|
| |
|
|
|
|
|
|
|
|
|
|
|
|
|
|
|
Brief News | 2023 |
|
|
Industrial Production | Manufacturing |
|
Today's Week |
|
|
|
|
|
|
|
|
|
|
|
|
|
Industrial Production (At 9:15 a.m ET)
| DATE/WEEK |
HIGHLIGHTS |
FOR |
ACTUAL |
|
Manufacturing production rises 0.3% in November. Production at U.S. factories rose in November, lifted by a rebound in motor vehicle output following the end of strikes, but activity was weaker elsewhere as manufacturing grapples with higher borrowing costs and softening demand. Despite the manufacturing sector's mixed fortunes, the economy continued to expand as the year ended. A survey on Friday showed business activity picked up in December amid rising orders and demand for workers in the services industry. Manufacturing output rose 0.3% in November, the Federal Reserve said. Data for October was revised lower to show production at factories falling 0.8% instead of by the previously reported 0.7%. Economists polled by Reuters had forecast factory output would rebound 0.4%. |
No 12 |
0.3% |
|
Nov-2023 |
|
| |
|
|
|
Production at U.S. factories dropped more than expected in October as strikes by the United Auto Workers (UAW) union against Detroit's "Big Three" automakers depressed motor vehicle production, but manufacturing elsewhere continued to hold up. Manufacturing output fell 0.7% last month, the Federal Reserve said on Thursday. Data for September was revised lower to show production at factories rising 0.2% instead of the previously reported 0.4%. Economists polled by Reuters had forecast factory output dropping 0.3%. Production at factories declined 1.7% on a year-on-year basis in October. Capacity utilization for the industrial sector, a measure of how fully firms are using their resources, fell six-tenths of a percentage point to 78.9% in October. It is now eight-tenths of a percentage point below to its 1972–2022 average. |
No 11 |
-0.1% |
|
Oct-2023 |
|
| |
|
|
|
Production at U.S. factories increased more than expected in September despite strikes in the automobile industry curbing motor vehicle output, further evidence that the economy exited the third quarter with momentum. Manufacturing output rose 0.4% last month, the Federal Reserve said on Tuesday. Data for August was revised lower to show production at factories dipping 0.1% instead of nudging up 0.1% as previously reported. Economists polled by Reuters had forecast factory output would tick up 0.1%. Production dropped 0.8% on a year-on-year basis in September. It was unchanged in the third quarter. Durable goods manufacturing output rose at a 2.3% annualized rate, which was offset by a 2.4% pace of decline in nondurable manufacturing. Manufacturing accounts for 11.1% of the economy. But the worst for the sector is likely over, with the Institute for Supply Management's measure of national factory activity rising to a 10-month high in September. Industrial output increased at a 2.5% rate in the third quarter. That followed a 0.7% growth pace in the second quarter. Capacity utilization for the industrial sector, a measure of how fully firms are using their resources, rose 0.2 percentage point to 79.7% in September. It is now equal to its 1972–2022 average. The operating rate for the manufacturing sector nudged up to 77.8% from 77.7% in the prior month and is 0.4 percentage point below its long-run average. |
No 10 |
|
|
Sep-2023 |
|
| |
|
|
|
Production at U.S. factories barely rose in August as motor vehicle output dropped and activity could plunge in the months ahead after the United Auto Workers (UAW) union embarked on strikes at three factories on Friday. Manufacturing output edged up 0.1% last month, the Federal Reserve said on Friday. Data for July was revised slightly lower to show production at factories rebounding 0.4% instead of 0.5% as previously reported. Economists polled by Reuters had forecast factory output gaining 0.1%. Production was down 0.6% on a year-on-year basis in August. Manufacturing, which accounts for 11.1% of the economy, was already hobbled by slowing demand for goods because of higher interest rates. Since March 2022, the Federal Reserve has raised its benchmark overnight interest rate by 525 basis points to the current 5.25%-5.50% range. |
No 9 |
0.6% |
|
Aug-2023 |
|
| |
|
|
|
Production at U.S. factories unexpectedly rebounded in July as motor vehicle output surged, but activity continues to be hamstrung by higher borrowing costs. Manufacturing output increased 0.5% last month, the Federal Reserve said on Wednesday. Data for June was revised lower to show production at factories falling 0.5% instead of 0.3% as previously reported. Economists polled by Reuters had forecast factory output would be unchanged. Production dropped 0.7% on a year-on-year basis in July. Since March 2022, the Federal Reserve has raised its benchmark overnight interest rate by 525 basis points to the current 5.25%-5.50% range. That has pressured manufacturing, which accounts for 11.1% of the economy. Overall industrial production shot up 1.0% in July after dropping 0.8% in June. Capacity utilization for the industrial sector, a measure of how fully firms are using their resources, increased to 79.3% in July from 78.6% in June. It is 0.4 percentage point below its 1972–2022 average. The operating rate for the manufacturing sector rose to 77.8% last month from 77.5% in June and is 0.4 percentage point below its long-run average. |
No 8 |
0.7% |
|
Jul-2023 |
|
| |
|
|
|
Production at U.S. factories unexpectedly fell in June, but rebounded in the second quarter as motor vehicle output accelerated after two straight quarterly declines. Manufacturing output dropped 0.3% last month, the Federal Reserve said on Tuesday. Data for May was revised down to show production at factories falling 0.2% instead of edging up 0.1% as previously reported. Economists polled by Reuters had forecast factory output would be unchanged. Production decreased 0.3% on a year-on-year basis in June. It rebounded at a 1.5% annualized rate in the second quarter after shrinking at a 0.2% pace in the January-March period. Factory output, which had also contracted in the fourth quarter, was boosted by a 36.7% surge in the production of motor vehicles and parts in the second quarter. Manufacturing, which accounts for 11.1% of the economy, has been hamstrung by 500 basis points worth of interest rate increases from the Fed since March 2022, when the U.S. central bank embarked on its fastest monetary policy tightening campaign in more than 40 years. Spending is also shifting to services and away from goods, which are typically bought on credit. Capacity utilization for the industrial sector, a measure of how fully firms are using their resources, fell to 78.9% from 79.4% in May. It is 0.8 percentage point below its 1972–2022 average. The operating rate for the manufacturing sector slipped to 78.0% from 78.3% in May and is 0.2 percentage point below its long-run average. |
No 7 |
0.2% |
|
Jun-2023 |
|
| |
|
|
|
Production at U.S. factories almost stalled in May as manufacturing struggled under the weight of higher interest rates, data showed on Thursday. Manufacturing output edged up 0.1% last month, the Federal Reserve said. Data for April was revised slightly lower show production at factories surging 0.9% instead of 1.0% as previously reported. Last month's gain in factory production was in line with economists' expectations. Output fell 0.3% on a year-on-year basis in May. Motor vehicle production rose 0.2% last month after accelerating 9.8% in April. Durable manufacturing output increased 0.3%, while production of nondurable goods slipped 0.1%. Capacity utilization for the industrial sector, a measure of how fully firms are using their resources, fell to 79.6% from 79.8% in April. It is 0.1 percentage point below its 1972–2022 average. Capacity use for the manufacturing sector was unchanged at 78.4% and is 0.2 percentage point above its long-run average. |
No 6 |
0.3% |
|
May-2023 |
|
| |
|
|
|
Other economic news Tuesday saw a 0.5% increase in industrial production for April, better than the 0.1% estimate, according to the Federal Reserve. Capacity utilization was at 79.7%, just below the estimate. Industrial production rose 0.5 percent in April after moving sideways the previous two months. In April, manufacturing increased 1.0 percent, bolstered by a strong gain in the output of motor vehicles and parts; factory output excluding motor vehicles and parts moved up 0.4 percent. The index for mining rose 0.6 percent, while the index for utilities dropped 3.1 percent, as milder temperatures in April lowered demand for heating. At 103.0 percent of its 2017 average, total industrial production in April was 0.2 percent above its year-earlier level. Capacity utilization edged up to 79.7 percent in April, a rate that is equal to its long-run (1972–2022) average |
No 5 |
0.4% |
|
Apr-2023 |
|
| |
|
|
|
US manufacturing output falls in March; rebounds in first quarter. Production at U.S. factories fell more than expected in March, but eked out a modest gain in the first quarter. Manufacturing output dropped 0.5 percent last month, the Federal Reserve said on Friday. Data for February was revised higher to show production at factories increasing 0.6 percent instead of edging up 0.1 percent as previously reported. Economists polled by Reuters had forecast production would dip 0.1 percent. Output decreased 1.1 percent on a year-on-year basis in March. Manufacturing output rose at a 0.3- percent annualized rate in the first quarter after declining at a 3.1- percent pace in the October-December period. The modest growth in production last quarter is at odds with surveys that have suggested that manufacturing was in deep recession. |
No 4 |
-1.0% |
|
Mar-2023 |
|
| |
|
|
|
While other data on Friday showed production at factories edged up in February and output in the prior month was stronger than previously thought, manufacturing continued to struggle under the weight of higher borrowing costs.Manufacturing output gained 0.1% last month, the Fed said. Data for January was revised up to show production at factories increasing 1.3% instead of the previously reported 1.0% rise. Output fell 1.0% on a year-on-year basis in February and was on track to contract for a third straight quarter.Manufacturing, which accounts for 11.3% of the U.S. economy, contracted in the third and fourth quarters of 2022 as higher rates undercut demand for goods, which are typically bought on credit. Spending is also shifting away from goods to services, while the dollar's past appreciation and sluggish global growth are curbing exports. Restocking by businesses is also slowing. Capacity utilization for the manufacturing sector, a measure of how fully firms are using their resources, dipped 0.1 percentage point to 77.6% in February. It is 0.6 percentage point below its long-run average. Overall capacity use for the industrial sector was unchanged at 78.0%. It is 1.6 percentage points below its 1972-2022 average.
|
No 3 |
-0.4% |
|
Feb-2023 |
|
| |
|
|
|
U.S. industrial production stagnated in January weighed by lower utilities output, but the key manufacturing sector rebounded from the falls recorded at year-end. Industrial production--which comprises manufacturing, mining and utility output--was unchanged in January after a revised 1% drop in December, data from the Federal Reserve showed Wednesday. The reading misses the 0.4% expansion expected by economists in a poll from The Wall Street Journal. The U.S. manufacturing sector lost momentum at the end of 2022 as high interest rates hit new demand for goods both domestically and globally. Economists don't expect the situation to improve significantly in the short-term as the drag from higher borrowing costs intensifies. Capacity utilization, which reflects how much industries are producing compared with what they could potentially produce, decreased marginally to 78.3% in January from 78.4% the prior month. |
No 2 |
3.0% |
|
Jan-2023 |
|
| |
|
|
|
U.S. manufacturing output tumbles in December. Production at U.S. factories fell more than expected in December and output in the prior month was weaker than previously thought, indicating that manufacturing was rapidly losing momentum as higher borrowing costs hurt demand for goods. Manufacturing output dropped 1.3% last month, the Federal Reserve said on Wednesday. Data for November was revised lower to show production at factories decreasing 1.1% instead of the previously reported 0.6%. Economists polled by Reuters had forecast factory production would decline 0.3%. Output fell 0.5% on a year-on-year basis in December. It decreased at a 2.5% annualized rate in the fourth quarter. Higher interest rates are undercutting demand for goods, which are mostly bought on credit. The dollar's past appreciation and a softening in global demand are also hurting manufacturing, which accounts for 11.3% of the U.S. economy. In addition, spending is also shifting back to services. |
No 1 |
-1.1% |
|
Dec-2022 |
|
| |
|
|
|
|
|
|
|
|
| |
|
|
|
|
|
| |
|
|
|
|
|
|
|
|
|
|
|
|
|
|
|
Brief News | 2022 |
|
|
Industrial Production | Manufacturing |
|
Today's Week |
|
|
|
|
|
|
|
|
|
|
|
|
|
Industrial Production (At 9:15 a.m ET)
| DATE/WEEK |
HIGHLIGHTS |
FOR |
ACTUAL |
|
Production at U.S. factories dropped more than expected in November as a decline in the output of motor vehicles offset gains elsewhere, according to data on Thursday, which showed manufacturing retaining some momentum. Manufacturing output fell 0.6% last month, the Federal Reserve said on Thursday. Data for October was revised higher to show production at factories gaining 0.3% instead of the previously reported 0.1%. Economists polled by Reuters had forecast factory production would dip 0.1% last month. Output increased 1.2% year-on-year in November. Manufacturing, which accounts for 11.3% of the economy, is being hampered by higher borrowing costs that are dampening demand and business fixed investment. Spending is also shifting back to services while businesses are sitting on excess inventory, leaving them hesitant to place more orders with factories. Capacity utilization for the manufacturing sector, a measure of how fully firms are using their resources, fell to 78.9% last month from 79.5% in October. It is 0.7 percentage point above its long-run average. Overall capacity use for the industrial sector fell 0.2 percentage point to 79.7%. It is 0.1 percentage point above its 1972-2021 average |
No 12 |
0.9% |
|
Nov-2022 |
|
| |
|
|
|
Production at U.S. factories barely rose in October and output in the prior two months was not as strong as initially thought, suggesting that manufacturing was rapidly losing momentum amid higher interest rates. Manufacturing output edged up 0.1% last month, the Federal Reserve said on Wednesday. Data for September was revised lower to show production at factories rising 0.2% instead of 0.4% as previously reported. Production in August increased only 0.1%, rather than 0.4% as previously estimated. Economists polled by Reuters had forecast factory production gaining 0.2% last month. Output increased 2.4% compared with October 2021. As a result, overall industrial production dipped 0.1% in October after edging up 0.1% in September. Capacity utilization for the manufacturing sector, a measure of how fully firms are using their resources, was unchanged at 79.5% last month. It is 1.3 percentage points above its long-run average. Overall capacity use for the industrial sector decreased 0.2 percentage point to 79.9% last month. It is 0.3 percentage point above its 1972-2021 average. |
No 11 |
1.1% |
|
Oct-2022 |
|
| |
|
|
|
Production at U.S. factories rose in September led by output gains in both durable and nondurable goods, indicating the manufacturing sector remains on reasonable footing despite the Federal Reserve's efforts to hamper demand through higher interest rates. Manufacturing output rose 0.4% last month, keeping pace with an upwardly revised 0.4% gain in August, the Federal Reserve said on Tuesday. Economists polled by Reuters had forecast factory production would rise 0.2%. Output increased 4.7% from a year earlier. Overall industrial production rose 0.4%, after slipping 0.1% the prior month. Economists polled by Reuters had estimated a 0.1% increase. Capacity utilization, a measure of how fully producers are using their resources, rose to 80.3% last month from an upwardly revised 80.1% in August. |
No 10 |
0.9% |
|
Sep-2022 |
|
| |
|
|
|
Production at U.S. factories edged up in August amid a decline at motor vehicle assembly plants, but gains in the output of machinery as well as computer and electronic products pointed to underlying strength in manufacturing. Manufacturing output gained 0.1% last month after increasing 0.6% in July, the Federal Reserve said on Thursday. Economists polled by Reuters had forecast factory production would be unchanged. Output increased 3.3% compared to August 2021. Manufacturing, which accounts for 11.9% of the U.S. economy, is slowing as spending shifts back to services from goods. Capacity utilization for the manufacturing sector, a measure of how fully firms are using their resources, was unchanged at 79.6% in August. It is 1.4 percentage points above its long-run average. Overall capacity use for the industrial sector fell 0.2 percentage point to 80.0% last month. It is 0.4 percentage point above its 1972-2021 average. |
No 9 |
0.5% |
|
Aug-2022 |
|
| |
|
|
|
Production at U.S. factories increased more than expected in July as output rose at motor vehicle plants and elsewhere, pointing to underlying strength in manufacturing despite ebbing business confidence. Manufacturing output rebounded 0.7% last month after declining 0.4% in June, the Federal Reserve said on Tuesday. Economists polled by Reuters had forecast factory production would rise 0.2%. Output increased 3.2% compared to July 2021. Manufacturing, which accounts for 11.9% of the U.S. economy, remains supported by strong demand for goods even as spending is gradually shifting back to services. But risks are rising, with retailers sitting on excess inventory, especially of apparel. Capacity utilization for the manufacturing sector, a measure of how fully firms are using their resources, increased half a percentage point to 79.8% in July. It is 1.6 percentage points above its long-run average. Overall capacity use for the industrial sector rose to 80.3% last month from 79.9% in June. It is 0.7 percentage point above its 1972-2021 average. |
No 8 |
1.4% |
|
Jul-2022 |
|
| |
|
|
|
Production at U.S. factories dropped for a second straight month in June as output of motor vehicles and a range of other goods declined, suggesting that higher interest rates were hurting the manufacturing sector. Manufacturing output fell 0.5% last month, matching the decline in May, the Federal Reserve said on Friday. Economists polled by Reuters had forecast factory production would slip 0.1%. Output increased 3.6% compared to June 2021. Industrial output was unchanged in May. It grew at a 6.1% rate in the April-June quarter after increasing at a 5.1% pace in the first quarter. Capacity utilization for the manufacturing sector, a measure of how fully firms are using their resources, fell 0.5 percentage point to 79.3% in June. It is 1.1 percentage points above its long-run average. Overall capacity use for the industrial sector slipped to 80.0% last month from 80.3% in May. It is 0.4 percentage point above its 1972-2021 average. |
No 7 |
-0.1% |
|
Jun-2021 |
|
| |
|
|
|
Industrial output increases 0.2%. Production at U.S. factories unexpectedly fell in May, the latest sign of cooling economic activity as the Federal Reserve aggressively tightens monetary policy to tame inflation. Slowing growth was indicated in other data showing a gauge of future economic activity declining in May for a third straight month. Other data this week showed a drop in retail sales last month as well as steep declines in homebuilding and permits. Weakness in manufacturing output also reflects a shift in spending from goods to services. Manufacturing output dipped 0.1% last month, the first decline since January, after increasing 0.8% in April, the Fed said. Economists polled by Reuters had forecast factory production gaining 0.3%. Output rose 4.8% compared to May 2021. |
No 6 |
0.9% |
|
May-2022 |
|
| |
|
|
|
A separate report showed that industrial production rose 1.1% in April 2022, well above the 0.5% estimate. Industrial production rose 1.1% in April 2022, well above the 0.5% Dow Jones estimate, according to Fed data. Capacity utilization, or the level of potential output being realized, increased to 79%, slightly ahead of the 78.6% estimate. |
No 5 |
1.1% |
|
Apr-2022 |
|
| |
|
|
|
U.S. Industrial Production Advances Much More Than Expected In March 2022. Partly reflecting a spike in the output of motor vehicles and parts, the Federal Reserve released a report on Friday showing U.S. industrial production increased by much more than expected in the month of March. The report showed industrial production advanced by 0.9 percent in March, matching the upwardly revised increase in February. Economists had expected industrial production to rise by 0.4 percent compared to the 0.5 percent growth originally reported for the previous month. Manufacturing output climbed by 0.9 percent in March after jumping 1.2 percent in February, largely reflecting a 7.8 percent surge in the output of motor vehicles and parts. Factory output elsewhere moved up 0.4 percent. |
No 4 |
0.9% |
|
Mar-2022 |
|
| |
|
|
|
US industrial production increased 0.5% in February 2022, in line with market estimates, the Federal Reserve said Thursday. While it followed a 1.4% gain in January, industrial output showed a 7.5% increase year-on-year. Manufacturing output and mining production rose 1.2% and 0.1%, respectively, but the index for utilities declined 2.7%, the Fed said in a statement. Manufacturing was expected to rise 0.6% in February after increasing 0.1% during the previous month. Capacity utilization for the industrial sector increased 0.3 percentage points to 77.6% in February from the revised figure of 77.3% in January. The market estimate was 77.8%. |
No 3 |
0.5% |
|
Feb-2022 |
|
| |
|
|
|
After reporting a modest decrease in U.S. industrial production in the previous month, the Federal Reserve released a report on Wednesday showing production rebounded by much more than anticipated in the month of January. The Fed said industrial production jumped by 1.4 percent in January 2022 after edging down by 0.1 percent in December. Economists had expected industrial production to rise by 0.4 percent. The much bigger than expected rebound in industrial production was led by a spike in utilities output, which skyrocketed by 9.9 percent in January after tumbling by 1.8 percent in December. The Fed also said capacity utilization for the industrial sector rose to 77.6 percent in January from an upwardly revised 76.6 percent in December. Economists had expected capacity utilization to inch up to 76.8 percent from the 76.5 percent originally reported for the previous month. |
No 2 |
1.4% |
|
Jan-2022 |
|
| |
|
|
|
Industrial output fell a disappointing 0.1% in December as auto production stumbled, compared to Wall Street expectations for a 0.2% gain. Capacity utilization — which reflects the limits to operating the nation’s factories, mines and utilities — inched lower to 76.5% in December from 76.6% in the prior month.Capacity utilization inched lower to 76.5% in December from 76.6% in the prior month. The capacity utilization rate reflects the limits to operating the nation’s factories, mines and utilities. Economists had forecast a 77% rate... |
No 1 |
-0.1% |
|
Dec-2021 |
|
| |
|
|
|
|
|
|
|
|
| |
|
|
|
|
|
| |
|
|
|
|
|
|
|
|
|
|
|
|
|
|
|
Brief News | 2021 |
|
|
Industrial Production | Manufacturing |
|
Today's Week |
|
|
|
|
|
|
|
|
|
|
|
|
|
Industrial Production (At 9:15 a.m ET)
| DATE/WEEK |
HIGHLIGHTS |
FOR |
ACTUAL |
|
Industrial Production Increases 0.5% in November 2021. US industrial production increased 0.5% in November as output at the nation’s factories reached the highest level since January 2019. U.S. industrial production increased 0.5% in November as output at the nation's factories reached the highest level since January 2019. The November gain followed an even larger 1.7% increase in October, a rebound from a 1% decline in September, the Federal Reserve reported Thursday. ndustrial production covers manufacturing, mining and utilities. Capacity utilization for the manufacturing sector, a measure of how fully firms are using their resources, increased 0.5 percentage point to 77.3% in November, its highest rate since December 2018. Overall capacity use for the industrial sector rose 0.3 percentage point to 76.8% last month. It is 2.8 percentage points below its 1972-2020 average. |
No 12 |
0.5% |
|
Nov-2021 |
|
| |
|
|
|
US Industrial Production Rebounded 1.6% in October. U.S. industrial production rebounded in October as auto production, which has been hurt by supply chain problems, posted a strong increase and the adverse effects from Hurricane Ida faded. U.S. industrial production rebounded in October as automakers, stung by supply chain problems, posted strong increases and the adverse effects from a hurricane that struck the nation's energy complex in the Gulf of Mexico faded. ndustrial production rose 1.6% last month after a 1.3% plunge in September, the Federal Reserve reported Tuesday. The gain was double what had been expected. Capacity utilization for the manufacturing sector, a measure of how fully firms are using their resources, increased 0.9 percentage point in October to 76.7%, the highest since January 2019. Overall capacity use for the industrial sector rose to 76.4% from 75.2% in September. It is 3.2 percentage points below its 1972-2020 average.. |
No 11 |
1.6% |
|
Oct-2021 |
|
| |
|
|
|
U.S. industrial production fell 1.3% in September 2021, much more than expected. The lingering effects of Hurricane Ida continued to stymie activity. The government said manufacturing output fell 0.7%, dragged down by a 7.2% decline in motor vehicles and parts as shortages of semiconductors continued to thwart the industry. Outside of the auto industry, factory output declined 0.3% the government said. Capacity utilization for the entire industrial sector fell 1% in September to 75.2%, about 4.4% below its average. |
No 10 |
|
|
Sep-2021 |
|
| |
|
|
|
U.S. industrial production slowed to a 0.4% gain in August as shutdowns of petroleum refineries and petrochemical plants caused by Hurricane Ida curbed manufacturing activity.US industrial production rose 0.4% in August on a monthly basis, in line with the market estimate, according to data released by the Federal Reserve on Wednesday. Industrial production, which measures the change in the value of output produced by manufacturers and utilities, showed an increase of 0.8% in July, revised down from 0.9%.The nation's factories, mines and utilities operated at 76.4% of capacity in August, up slightly from 76.2% in July. |
No 9 |
0.4% |
|
Aug-2021 |
|
| |
|
|
|
Production at U.S. factories surged in July 2021, boosted by an acceleration in motor vehicle output as automakers either pared or canceled annual retooling shutdowns to work around a global semiconductor shortage.Manufacturing output jumped 1.4% last month after falling 0.3% in June, the Federal Reserve said on Tuesday. Economists polled by Reuters had forecast manufacturing production rising 0.6%. Last month, production at auto plants soared 11.2%. The Fed said industrial production advanced by 0.9 percent in July after edging up by a downwardly revised 0.2 percent in June. Economists had expected industrial production to rise by 0.4 percent, matching the increase originally reported for the previous month..Capacity utilization for the manufacturing sector, a measure of how fully firms are using their resources, increased 1.1 percentage points to 76.6% in July. Overall capacity use for the industrial sector rose 0.7 percentage point to 76.1%. It is 3.5 percentage points below its 1972-2020 average. |
No 8 |
0.9% |
|
Jul-2021 |
|
| |
|
|
|
Industrial production rose for a fourth consecutive month in June 2021, but the details of the report were a mixed bag. Ongoing supply chain issues were highly visible in today's report, with overall manufacturing activity falling 0.1% in June, the result of a 6.6% decline in auto production. A major contributor to this drop was the ongoing shortage of semiconductors which continues to keep finished cars from rolling off assembly lines. Meanwhile, manufacturing outside the auto sector rose 0.4% in June, and now sits above its pre-pandemic high. in June, manufacturing output edged down 0.1%, as an ongoing shortage of semiconductors contributed to a decrease of 6.6% in the production of motor vehicles and parts. Excluding motor vehicles and parts, factory output increased 0.4%. The output of utilities advanced 2.7%, reflecting heightened demand for air conditioning, as much of the country experienced a heat wave in June. The index for mining increased 1.4%. |
No 7 |
0.4% |
|
Jun-2021 |
|
| |
|
|
|
U.S. Industrial Production Has Broad Gains in May 2021. US industrial production up 0.8% in May, factory output 0.9%. Surging output of cars, trucks and auto parts pulled U.S. factory production up 0.9% in May. urging output of cars, trucks and auto parts pulled U.S. factory production up 0.9% in May. Adding utilities and mines, overall U.S. industrial production climbed 0.8% in May from April, the Federal Reserve reported Tuesday. Manufacturing production advanced 0.9%, reflecting, due in part to a large gain in motor vehicle assemblies; factory output excluding motor vehicles and parts increased 0.5%. The indexes for mining and utilities rose 1.2% and 0.2%, respectively.Capacity utilization for the industrial sector rose 0.6 percentage point in May to 75.2%, a rate that was 4.4 percentage points below its long-run (1972–2020) average. |
No 6 |
0.8% |
|
May-2021 |
|
| |
|
|
|
U.S. industrial production increased for a second-straight month in April 2021 as more factories came online after being shutdown by winter ice storms. Industrial production -- which includes output at factories, mines and utilities -- rose 0.7% last month, down from a sharp increase of 2.4% in March, the Federal Reserve reported Friday. The March gain, however, was revised sharply higher from an initial estimate of a 1.4% rise. U.S. manufacturing output rose 0.7% in April , the Federal Reserve said Friday. Economists polled by the Wall Street Journal had forecast industrial output rising 0.8% in April. Capacity utilization for the manufacturing sector, a measure of slack in the economy, rose to 74.9% in April from 74.4% in March. The April rate is 4.7 percentage points below its long-run average. |
No 5 |
0.7% |
|
Apr-2021 |
|
| |
|
|
|
Industrial production rebounded 1.4% in March 2021 after a revised 2.6% decline in the prior month. The Fed said industrial production jumped by 1.4 percent in March after plunging by a downwardly revised 2.6 percent in February. The rebound fell short of expectations, however, as economists had expected production to spike by 2.8 percent compared to the 2.2 percent slump originally reported for the previous month.Total industrial production, which also includes mining and utility output, rose 1.4% in March after a revised 2.6% decrease a month earlier. The median estimate in a Bloomberg survey of economists called for a 3.6% monthly increase in factory production. The March reading was softer than forecast as automakers continued to deal with shortages of semiconductors |
No 4 |
1.4% |
|
Mar-2021 |
|
| |
|
|
|
The Fed said industrial production tumbled by 2.2 percent in February 2021after jumping by an upwardly revised 1.1 percent in January. The pullback surprised economists, who had expected industrial production to climb by 0.6 percent compared to the 0.9 percent increase originally reported for the previous month. The unexpected decrease in industrial production came as manufacturing output plunged by 3.1 percent in February after surging up by 1.2 percent in January.
|
No 3 |
-2.2% |
|
Feb-2021 |
|
| |
|
|
|
American industry expanded for the fourth consecutive month in January 2021, but it has yet to return to the level of activity that preceded the pandemic.
U.S. industrial production — which includes output factories, mines and utiliites — rose 0.9% last month on top of increases of 1.3% in December, 0.9% in November and 1.1% in October, the Federal Reserve reported Wednesday. Still, industrial production was down 1.8% from January 2020, reflecting lingering economic damage from the coronavirus pandemic. While the January 2021 activity was greater than most economists had projected, it was 1.8% below production in January 2020, reflecting lingering economic damage from the coronavirus pandemic. |
No 2 |
0.9% |
|
Jan-2021 |
|
| |
|
|
|
U.S. industrial production rose 1.6% in December 2021, a third straight monthly gain, but remains below its pre-pandemic level. The December gain in industrial output followed a 0.5% increase in November and a 1% increase in October, the Federal Reserve reported Friday. Even with those gains, industrial output is still about 3.3% below its level in February before the pandemic hit. Manufacturing increased 0.9%, its eighth straight monthly gain, even as production of motor vehicles and parts declined 1.6%. That follows a string of gains for the auto sector, including last month's strong 5% increase. Without the drag in the auto sector last month, manufacturing posted gains of 1.1%. Mining production rose 1.6%, while utilities' output rose 6.2% as a rebound in December demand followed a 4.2% decline in November due to unseasonably warm weather. U.S. industry operated at 74.5% of capacity in December, still below the pre-pandemic rate of 76.9% in February.
|
No 1 |
1.6% |
|
Dec-2020 |
|
| |
|
|
|
|
|
|
|
|
| |
|
|
|
|
|
| |
|
Legends: |
|
Delayed |
|
Positive View |
|
Negative View |
|
Neutral View |
|
Non Available |
|
|
|
|
|
|
|
|
|
|
|
|
|
|
|
|
|
|
|
|
| |
|
|
|
|
|
|
|
|
|
|
|
|
|
|
|
|
|
|
|
|
|
Definitions | Explain |
|
|
Industrial Production | Manufacturing |
|
Today's Week |
|
|
|
|
|
|
|
|
|
|
|
|
| |
|
|
|
|
| |
|
| How the "Industrial Production" Affects You? |
Industrial production and capacity utilization are important measures of current output for the US economy and helps to define turning points in the business cycle.
This two measures also indicate trends in the manufacturing sector and whether resource utilization is strained enough to forebode inflation.
The Federal Reserve's monthly index of industrial production and the related capacity indexes and capacity utilization rates cover manufacturing, mining, and electric and gas utilities. The industrial sector, together with construction, accounts for the bulk of the variation in national output over the course of the business cycle.
The production index measures real output and is expressed as a percentage of real output in a base year, currently 2007. The capacity index, which is an estimate of sustainable potential output, is also expressed as a percentage of actual output in 2007. The rate of capacity utilization equals the seasonally adjusted output index expressed as a percentage of the related capacity index.
Industrial production and capacity utilization indicate not only trends in the manufacturing sector, but also whether resource utilization is strained enough to forebode inflation.
Also, industrial production is an important measure of current output for the economy and helps to define turning points in the business cycle (start of recession and start of recovery).
Capacity Utilization
Labor productivity, or output per hour, is calculated by dividing an index of real output by an index of hours worked of all persons, including employees, proprietors, and unpaid family workers.
BLS defines unit labor costs as the ratio of hourly compensation to labor productivity; increases in hourly compensation tend to increase unit labor costs and increases in output per hour tend to reduce them.
US manufacturing output,
Production at U.S. factories,
factory output.
Production at factories
Total industrial output
Capacity utilization for the industrial sector, a measure of how fully firms are using their resources,
|
|
|
| |
|
|
|
|
|
|
|
|
|
|
|
|
|
|
|
|
|
|
|
|
|
Data | Source |
|
|
Industrial Production | Manufacturing |
|
Today's Week |
|
|
|
|
|
|
|
|
|
|
|
|
| |
|
|
|
|
|
|
| DATA INFORMATION |
INDUSTRIAL PRODUCTION |
| SOURCE |
Institute for Supply Management. |
| WEB |
www.hts.com |
| FREQUENCY |
Monthly |
| AVAILABILITY |
The first business day of the month. |
| COVERAGE |
Data are for the previous month. Data for June are released in July. |
| REVISIONS |
Yes |
| IMPORTANCE |
Manufacturing - Very Important |
|
| |
|
|
|
|
|
|
|
|
|
|
|
|