|
 |
|
 |
Philadelphia Mfg Index | Manufacturing |
|
 |
|
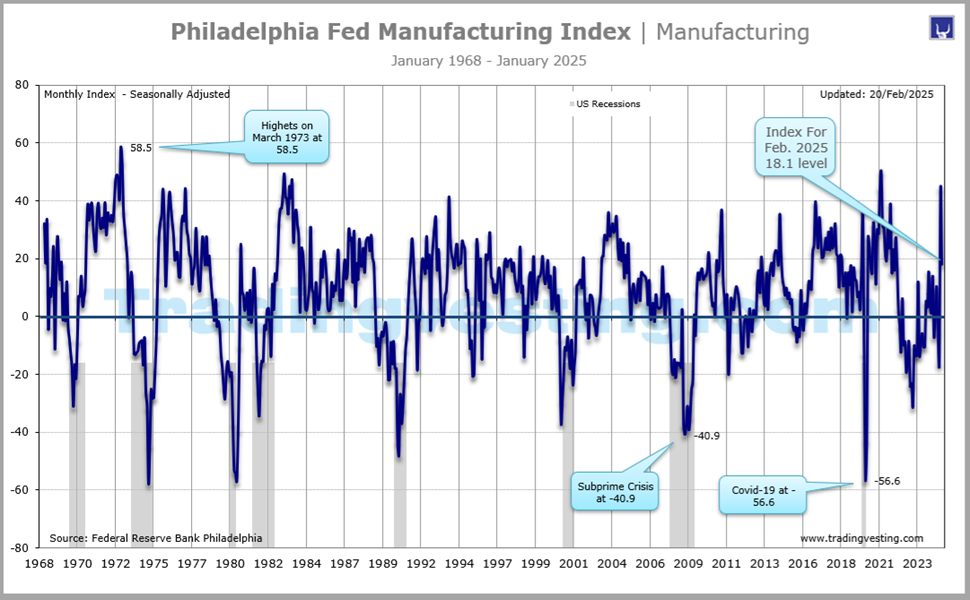
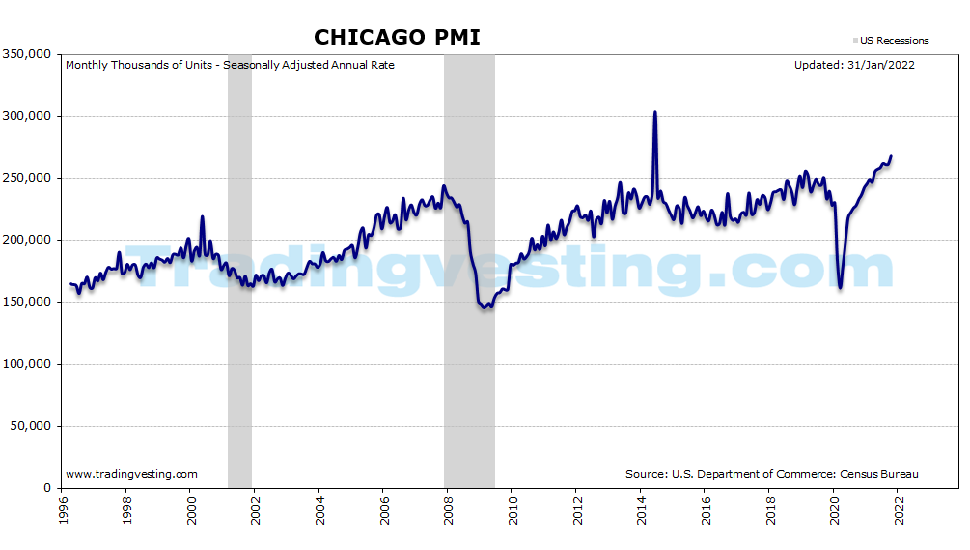
The Philly Fed Index gauges changes in business growth in the third district including Pennsylvania, New Jersey and Delaware. The index above 0 indicates factory-sector growth while below 0 indicates contraction. Read More
|
|
|
|
|
|
|
| |
|
| |
 9. Philadelphia Mfg Index (9 of 9) 9. Philadelphia Mfg Index (9 of 9) 1. ISM Manufacturing Index (1 of 9) 1. ISM Manufacturing Index (1 of 9) 2. Industrial Production (2 of 9) 2. Industrial Production (2 of 9) 3. Durable Goods Orders (3 of 9) 3. Durable Goods Orders (3 of 9)4. Factory Orders (4 of 9)
 5. Empire State Mafg Index (5 of 9) 5. Empire State Mafg Index (5 of 9)6. PMI Mfg Final (6 of 9)
 7. PMI Composite Flash (7 of 9) 7. PMI Composite Flash (7 of 9) 8. Chicago PMI (8 of 9) 8. Chicago PMI (8 of 9)
|
 |
|
|
|
|
| |
|
→ Big Chart |
|
→ Release |
|
| |
|
|
|
|
|
|
|
|
|
|
|
|
|
|
|
|
|
|
|
 |
|
Big Chart | Large Data |
 |
|
Philadelphia Mfg Index | Manufacturing |
|
Today's Week |
 |
|
|
|
|
|
|
|
|
|
|
|
|
|
| |
|
|
|
|
|
|
|
|
|
|
|
|
|
|
|
|
|
|
|
|
|
Slides | Ten 10 |
|
|
Philadelphia Mfg Index | Manufacturing |
|
Today's Week |
|
|
|
|
|
|
|
|
|
|
|
|
|
|
| |
|
|
|
|
|
|
|
|
|
|
|
|
|
|
|
|
|
|
|
|
|
Release Schedule | 2026 |
|
|
Philadelphia Fed Mfg Index | Manufacturing |
|
Today's Week |
|
|
|
|
|
|
|
|
|
|
|
|
|
Philadelphia Fed Manufacturing index (At 8:30 a.m ET)
| SCHEDULE 2026 |
No 1 |
No 2 |
No 3 |
No 4 |
No 5 |
No 6 |
No 7 |
No 8 |
No 9 |
No 10 |
No 11 |
No 12 |
| Release | Week |
|
|
|
|
|
|
|
|
|
|
|
|
| Release | Date |
|
|
|
|
|
|
|
|
|
|
|
|
| Release | Day |
|
|
|
|
|
|
|
|
|
|
|
|
 |
|
|
|
|
|
|
|
|
|
|
|
|
| Prior |
-10.2 |
12.6 |
16.3 |
... |
... |
... |
... |
... |
... |
... |
... |
... |
| Prior Revised |
-8.8 |
... |
... |
... |
... |
... |
... |
... |
... |
... |
... |
... |
| CONSENSUS |
-3.5 |
7.7 |
5.5 |
... |
... |
... |
... |
... |
... |
... |
... |
... |
| Consensus Low |
-11.8 |
5.0 |
2.0 |
... |
... |
... |
... |
... |
... |
... |
... |
... |
| Consensus High |
-1.0 |
12.2 |
11.6 |
... |
... |
... |
... |
... |
... |
... |
... |
... |
| INDEX |
12.6 |
16.3 |
18.1 |
... |
... |
... |
... |
... |
... |
... |
... |
... |
| RATING |
|
|
|
|
|
|
|
|
|
|
|
|
| Month For |
Jan-26 |
Feb-26 |
Mar-26 |
Apr-26 |
May-26 |
Jun-26 |
Jul-26 |
Aug-26 |
Sep-26 |
Oct-26 |
Nov-26 |
Dec-26 |
|
|
|
|
|
|
|
|
|
|
|
|
|
|
|
| |
|
| |
|
|
|
|
|
|
|
|
|
|
|
Release Schedule | 2025 |
|
|
Philadelphia Fed Mfg Index | Manufacturing |
|
Today's Week |
|
|
|
|
|
|
|
|
|
|
|
|
|
Philadelphia Fed Manufacturing index (At 8:30 a.m ET)
| SCHEDULE 2025 |
No 1 |
No 2 |
No 3 |
No 4 |
No 5 |
No 6 |
No 7 |
No 8 |
No 9 |
No 10 |
No 11 |
No 12 |
| Release | Week |
|
|
|
|
|
|
|
|
|
|
|
|
| Release | Date |
|
|
|
|
|
|
|
|
|
|
|
|
| Release | Day |
|
|
|
|
|
|
|
|
|
|
|
|
|
|
|
|
|
|
|
|
|
|
|
|
|
| Prior |
-16.4 |
44.3 |
18.1 |
12.5 |
-26.4 |
-4.0 |
-4.0 |
15.9 |
-0.3 |
23.2 |
-12.8 |
-1.7 |
| Prior Revised |
-10.9 |
... |
... |
... |
... |
... |
... |
... |
... |
... |
... |
... |
| CONSENSUS |
-7.0 |
22.7 |
11.5 |
6.7 |
-10.0 |
-1.0 |
-0.4 |
8.0 |
3.0 |
7.5 |
0.0 |
2.2 |
| Consensus Low |
-11.1 |
5.4 |
9.0 |
-10.5 |
-20.0 |
-10.0 |
-5.0 |
2.0 |
-3.0 |
-1.0 |
-8.0 |
-5.0 |
| Consensus High |
0.0 |
30.0 |
17.2 |
11.5 |
5.5 |
5.6 |
6.7 |
13.3 |
8.0 |
18.4 |
8.0 |
8.0 |
| INDEX |
44.3 |
18.1 |
12.5 |
-26.4 |
-4.0 |
-4.0 |
15.9 |
-0.3 |
23.2 |
-12.8 |
-1.7 |
-10.2 |
| RATING |
|
|
|
|
|
|
|
|
|
|
|
|
| Month For |
Jan-25 |
Feb-25 |
Mar-25 |
Apr-25 |
May-25 |
Jun-25 |
Jul-25 |
Aug-25 |
Sep-25 |
Oct-25 |
Nov-25 |
Dec-25 |
|
|
|
|
|
|
|
|
|
|
|
|
|
|
|
| |
|
| |
|
|
|
|
|
|
|
|
|
|
|
Release Schedule | 2024 |
|
|
Philadelphia Fed Mfg Index | Manufacturing |
|
Today's Week |
|
|
|
|
|
|
|
|
|
|
|
|
|
Philadelphia Fed Manufacturing index (At 8:30 a.m ET)
| SCHEDULE 2024 |
No 1 |
No 2 |
No 3 |
No 4 |
No 5 |
No 6 |
No 7 |
No 8 |
No 9 |
No 10 |
No 11 |
No 12 |
| Release | Week |
|
|
|
|
|
|
|
|
|
|
|
|
| Release | Date |
|
|
|
|
|
|
|
|
|
|
|
|
| Release | Day |
|
|
|
|
|
|
|
|
|
|
|
|
|
|
|
|
|
|
|
|
|
|
|
|
|
| Prior |
-10.5 |
-10.6 |
5.2 |
3.2 |
15.5 |
4.5 |
1.3 |
13.9 |
-7.0 |
1.7 |
10.3 |
-5.5 |
| Prior Revised |
-12.8 |
... |
... |
... |
... |
... |
... |
... |
... |
... |
... |
... |
| CONSENSUS |
-6.7 |
-9.0 |
-5.0 |
0.0 |
7.8 |
5.2 |
3.0 |
5.8 |
2.0 |
3.0 |
7.0 |
2.5 |
| Consensus Low |
-8.0 |
-15.0 |
-8.6 |
-0.3 |
-1.3 |
1.0 |
-2.0 |
0.7 |
-5.2 |
0.6 |
0.0 |
1.0 |
| Consensus High |
-5.0 |
-5.9 |
3.0 |
0.3 |
13.6 |
10.0 |
5.0 |
11.0 |
2.9 |
5.0 |
11.0 |
10.0 |
| PHILADELPHIA |
-10.6 |
5.2 |
3.2 |
15.5 |
4.5 |
1.3 |
13.9 |
-7.0 |
1.7 |
10.3 |
-5.5 |
-16.4 |
| RATING |
|
|
|
|
|
|
|
|
|
|
|
|
| Month For |
Jan-24 |
Feb-24 |
Mar-24 |
Apr-24 |
May-24 |
Jun-24 |
Jul-24 |
Aug-24 |
Sep-24 |
Oct-24 |
Nov-24 |
Dec-24 |
|
|
|
|
|
|
|
|
|
|
|
|
|
|
|
| |
|
| |
|
|
|
|
|
|
|
|
|
|
|
Release Schedule | 2023 |
|
|
Philadelphia Fed Mfg Index | Manufacturing |
|
Today's Week |
|
|
|
|
|
|
|
|
|
|
|
|
|
Philadelphia Fed Manufacturing index (At 8:30 a.m ET)
| SCHEDULE 2023 |
No 1 |
No 2 |
No 3 |
No 4 |
No 5 |
No 6 |
No 7 |
No 8 |
No 9 |
No 10 |
No 11 |
No 12 |
| Release | Week |
|
|
|
|
|
|
|
|
|
|
|
|
| Release | Date |
|
|
|
|
|
|
|
|
|
|
|
|
| Release | Day |
|
|
|
|
|
|
|
|
|
|
|
|
|
|
|
|
|
|
|
|
|
|
|
|
|
| Prior |
-13.8 |
-8.9 |
-24.3 |
-24.3 |
-31.3 |
-10.4 |
-13.7 |
-13.5 |
12.0 |
-13.5 |
-9.0 |
-5.9 |
| Prior Revised |
-13.7 |
... |
... |
... |
... |
... |
... |
... |
... |
... |
... |
... |
| CONSENSUS |
-10.3 |
-7.2 |
-15.8 |
-19.4 |
-20.0 |
-14.5 |
-10.0 |
-10.0 |
0.5 |
-7.0 |
-11.0 |
-3.0 |
| Consensus Low |
-13.0 |
-9.8 |
-25.0 |
-25.0 |
-25.0 |
-20.0 |
-17.0 |
-19.4 |
-5.0 |
-11.7 |
-15.0 |
-7.3 |
| Consensus High |
-8.2 |
-5.0 |
-10.0 |
-11.7 |
-15.0 |
-3.5 |
-5.0 |
-6.8 |
11.8 |
-3.5 |
-7.0 |
0.0 |
| PHILADELPHIA |
-8.9 |
-24.3 |
-23.2 |
-31.3 |
-10.4 |
-13.7 |
-13.5 |
12.0 |
-13.5 |
-9.0 |
-5.9 |
-10.5 |
| RATING |
|
|
|
|
|
|
|
|
|
|
|
|
| Month For |
Jan-23 |
Feb-23 |
Mar-23 |
Apr-23 |
May-23 |
Jun-23 |
Jul-23 |
Aug-23 |
Sep-23 |
Oct-23 |
Nov-23 |
Dec-23 |
|
|
|
|
|
|
|
|
|
|
|
|
|
|
|
| |
|
| |
|
|
|
|
|
|
|
|
|
|
|
Release Schedule | 2022 |
|
|
Philadelphia Fed Mfg Index | Manufacturing |
|
Today's Week |
|
|
|
|
|
|
|
|
|
|
|
|
|
Philadelphia Fed Manufacturing index (At 8:30 a.m ET)
| SCHEDULE 2022 |
No 1 |
No 2 |
No 3 |
No 4 |
No 5 |
No 6 |
No 7 |
No 8 |
No 9 |
No 10 |
No 11 |
No 12 |
| Release | Week |
|
|
|
|
|
|
|
|
|
|
|
|
| Release | Date |
|
|
|
|
|
|
|
|
|
|
|
|
| Release | Day |
|
|
|
|
|
|
|
|
|
|
|
|
|
|
|
|
|
|
|
|
|
|
|
|
|
| Prior |
15.4 |
23.2 |
16.0 |
27.4 |
17.6 |
2.6 |
-3.3 |
-12.3 |
6.2 |
-9.9 |
-8.7 |
-19.4 |
| Prior Revised |
... |
... |
... |
... |
... |
... |
... |
... |
... |
... |
... |
... |
| CONSENSUS |
19.1 |
19.7 |
15.0 |
20.5 |
16.1 |
5.5 |
-3.3 |
-5.0 |
3.1 |
-5.0 |
-7.0 |
-9.9 |
| Consensus Low |
17.0 |
17.0 |
10.0 |
15.3 |
7.6 |
5.0 |
-8.0 |
-15.0 |
1.5 |
-15.0 |
-15.0 |
-15.0 |
| Consensus High |
27.2 |
27.0 |
18.5 |
23.0 |
23.1 |
17.0 |
5.3 |
2.0 |
9.0 |
0.2 |
5.0 |
-5.0 |
| PHILADELPHIA |
23.2 |
16.0 |
27.4 |
17.6 |
2.6 |
-3.3 |
-12.3 |
6.2 |
-9.9 |
-8.7 |
-19.4 |
-13.8 |
| RATING |
|
|
|
|
|
|
|
|
|
|
|
|
| Month For |
Jan-22 |
Feb-22 |
Mar-22 |
Apr-22 |
May-22 |
Jun-22 |
Jul-22 |
Aug-22 |
Sep-22 |
Oct-22 |
Nov-22 |
Dec-22 |
|
|
|
|
|
|
|
|
|
|
|
|
|
|
|
| |
|
| |
|
|
|
|
|
|
|
|
|
|
|
Release Schedule | 2021 |
|
|
Philadelphia Fed Mfg Index | Manufacturing |
|
Today's Week |
|
|
|
|
|
|
|
|
|
|
|
|
|
Philadelphia Fed Manufacturing index (At 8:30 a.m ET)
| SCHEDULE 2021 |
No 1 |
No 2 |
No 3 |
No 4 |
No 5 |
No 6 |
No 7 |
No 8 |
No 9 |
No 10 |
No 11 |
No 12 |
| Release | Week |
|
|
|
|
|
|
|
|
|
|
|
|
| Release | Date |
|
|
|
|
|
|
|
|
|
|
|
|
| Release | Day |
|
|
|
|
|
|
|
|
|
|
|
|
|
|
|
|
|
|
|
|
|
|
|
|
|
| Prior |
8.1 |
26.5 |
23.1 |
51.8 |
50.2 |
31.5 |
30.7 |
21.9 |
19.4 |
30.7 |
23.8 |
39.0 |
| Prior Revised |
4.6 |
... |
... |
44.5 |
... |
... |
... |
... |
... |
... |
... |
... |
| CONSENSUS |
6.0 |
20.0 |
24.0 |
43.0 |
45.0 |
31.0 |
28.5 |
25.0 |
18.8 |
25.0 |
24.0 |
28.8 |
| Consensus Low |
2.0 |
11.1 |
18.9 |
30.0 |
39.5 |
25.7 |
24.2 |
14.6 |
10.1 |
20.6 |
20.1 |
25.0 |
| Consensus High |
14.5 |
23.0 |
30.0 |
47.6 |
48.0 |
34.5 |
30.0 |
35.6 |
21.5 |
30.7 |
30.2 |
40.0 |
| PHILADELPHIA |
26.5 |
23.1 |
51.8 |
50.2 |
31.5 |
30.7 |
21.9 |
19.4 |
30.7 |
23.8 |
39.0 |
15.4 |
| RATING |
|
|
|
|
|
|
|
|
|
|
|
|
| Month For |
Jan-21 |
Feb-21 |
Mar-21 |
Apr-21 |
May-21 |
Jun-21 |
Jul-21 |
Aug-21 |
Sep-21 |
Oct-21 |
Nov-21 |
Dec-21 |
|
|
|
|
|
|
|
|
|
|
|
|
|
|
|
| |
|
|
| |
|
|
|
|
|
|
|
|
|
|
|
|
|
|
|
|
|
|
|
|
|
Brief News | 2026 |
|
|
Philadelphia Fed Mfg Index | Manufacturing |
|
Today's Week |
|
|
|
|
|
|
|
|
|
|
|
|
|
Philadelphia Fed Manufacturing Index | Manufacturing
| DATE/WEEK |
HIGHLIGHTS |
FOR |
ACTUAL |
|
Philadelphia Region Manufacturing |
No 12 |
... |
|
Dec-2025 |
|
| |
|
|
|
Philadelphia Region Manufacturing |
No 11 |
... |
|
Nov-2025 |
|
| |
|
|
|
Philadelphia Region Manufacturing |
No 10 |
... |
|
Oct-2025 |
|
| |
|
|
|
Philadelphia Region Manufacturing |
No 9 |
... |
|
Sep-2025 |
|
| |
|
|
|
Philadelphia Region Manufacturing |
No 8 |
... |
|
Aug-2025 |
|
| |
|
|
|
Philadelphia Region Manufacturing |
No 7 |
... |
|
Jul-2025 |
|
| |
|
|
|
Philadelphia Region Manufacturing |
No 6 |
... |
|
Jun-2025 |
|
| |
|
|
|
Philadelphia Region Manufacturing |
No 5 |
... |
|
May-2025 |
|
| |
|
|
|
Philadelphia Region Manufacturing |
No 4 |
... |
|
Apr-2025 |
|
| |
|
|
|
Philadelphia Region Manufacturing |
No 3 |
... |
|
Mar-2025 |
|
| |
|
|
|
Philadelphia Region Manufacturing |
No 2 |
16.3 |
|
Feb-2025 |
|
| |
|
|
|
Philadelphia Region Manufacturing |
No 1 |
12.6 |
|
Jan-2025 |
|
| |
|
|
|
|
|
|
|
|
| |
|
|
|
|
|
| |
|
|
|
|
|
|
|
|
|
|
|
|
|
|
|
Brief News | 2025 |
|
|
Philadelphia Fed Mfg Index | Manufacturing |
|
Today's Week |
|
|
|
|
|
|
|
|
|
|
|
|
|
Philadelphia Fed Manufacturing Index | Manufacturing
| DATE/WEEK |
HIGHLIGHTS |
FOR |
ACTUAL |
|
Philadelphia Region Manufacturing |
No 12 |
-10.2 |
|
Dec-2025 |
|
| |
|
|
|
Philadelphia Region Manufacturing |
No 11 |
-1.7 |
|
Nov-2025 |
|
| |
|
|
|
Philadelphia Region Manufacturing |
No 10 |
-12.8 |
|
Oct-2025 |
|
| |
|
|
|
The latest data shows significant strengthening of manufacturing activity in the Philadelphia Fed's Business Outlook Survey, with the main index climbing to +23.2 in September 2025, a significant improvement from -0.3 in August and the highest level since January. This jump indicates robust growth, with other key indicators such as future new orders, future shipments, and future capital expenditures also showing strong gains. |
No 9 |
23.2 |
|
Sep-2025 |
|
| |
|
|
|
In August 2025, the Philadelphia Fed Manufacturing Index fell to -0.3, indicating a renewed contraction in manufacturing activity after a strong July, and missing analysts' expectations of a positive 7.0 reading. The decline reversed a previous improvement, with key sub-indexes for general activity and new orders also turning negative, though shipments remained positive. Despite the current slowdown, firms reported still expecting growth in the next six months. |
No 8 |
-0.3 |
|
Aug-2025 |
|
| |
|
|
|
In July 2025, the Philadelphia Fed Manufacturing Index surged to 15.9, its first positive reading in months and a significant rebound from the previous month's -4.0. This unexpectedly strong expansion indicated a renewed optimism and recovery in the regional manufacturing sector, with key components like new orders, shipments, and employment all turning positive. Despite some increased price pressures, forward-looking indicators suggested firms expected continued growth over the next six months. |
No 7 |
15.9 |
|
Jul-2025 |
|
| |
|
|
|
The Philly Fed's Manufacturing Business Outlook Survey is a monthly survey of about 250 manufacturers in the Third Federal Reserve District, which covers eastern Pennsylvania, southern New Jersey, and Delaware. Participants of the survey indicate the relative level of general business conditions in the region. Since this is a diffusion index, negative readings indicate contraction, positive ones indicate expansion. While it focuses exclusively on business in this district, this regional survey gives a reliable direction of the broader Chicago Fed's National Activity Index. The latest Philadelphia Fed manufacturing index showed weak activity this month. The index was unchanged at -4.0, marking the third straight negative reading. The latest reading was worse than the forecast of -1.7. |
No 6 |
-4.0 |
|
Jun-2025 |
|
| |
|
|
|
The diffusion index for current general activity rose from -26.4 to -4.0 in May, paring some of last month’s sharp decline but remaining negative (see Chart). Twenty-three percent of the firms reported decreases in general activity this month (down from 39 percent last month), while 19 percent reported increases (up from 13 percent); 58 percent reported no change (up from 41 percent last month). The new orders index rose 42 points to 7.5, offsetting nearly all of April’s decline. The shipments index declined for the fourth consecutive month, falling 4 points to -13.0, its lowest reading since November 2023. |
No 5 |
-4.0 |
|
May-2025 |
|
| |
|
|
|
The index plunged 39 points to -26.4, indicating a substantial worsening of manufacturing conditions.. The Philadelphia Fed Manufacturing Index for April 2025 showed a sharp contraction in regional manufacturing activity, falling to -26.4, down significantly from 12.5 in March and considerably below market expectations. This marked the most severe contraction since April 2023, with a significant drop in the new orders index to its lowest level since April 2020. |
No 4 |
-26.4 |
|
Apr-2025 |
|
| |
|
|
|
Philadelphia manufacturing measure better than expected. Factory activity in the Philadelphia area was better than expected in March as hiring intentions hit a multiyear high. The Philadelphia Federal Reserve’s manufacturing index posted a reading of 12.5 for the month, down from 18.1 in February but better than the Dow Jones estimate for 10. The index measures the percentage difference between companies reporting expansion against contraction. Hiring hit its highest level since October 2022, with the index rising to 19.7, jumping more than 14 points on the month. Prices indexes were mixed. |
No 3 |
12.5 |
|
Mar-2025 |
|
| |
|
|
|
The Philadelphia Federal Reserve's monthly manufacturing index on Thursday showed it tumbled by 26.2 points - the most in nearly five years - to 18.1 in February from 44.3 in January, which had been the highest in almost four years. Factory output growth slowed in the U.S. mid-Atlantic region in February as input prices surged, with a measure of prices paid for production materials climbing to the highest in nearly two-and-a-half years even before most of the new tariffs on imports imposed by President Donald Trump are due to take effect. |
No 2 |
18.1 |
|
Feb-2025 |
|
| |
|
|
|
Philly Fed's factory gauge surges by most since June 2020. A gauge of manufacturing activity in the U.S. Mid-Atlantic region shot up by the most in about four-and-a-half years in January, with new orders and shipments both surging, a potential indication that the factory sector's long slump may be ending. The Federal Reserve Bank of Philadelphia said on Thursday that its monthly manufacturing index rose to 44.3, its highest since April 2021, from a revised minus 10.9 in December. The net increase was the largest since June 2020 after factories began reopening from the initial wave of COVID-19 shutdowns and was the second largest increase on record. |
No 1 |
44.3 |
|
Jan-2025 |
|
| |
|
|
|
|
|
|
|
|
| |
|
|
|
|
|
| |
|
|
|
|
|
|
|
|
|
|
|
|
|
|
|
Brief News | 2024 |
|
|
Philadelphia Fed Mfg Index | Manufacturing |
|
Today's Week |
|
|
|
|
|
|
|
|
|
|
|
|
|
Philadelphia Fed Manufacturing Index | Manufacturing
| DATE/WEEK |
HIGHLIGHTS |
FOR |
ACTUAL |
|
Philadelphia Region Manufacturing Weakens Again in Blow to Recovery Hopes. Manufacturing activity in the Philadelphia area fell back markedly this month, thwarting hopes for a post-election rebound. The Federal Reserve Bank of Philadelphia said Thursday that its index for business activity plunged to minus 16.4 in December from minus 5.5 in November, the lowest point since the first half of last year. That suggests activity decreased more rapidly this month, in contrast with economists' expectations for a rebound to the positive territory that would suggest a recovery in regional manufacturing. The Philadelphia Fed survey polls manufacturers in the Third Federal Reserve District, which covers eastern Pennsylvania, southern New Jersey and Delaware. |
No 12 |
-16.4 |
|
Dec-2024 |
|
| |
|
|
|
The US Philadelphia Fed manufacturing general business conditions index took a surprising step back to minus 5.5 in November from 10.3 in October after September's marginally positive 1.7. Forecasters were caught off guard by the return to contraction in November as consensus expectations called for a positive reading at 7.0, with a range of 0 to 11.0. Even as general business conditions were seen in contraction, most current sub-indexes remained somewhat positive. The key forward-looking one, new orders, only eased to 8.9 in November from 14.2 in October. Shipments were at 4.5 versus 7.4, and employment, everyone's focus, turned positive at 8.6 versus minus 2.2. On the current pricing front, the prices paid sub-index was pretty steady at 26.6 versus 29.7 while prices received were at 14.3 versus 17.9. The six-month outlook for general business conditions was remarkably buoyant at 56.6 in November versus an already upbeat 36.7 in October. |
No 11 |
-5.5 |
|
Nov-2024 |
|
| |
|
|
|
Philadelphia Fed’s factory gauge jumps in October 2024. The Federal Reserve Bank of Philadelphia released a report on Thursday showing regional manufacturing activity has expanded overall in the month of October. The Philly Fed said its diffusion index for current general activity jumped to 10.3 in October from 1.7 in September, with a positive reading indicating growth. Economists had expected the index to inch up to 3.0. Looking ahead, the Philly Fed said expectations for growth over the next six months were more widespread this month, as the diffusion index for future general activity surged to 36.7 in October from 15.8 in September. |
No 10 |
|
|
Oct-2024 |
|
| |
|
|
|
Philly Fed manufacturing index unexpectedly turns positive. Manufacturing activity in the Philadelphia region unexpectedly expanded in September after contracting sharply the previous month, though current indicators for the industry still remain mixed. According to the Federal Reserve Bank of Philadelphia, the current general activity index for manufacturing jumped from a seven-month low of 7.0 in August to 1.7 last month, surpassing the -1.0 reading expected by economists. |
No 9 |
1.7 |
|
Sep-2024 |
|
| |
|
|
|
The Philly Fed's Manufacturing Business Outlook Survey is a monthly survey of about 250 manufacturers in the Third Federal Reserve District, which covers eastern Pennsylvania, southern New Jersey, and Delaware. Participants of the survey indicate the relative level of general business conditions in the region. Since this is a diffusion index, negative readings indicate contraction, positive ones indicate expansion. While it focuses exclusively on business in this district, this regional survey gives a reliable direction of the broader Chicago Fed's National Activity Index. The latest Philadelphia Fed manufacturing index fell into negative territory for the first time since January as manufacturing activity softened overall. In August, the index dropped to -7.0 from 13.9 in July, coming in below the forecast of 5.4. |
No 8 |
-7.0 |
|
Aug-2024 |
|
| |
|
|
|
Philadelphia Fed’s factory gauge jumps in July, a sign U.S. manufacturing could be recovering. Readings of future activity hits highest level in three years. The Philadelphia Fed said Thursday its gauge of regional business activity rose to 13.9 in July from 1.3 in the prior month. Any reading above zero indicates improving conditions. This is the sixth straight month the index has been above zero. Economists polled by the Wall Street Journal expected a 2.9 reading in July. |
No 7 |
13.9 |
|
Jul-2024 |
|
| |
|
|
|
US June Philly Fed +1.3 vs +5.0 expected. The Philadelphia Fed manufacturing index posted its fifth straight plus reading, but just barely at 1.3 for June. A reading so close to zero indicates only the most marginal upward shift in general sentiment compared to May. One key for the sample's caution is weakness in new orders which did rise by nearly 6 points in June but is still in the negative column at minus 2.2. Unfilled orders, however, did move into the plus column at 8.9 for a more than 20 point jump from May. But this is by far the most favorable reading in June's report which otherwise shows increasing contraction in shipments (at minus 7.2), continued though modest contraction in employment (minus 2.5) and rising inflation pressures for both prices paid, up nearly 4 points to 22.5, and prices received, up more than 7 points to 13.7. The Philadelphia Fed manufacturing index in June is expected to hold steady at 5.2 versus May's 4.5. |
No 6 |
1.3 |
|
Jun-2024 |
|
| |
|
|
|
Gold near session lows after Philly Fed survey falls to 4.5 in May. The gold market is trading near session lows after the Philadelphia Federal Reserve's manufacturing sector survey disappointed market forecasters this month. On Thursday, the regional central bank said its manufacturing business outlook for May declined to 4.5, compared to April’s reading of 15.5. The data was significantly worse than expected as economists were looking for a reading of 8 this month. The key components of the index fell substantially this month. "The index for new orders declined from 12.2 to -7.9, its first negative reading since February, and the shipments index fell from 19.1 to -1.2, its first negative reading since January," they wrote. |
No 5 |
4.5 |
|
May-2024 |
|
| |
|
|
|
Manufacturing activity in the U.S. Mid-Atlantic region expanded by the most in two years in April on the strength of new orders and shipments of finished goods, but renewed input cost pressures could reinforce hesitation among Federal Reserve officials to pivot toward interest rate cuts. The Philadelphia Fed on Thursday said its monthly business conditions index rose to 15.5 from 3.2 in March, exceeding the median estimate among economists in a Reuters poll for a reading of 2.3 and overshooting even the most optimistic forecast among 34 economists surveyed. The data buffers other recent indications of a recovery underway in a U.S. factory sector that by many measures had endured a modest downturn throughout 2023 even as the wider economy grew above its potential.The Philly Fed's index for new orders climbed to its highest since last August and shipments activity was its most brisk since August 2022. The prices paid index rose to its highest since December while prices received by goods producers saw a slight increase. |
No 4 |
15.5 |
|
Apr-2024 |
|
| |
|
|
|
Philly Fed Manufacturing Index Points to Continued Expansion in March 2024. The Federal Reserve Bank of Philadelphia reported that its manufacturing sector Current Activity Diffusion Index slipped to 3.2 in March from 5.2 in February. However, the Action Economics Forecast Survey had expected a decline to -2.3. A reading above zero indicates that activity continued to expand in March. This month’s survey was conducted between March 11 and March 18. |
No 3 |
3.2 |
|
Mar-2024 |
|
| |
|
|
|
There also was some good news on the manufacturing front, as regional surveys in the Federal Reserve’s Philadelphia and New York districts both came in better than expected for February. The Philadelphia survey showed a reading of 5.2, up 16 points and better than the -8 estimate, while the Empire State survey for New York was at -2.4. Although the New York survey still indicated contraction, it was a much better reading than January’s -43.7 and the -15 estimate. The surveys measure the share of companies reporting growth, so a positive reading indicates expansion. |
No 2 |
5.2 |
|
Feb-2024 |
|
| |
|
|
|
The Philadelphia Federal Reserve in the US announced Thursday its manufacturing index has continued to contract in January 2024. The index for current general activity increased 2.2 points but remained at -10.6, recording its 18th negative reading in the past 20 months. A level above zero indicates improving conditions, while anything below that shows worsening conditions. The market expectation for the index to come in at -7.0. More than 26% of the firms reported decreases in current activity, according to Philadelphia Fed. |
No 1 |
-10.6 |
|
Jan-2024 |
|
| |
|
|
|
|
|
|
|
|
| |
|
|
|
|
|
| |
|
|
|
|
|
|
|
|
|
|
|
|
|
|
|
Brief News | 2023 |
|
|
Philadelphia Fed Mfg Index | Manufacturing |
|
Today's Week |
|
|
|
|
|
|
|
|
|
|
|
|
|
Philadelphia Fed Manufacturing index (At 8:30 a.m ET)
| DATE/WEEK |
HIGHLIGHTS |
FOR |
ACTUAL |
|
Year-end weakness was the signal from last week's Empire State report and likewise is the signal from the Philadelphia Fed's manufacturing index which fell from minus 5.9 in November to minus 10.5. New orders are down very sharply this month for Philadelphia's sample, to minus 25.6 from plus 1.3 in what points to weakness in general activity for the opening of 2024. Unfilled orders are likewise in contraction, at minus 7.8 versus minus 9.8. Shipments are at minus 10.8, inventories at minus 4.2, and employment at minus 1.7. Price readings show a pop higher for input costs, up more than 10 points to 25.1, with slight easing in selling prices to 13.6. But December's results aren't depressing the sample's mood as the six-month outlook is actually brigther, up more than 14 points and back in the positive column at 12.1. On net, however, Philly's report is not pointing to a positive start for the 2024 factory sector and extends a stubbornly negative trend for the Federal Reserve's five regional reports. |
No 12 |
-10.5 |
|
Dec-2023 |
|
| |
|
|
|
Philadelphia Fed November manufacturing index -5.9 vs. Philadelphia Fed November manufacturing index -5.9 vs -9.0 expected · Business activity index -2.1 vs +9.2 prior · Employment +4.3 vs +7.8 prior.The pricing numbers are generally good here but while the main index improved, the future index tumbled. Some of that could be related to the auto strike though, so tread carefully. On inflation, there was a special question in the report and -- aside from the wage numbers -- it's along the lines of what the Fed wants to see.The numbers: The Philadelphia Fed said Thursday its gauge of regional business activity improved slightly to negative 5.9 in November. |
No 11 |
-5.9 |
|
Nov-2023 |
|
| |
|
|
|
Philadelphia Fed manufacturing gauge remains in contractionary territory for second straight month. Headline index has been negative in 15 out of last 17 months. The Philadelphia Federal Reserve said Thursday its gauge of regional business activity remained in contractionary territory for the second straight month in October. The index improved 5 points but remained at negative 9.0. This is the index’s 15th negative reading in the past 17 months. |
No 10 |
|
|
Oct-2023 |
|
| |
|
|
|
Philadelphia Fed September manufacturing index -13.5 vs -0.7 estimate. Philadelphia area manufacturing data for September 2023. On the surface, the headline number was weaker but things like prices paid remained elevated. The six-month forward business index was also stronger although there was some declines in the prices paid and received indices. New orders however were higher as were shipments expectations. |
No 9 |
-13.5 |
|
Sep-2023 |
|
| |
|
|
|
Philly Fed's District Factory Activity Unexpectedly Rose in August 2023. Manufacturing activity in the Philadelphia area expanded in August. Manufacturing activity in the Philadelphia area expanded in August, snapping 11 consecutive months of contraction and upending expectations that it would decline again. The Federal Reserve Bank of Philadelphia said Thursday that its index for current general activity was 12.0 compared with minus 13.5 in July. The data, based on a survey among manufacturers in the region, suggest that activity grew as the index came in above zero. The reading flipped expectations by economists polled by The Wall Street Journal, who expected the index to come in at minus 10. |
No 8 |
12.0 |
|
Aug-2023 |
|
| |
|
|
|
US: Philadelphia Fed Manufacturing Index rises to -13.5 in July vs. -10 expected The diffusion index for current general activity of the Federal Reserve Bank of Philadelphia's Manufacturing Survey rose modestly to -13.5 in July from -13.7 in June. This mark was below the market expectation of -10. It was the 11th consecutive negative reading. According to the report, data “suggest continued overall declines in the region’s manufacturing sector this month. The indicators for current activity and new orders remained negative, while the index for shipments turned negative. The firms reported overall increases in prices received and prices paid. The survey’s future indexes improved and suggest that respondents expect growth over the next six months.” |
No 7 |
-13.5 |
|
Jul-2023 |
|
| |
|
|
|
Philly Fed manufacturing index dips a bit more than expected in June 2023. Manufacturing sector activity in the US mid-Atlantic region weakened a tad more than expected in June, the results of a closely followed survey showed. The Federal Reserve Bank of Philadelphia's regional factory index slipped from April's reading of -10.4 to -13.7. Economists had forecast a reading of -12.3. A drop in the sub-index for new orders from -8.9 to -11.0 accounted for most of the decline in the headline gauge. In parallel, the sub-index for prices paid dipped from 10.9 to 10.5, while that for employment jumped back from -8.6 to -0.4. On a more positive note, a sub-index tracking businesses' outlook six months ahead improved from -10.3 to 12.7. |
No 6 |
-13.7 |
|
Jun-2023 |
|
| |
|
|
|
The May Philadelphia Fed Index improved to -10.4 (Briefing.com consensus -16.0) from -31.3 in April. That was a better trend than what seen earlier this week for the Empire State Manufacturing Survey, yet it bears pointing out that a number below 0.0 is still indicative of a contraction in manufacturing activity in the region. |
No 5 |
-10.4 |
|
May-2023 |
|
| |
|
|
|
The Philadelphia Fed Manufacturing Index FELL -8.1 points to -31.3, BELOW the 3-Month average of -26.27, BELOW the 6-Month average of -19.48, and -44.4 BELOW the year-ago level. On an ISM-weighted basis the index ROSE 7.4 points to -14.2, BELOW the 3-Month average of -12.4, BELOW the 6-Month average of -7.98, and -34.1 BELOW the year-ago level. |
No 4 |
-31.3 |
|
Apr-2023 |
|
| |
|
|
|
Philly Fed manufacturing index contracted in March despite monthly improvement. A key measure of U.S. manufacturing activity came in below expectations in March, but improved marginally compared to the prior month, as recent price pressures showed potential signs of easing. The Philadelphia Federal Reserve's manufacturing index inched up slightly for the second straight month to -23.2 from -24.3 in February but remained well within contraction territory. Economists' forecasts had seen the figure jumping to -15.6. New orders and shipments both declined to their lowest marks since May 2020, while companies reported a drop in employment as well. Firms continued to report an overall increase in prices, reflecting a spike in inflation that has been plaguing businesses and consumers alike. Even still, the indexes for prices paid by producers and those received by customers both declined, the Philly Fed survey showed. |
No 3 |
-23.2 |
|
Mar-2023 |
|
| |
|
|
|
Manufacturing activity in the Mid-Atlantic region dropped off sharply and unexpectedly in February, and goods producers reported input cost increases accelerated for the first time in 10 months while their own price increases slowed dramatically, signaling margin pressures were building. The Philadelphia Federal Reserve's monthly manufacturing index plunged to -24.3 this month from -8.9 in January, belying expectations among economists for a third straight monthly improvement. The median estimate in a Reuters survey of economists was for -7.4, and the reading was more than twice as weak as the lowest estimate in the poll. Indexes tracking new orders, shipments, delivery times and employee headcount all weakened.Philadelphia Fed’s manufacturing gauge sinks in February to lowest since May 2020. |
No 2 |
-24.3 |
|
Feb-2023 |
|
| |
|
|
|
US: Philadelphia Fed Manufacturing Index improves to -8.9 in January vs. -11 expected. Philly Fed Manufacturing Index improved modestly in January. The US Dollar fails to gain any respite and remains depressed. The Federal Reserve Bank of Philadelphia's Manufacturing Business Outlook Survey's diffusion index for current general activity improves to -8.9 in January from -13.8 in December. This print comes in better than market expectations, though does little to provide any meaningful impetus. |
No 1 |
-8.9 |
|
Jan-2023 |
|
| |
|
|
|
|
|
|
|
|
| |
|
|
|
|
|
| |
|
|
|
|
|
|
|
|
|
|
|
|
|
|
|
Brief News | 2022 |
|
|
Philadelphia Fed Mfg Index | Manufacturing |
|
Today's Week |
|
|
|
|
|
|
|
|
|
|
|
|
|
Philadelphia Fed Manufacturing index (At 8:30 a.m ET)
| DATE/WEEK |
HIGHLIGHTS |
FOR |
ACTUAL |
|
Philly Fed manufacturing survey shows inflation pressures at 27-month low. Manufacturing activity in the U.S. mid-Atlantic region contracted for a fourth straight month in December, but factory operators reported a brighter outlook and said inflation pressures were easing notably, a survey released Thursday showed. The Philadelphia Federal Reserve's monthly manufacturing activity index climbed to negative 13.8 from negative 19.4 in November. Economists polled by Reuters had estimated a reading of negative 10. New orders tumbled to the lowest since the early days of the coronavirus pandemic in April 2020 and firms said employment shrank. |
No 12 |
-13.8 |
|
Dec-2022 |
|
| |
|
|
|
A gauge of manufacturing activity in the U.S. mid-Atlantic region fell unexpectedly this month to its lowest level – outside of the coronavirus pandemic – since 2011 as firms reported continued softness in new orders and a weak outlook. The Federal Reserve Bank of Philadelphia’s monthly manufacturing index fell to negative 19.4 in November from negative 8.7 in October. Outside the shortlived plunge in activity in the early months of the pandemic, it was the lowest reading since August 2011 and defied expectations in a poll of economists by Reuters for an uptick to negative 6.2. The new orders index was negative for a sixth straight month, weakening fractionally from October with a current reading of negative 16.2. The six-month outlook index, which has also been consistently negative starting in June, came in at negative 7.1, up from negative 14.9 in October. The gauge of employment showed continued growth in hiring but at its weakest pace since June 2020 |
No 11 |
-19.4 |
|
Nov-2022 |
|
| |
|
|
|
Philadelphia Fed finds factory activity pulled back in October. Factory activity in the Federal Reserve Bank of Philadelphia's district contracted again in October, the bank said in a report Thursday. The bank's index for general activity stood at -8.7 for last month, a modest improvement from September's -9.9 reading. Economists had expected a better performance, however, at a forecasted reading of -5. The bank said the negative reading was the fourth such performance over the last five months and noted "nearly 24 percent of the firms reported decreases in general activity this month, while 15 percent reported increases," while a small majority of firms held steady last month. |
No 10 |
-8.7 |
|
Oct-2022 |
|
| |
|
|
|
Philly Fed Index Unexpectedly Turns Negative September. Philadelphia-area manufacturing activity unexpectedly contracted in the month of September, according to a report released by the Federal Reserve Bank of Philadelphia on Thursday. The Philly Fed said its current general activity index slumped to a negative 9.9 in September from a positive 6.2 in August, with a negative reading indicating a contraction in regional manufacturing activity. Economists had expected the Philly Fed index to drop to a positive 2.8. Looking ahead, the Philly Fed said expectations for growth over the next six months were subdued, as the future general activity index improved but remained negative. |
No 9 |
-9.9 |
|
Sep-2022 |
|
| |
|
|
|
Philadelphia Fed manufacturing index unexpectedly rises in August. gauge of factory activity in the U.S. Mid-Atlantic region unexpectedly accelerated in August to the briskest pace since April and firms reported input price pressures eased to the lowest since late 2020. The Philadelphia Federal Reserve's monthly manufacturing index rose to 6.2 this month from negative 12.3 in July, topping all 30 estimates in a poll of Reuters economists, which had a median prediction for a reading of minus 5.0. While improved from July's reading, which had been the lowest since May 2020, the rebound indicated only modest growth in the current pace of output and new orders declined for a third straight month. Moreover, firms on balance remained pessimistic about the near-term outlook. The Philadelphia Federal Reserve nonmanufacturing survey showed activity expanded in the region this month. However, expectations for future growth declined, the Philadelphia Fed said. |
No 8 |
6.2 |
|
Aug-2022 |
|
| |
|
|
|
The Philadelphia Fed manufacturing index fell to a reading of -12.3, a 9-point slide from a month ago and a considerably worse level than the 1.6 Dow Jones estimate. The number represents the percentage difference between companies reporting expansion in activity against those seeing contraction. In particular, the employment index was 19.4, also a 9-point decline. Though that indicates continued expansion in hiring, it is the lowest reading since May 2021 and also is indicative that hiring is slowing. The average workweek reading was 6.4, falling for the fourth consecutive month and an indication that productivity could be declining. |
No 7 |
-12.3 |
|
Jul-2022 |
|
| |
|
|
|
Philadelphia Fed manufacturing index goes negative for first time in 2 years. Manufacturing activity in the U.S. mid-Atlantic region weakened unexpectedly in June as new orders dropped to a two-year low and goods producers' near-term outlook sank to the lowest since 2008, a closely followed survey showed on Thursday. The Philadelphia Federal Reserve's manufacturing activity index slid for a third straight month to a reading of minus 3.3, its first negative reading since May 2020 in the early months of the coronavirus pandemic. That is down from positive 2.6 in May. The median expectation among economists polled by Reuters was for a reading of 5.5. The bank's new orders index contracted to negative 12.4 in June from positive 22.1 a month earlier. The outlook for the next six months - at negative 6.8 - was the lowest since February 2008. |
No 6 |
-3.3 |
|
Jun-2022 |
|
| |
|
|
|
Philadelphia Fed Manufacturing Index falls to 2.6 in May 2022 vs. 16.0 expected. The Philly Fed manufacturing index came in well weaker than expected at 2.6 in May 2022. According to a report from the Federal Reserve Bank of Philadelphia released on Thursday, the headline Manufacturing Activity Index of the Manufacturing Business Outlook Survey slid to 2.6 in May from 17.6 in March. That was well below the expected decline to 16.0 and was the lowest reading since May 2020. |
No 5 |
2.6 |
|
May-2022 |
|
| |
|
|
|
Manufacturing activity in the Philadelphia area increased less than expected in April 2022. An economic report Thursday showed that manufacturing expanded in the Philadelphia area in April 2022, but at a slower pace than expected. The Philadelphia Federal Reserve’s monthly manufacturing index registered a 17.6 reading, representing the difference between companies seeing expansion versus contraction. That was a decline of nearly 10 points from March and below the Dow Jones estimate of 21.9. Measures of new orders, shipments, unfilled orders, delivery times and the average employee workweek showed declines from March. However, prices paid and prices received both increased, reflecting continued inflation pressures, while the number of employees index also gained. |
No 4 |
17.6 |
|
Apr-2022 |
|
| |
|
|
|
The Philadelphia Fed said Thursday its gauge of regional business activity rose to 27.4 in March 2022 from 16 in the prior month.Economists polled by the Wall Street Journal expected a 15 reading. Any reading above zero indicates improving conditions. The barometer on new orders increased to 25.8 from 14.2 in the prior month. The shipments index rose to 30.2 from 13.4. Both price gauges increased in the month.The data was much stronger than expected. Analysts had tempered their optimism about manufacturing after a similar Empire State survey released Tuesday by the New York Fed showed manufacturing activity declined, with the business conditions index falling 14.9 points to negative 11.8 in March. The decline was blamed on the spike in oil prices following the invasion of Ukraine by Russia. Manufacturing has been a bright spot during the pandemic. In February, the national ISM manufacturing index rose to 58.6 from 57.6 in the prior month. It has been in positive territory for 21 straight months. |
No 3 |
27.4 |
|
Mar-2022 |
|
| |
|
|
|
The Philadelphia Federal Reserve said Thursday its gauge of regional business activity fell to 16 from 23.2 in February 2022. Any reading above zero indicates improving conditions. Economists polled by the Wall Street Journal expected a 19 reading. Any reading above zero indicates expansion in the manufacturing sector. The headline index is based on a single stand-alone question about business conditions unlike the national ISM manufacturing index which is a composite based on components. |
No 2 |
16.0 |
|
Feb-2022 |
|
| |
|
|
|
The headline Philly Fed manufacturing index rose to 23.2, above the expected 20.0 in January 2022. According to a report from the Federal Reserve Bank of Philadelphia released on Thursday, the headline Manufacturing Activity Index of the Manufacturing Business Outlook Survey rose to 23.2 in January from 20.0 in December. That was bigger than the expected rise to 20.0. |
No 1 |
23.2 |
|
Jan-2022 |
|
| |
|
|
|
|
|
|
|
|
| |
|
|
|
|
|
| |
|
|
|
|
|
|
|
|
|
|
|
|
|
|
|
Brief News | 2021 |
|
|
Philadelphia Fed Mfg Index | Manufacturing |
|
Today's Week |
|
|
|
|
|
|
|
|
|
|
|
|
|
Philadelphia Fed Manufacturing index (At 8:30 a.m ET)
| DATE/WEEK |
HIGHLIGHTS |
FOR |
ACTUAL |
|
Philly Fed manufacturing index slides in December 2021 amid elevated inflation. The numbers: The Federal Reserve Bank of Philadelphia said Thursday that is gauge of regional business activity fell to 15.4 in December from 39.0 in the previous month. Any reading above zero indicates improving conditions. Economists expected a 30.0 reading, according to a Wall Street Journal poll.The headline index is based on a single stand-alone question about business conditions unlike the national ISM manufacturing index which is a composite based on components.The gauge of new orders fell 33.7 points to 13.7, while the shipments index fell 16.8 points to 15.3 in December. Unfilled orders retreated 16 points in December to 11.4 from the previous month. The reading of the six-month business outlook declined 9.5 points to 19 from November’s reading of 28.5. The index of the number of employees edged up to 33.9 from 27.2 last month, the regional bank said.The prices-paid index fell to 66.1 from November’s reading of 80, while the prices-received index moved to 50.4 from November’s reading of 62.9. The manufacturing sector remains strong despite the headwind of rising input costs. Prices for wholesale goods are likely rising at their fastest pace in 40 years, though companies have so far been able to pass those higher costs on to consumers, while the Philly Fed index suggests that these pressures could be easing somewhat. |
No 12 |
15.4 |
|
Dec-2021 |
|
| |
|
|
|
A report released by the Federal Reserve Bank of Philadelphia on Thursday showed a significant acceleration in the pace of growth in regional manufacturing activity in the month of November 2021. The Philly Fed said its diffusion index for current activity jumped to 39.0 in November from 23.8 in October, with a positive reading indicating growth. Economists had expected the index to inch up to 24.0. The much bigger than expected increase by the headline index was partly due to a substantial acceleration in the pace of growth in new orders, as the new orders index spiked to 47.4 in November from 30.8 in October. The shipments index also crept up 32.1 in November from 30.0 in October, although the number of employees index slipped to 27.2 from 30.7. |
No 11 |
39.0 |
|
Nov-2021 |
|
| |
|
|
|
The Philadelphia Fed mentioned Thursday its gauge of regional enterprise exercise fell to 23.8 in October 2021 from 30.7 within the prior month. Any studying above zero signifies bettering situations. The index had jumped sharply in September and a pullback was anticipated. Economists polled by the Wall Road Journal anticipated a 24.5 studying. Any studying above zero signifies enlargement within the manufacturing sector. A studying of 23.8 remains to be in stable development territory, economists mentioned. Manufacturing is a vivid spot within the economic system at the same time as companies wrestle to fulfill demand attributable to sudden bottlenecks. The headline index is predicated on a single stand-alone query about enterprise situations not like the nationwide ISM manufacturing index which is a composite primarily based on elements The barometer on new orders jumped 14.9 factors to 30.8. The shipments index inched up 1 level to 30. The measure on six-month enterprise outlook rose x4.2 factors to 24.2. Unfilled orders rose in October and supply occasions lengthened. Inventories slipped a bit. Costs paid rose 3 factors to 70 in October whereas the costs obtained index fell 1.8 factors. The staff index rose within the month. |
No 10 |
23.8 |
|
Oct-2021 |
|
| |
|
|
|
Philadelphia Fed Manufacturing Index jumps to 30.7 in September 2021 vs. 18.8 expected. Philly Fed Manufacturing Index improved decisively in September. US Dollar Index continues to push higher toward 93.00. The Federal Reserve Bank of Philadelphia reported on Thursday that the headline Manufacturing Activity Index of the Manufacturing Business Outlook Survey improved to 30.7 in September from 19.4 in August. This reading came in stronger than the market expectation of 18.8. Further details of the publication revealed that the New Orders Index declined to 15.9 from 22.8, the Employment Index edged lower to 26.3 from 32.6 and the Prices Paid Index fell to 67.3 from 71.2. Finally, the Six-month Business Conditions Index dropped to 20 from 33.7. |
No 9 |
30.7 |
|
Sep-2021 |
|
| |
|
|
|
Growth in factory activity in the U.S. mid-Atlantic region slowed for the fourth consecutive month in August 2021 after hitting its highest pace in nearly half a century earlier this spring, a survey showed on Thursday. The Philadelphia Federal Reserve Bank said its business activity index fell to 19.4, the lowest since December, from 21.9 in July. That was below economists' expectations for a reading of 23.0, according to a Reuters poll. Any reading above zero indicates expansion in the region's manufacturing. The survey covers factories in eastern Pennsylvania, southern New Jersey and Delaware. It is seen as one of the first monthly indicators of the health of U.S. manufacturing leading up to the national report by the Institute for Supply Management, next due out September 1. Supply constraints have continued to slow manufacturing activity nationwide, indicating that the economics recovery might be slowing down in a year in which growth is projected to accelerate at its fastest pace in nearly four decades. In March, the Philly Fed's factory activity gauge hit its highest level since 1973. |
No 8 |
19.4 |
|
Aug-2021 |
|
| |
|
|
|
Factory activity in the U.S. mid-Atlantic region slowed sharply for the third consecutive month to its lowest growth since December after hitting its highest pace in nearly half a century earlier this spring, a survey showed on Thursday. The Philadelphia Federal Reserve Bank said its business activity index fell to 21.9 Kuly 2021 from 30.7 in June 2021. That was well below economists' expectations for a reading of 28.0, according to a Reuters poll.The Philadelphia region said Thursday that progress was slowing. That area’s manufacturing reading slipped to 21.9 in July 2021 from 30.7 the previous month, though the headline number still indicated expansion. Both reports also indicated some deceleration in the rate of price increases amid otherwise high inflation readings. |
No 7 |
21.9 |
|
Jul-2021 |
|
| |
|
|
|
Factory activity in the U.S. mid-Atlantic region declined for the second consecutive month in June 2021 after hitting its highest pace in nearly half a century earlier this spring, a survey showed on Thursday. The Philadelphia Federal Reserve Bank said its business activity index fell to 30.7 from 31.5 in May. That was just shy of economists' expectations for a reading of 31.0, according to a Reuters poll. Any reading above zero indicates expansion in the region's manufacturing. The survey covers factories in eastern Pennsylvania, southern New Jersey and Delaware.It is seen as one of the first monthly indicators of the health of U.S. manufacturing leading up to the national report by the Institute for Supply Management, next due out July 1. |
No 6 |
30.7 |
|
Jun-2021 |
|
| |
|
|
|
Philly Fed factory index falls more quickly than expected in May 2021. Manufacturing activity in the US mid-Atlantic region cooled more quickly than anticipated in May as supply bottlenecks continued to worsen, the results of a closely-followed survey revealed. Price pressures also continued to mount. The Federal Reserve Bank of Philadelphia's factory index dropped from a reading of 50.2 for April to 31.5 in May 2021 (consensus: 43.2). A key gauge tracking new orders was little changed, slipping from 36.0 to a still elevated 32.5. But that linked to firms' delivery times worsened sharply, rising from 27.8 to 41.5. The sub-index for prices paid meanwhile increased from 69.1 to 76.8. Employment also weakened, with the corresponding subindex slipping from 30.8 to 19.3. Americans' workweek also continued to lengthen as revealed by a rise in the corresponding subindex from 29.8 to 35.5. A subindex for inventory levels rose from 17.3 to 25.6. |
No 5 |
31.5 |
|
May-2021 |
|
| |
|
|
|
Philly Fed Manufacturing Index rose sharply in April 2021. US Dollar Index inches higher toward 91.70 after the data. The Federal Reserve Bank of Philadelphia reported on Thursday that the headline Manufacturing Activity Index of the Manufacturing Business Outlook Survey imorıoved to 50.2 in April from 44.5 in March. This reading beat the market expectation of 42 by a wide margin. Further details of the publication showed that the Prices Paid Index edged lower to 69.1 from 72.6, the Employment Index rose to 30.8 from 27.4 and the Six-month Business Conditions Index climbed to 66.6 from 59.1. |
No 4 |
50.2 |
|
Apr-2021 |
|
| |
|
|
|
Regional factory activity recently jumped to the highest level in nearly 50 years, the Federal Reserve Bank of Philadelphia said Thursday. The Philly Fed’s manufacturing activity index soared to 51.8 in March 2021 from 23.1 in the prior month. That’s the best since 1973. Economists had forecast that the gauge would remain more or less flat for the month. “Nearly 59 percent of the firms reported increases in current activity this month (up from 35 percent last month), while only 7 percent reported decreases (down from 11 percent),” the Philly Fed said. The report covers the Philadelphia Fed’s home territory of over 13.3 million people in Delaware, southern New Jersey, and eastern and central Pennsylvania. The new orders measure skyrocketed to 50.9 in March, also a 50 year high, from 23.4 in the prior month. The shipments index moved to 30.2 from 21.5 in February. |
No 3 |
51.8 |
|
Mar-2021 |
|
| |
|
|
|
Momentum in the U.S. manufacturing sector remains steady as the Philadelphia region saw resilient activity in February 2021, according to the latest report from the Philadelphia Federal Reserve. Thursday, the regional central bank said its manufacturing business outlook fell to a reading of 23.1 in February, down from the January reading of 26.5. However, data beat expectations as consensus forecasts were calling for a reading around 20.3. "Responses to the February Manufacturing Business Outlook Survey suggest continued expansion for the region's manufacturing sector. The indicators for current activity, new orders, and shipments fell slightly from last month but remained elevated," the report said. The gold market is seeing little reaction to the better-than-expected Philly Fed data. April gold futures last traded at $1,781.0 an ounce, up nearly 0.5% on the day. |
No 2 |
23.1 |
|
Feb-2021 |
|
| |
|
|
|
In January 2021, the Philly Fed Manufacturing Business Outlook Survey indicated manufacturing activity in the region continued to grow, with the current indicator for general activity rising 17.4 points to a solid 26.5. The survey’s current indicators for new orders and shipments increased notably this month and remained positive for the eighth consecutive month. The survey’s future indexes remained at high readings (up 9.7 points to 52.8) and continue to indicate that firms expect growth over the next six months. |
No 1 |
26.5 |
|
Jan-2021 |
|
| |
|
|
|
|
|
|
|
|
| |
|
|
|
|
|
|
| |
|
|
|
|
|
|
|
|
|
|
|
|
|
|
|
|
|
|
|
|
|
Definitions | Explain |
|
|
Philadelphia Mfg Index | Manufacturing |
|
Today's Week |
|
|
|
|
|
|
|
|
|
|
|
|
| |
|
|
|
|
| |
|
| How the "Philadelphia Fed Survey" Affects You? |
The Philly Fed Index, also known as "The general business conditions index", is a good leading indicator for the index of industrial production. It is reported in the third week of the month and thus has a lead time of nearly three weeks.
The Philly Fed Index gauges changes in business growth in the third district including Pennsylvania, New Jersey and Delaware. The index above 0 indicates factory-sector growth while below 0 indicates contraction.
The Philadelphia Federal Reserve Bank has a business activity index that covers factories in eastern Pennsylvania, southern New Jersey and Delaware.
Any reading above zero indicates expansion in the region's manufacturing. Readings under zero denote contraction.
The Philly Fed Index and the Empire State Index are diffusion indexes, which means they subtract the percentage of people reporting a drop in activity from those who report an increase. |
|
|
| |
|
|
|
|
|
|
|
|
|
|
|
|
|
|
|
|
|
|
|
|
|
Data | Source |
|
|
Philadelphia Fed Mfg Index | Manufacturing |
|
Today's Week |
|
|
|
|
|
|
|
|
|
|
|
|
| |
|
|
|
|
|
|
| DATA INFORMATION |
PHILADELPHIA FED MFG INDEX |
| SOURCE |
Institute for Supply Management. |
| WEB |
www.hts.com |
| FREQUENCY |
Monthly |
| AVAILABILITY |
The first business day of the month. |
| COVERAGE |
Data are for the previous month. Data for June are released in July. |
| REVISIONS |
Yes |
| IMPORTANCE |
Manufacturing - Very Important |
|
| |
|
|
|
|
|
|
|
|
|
|
|
|