|
 |
|
 |
Chicago PMI | Manufacturing |
|
 |
|
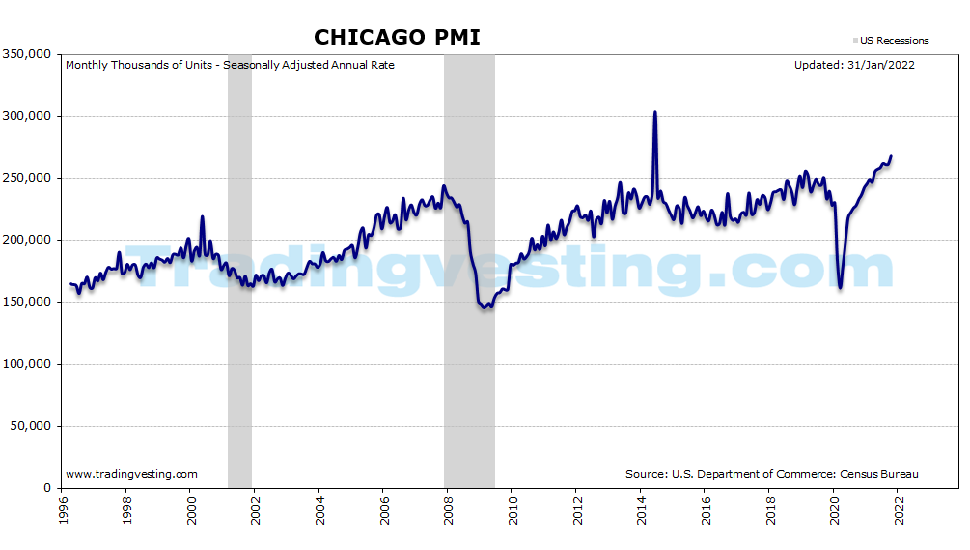
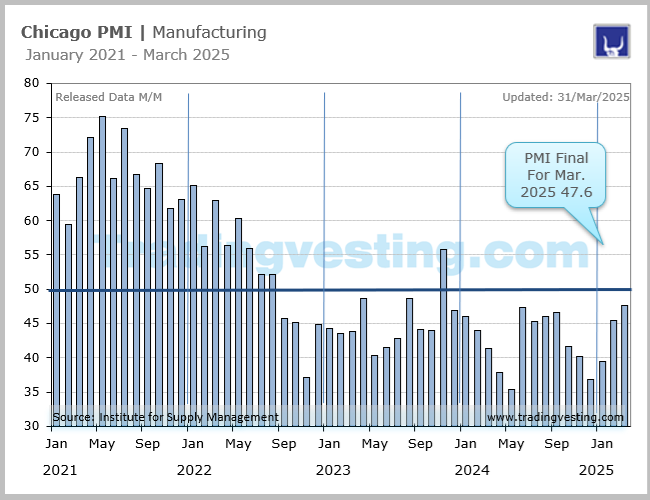
The Chicago PMI, or Chicago Purchasing Managers' Index, is a key economic indicator that measures the level of activity in the manufacturing and non-manufacturing sectors in the Chicago area.. Read More...
|
|
|
|
|
|
|
| |
|
| |
 8. Chicago PMI (8 of 9)
 9. Philadelphia Mfg Index (9 of 9)
 1. ISM Manufacturing Index (1 of 9)
 2. Industrial Production (2 of 9)
 3. Durable Goods Orders (3 of 9)
 4. Factory Orders (4 of 9)
 5. Empire State Mafg Index (5 of 9)
 6. PMI Mfg Final (6 of 9)
 7. PMI Composite Flash (7 of 9)
|
 |
|
|
|
|
| |
|
→ Big Chart |
|
→ Release |
|
| |
|
|
|
|
|
|
|
|
|
|
|
|
|
|
|
|
|
|
|
 |
|
Big Chart | Large Data |
 |
|
Chicago PMI | Manufacturing |
|
Today's Week |
 |
|
|
|
|
|
|
|
|
|
|
|
|
|
| |
|
|
|
|
|
|
|
|
|
|
|
|
|
| |
|
|
|
|
|
|
|
|
|
|
|
|
|
|
|
|
|
|
|
|
|
Release Schedule | 2026 |
|
|
Chicago PMI | Manufacturing |
|
Today's Week |
|
|
|
|
|
|
|
|
|
|
|
|
|
Chicago PMI (At 9:45 a.m ET)
| SCHEDULE 2026 |
No 1 |
No 2 |
No 3 |
No 4 |
No 5 |
No 6 |
No 7 |
No 8 |
No 9 |
No 10 |
No 11 |
No 12 |
| Release | Week |
|
|
|
|
|
|
|
|
|
|
|
|
| Release | Date |
|
|
|
|
|
|
|
|
|
|
|
|
| Release | Day |
|
|
|
|
|
|
|
|
|
|
|
|
 |
|
|
|
|
|
|
|
|
|
|
|
|
| Prior |
43.5 |
54.0 |
57.7 |
... |
... |
... |
... |
... |
... |
... |
... |
... |
| Prior Revised |
42.7 |
... |
... |
... |
... |
... |
... |
... |
... |
... |
... |
... |
| CONSENSUS |
43.8 |
52.5 |
54.0 |
... |
... |
... |
... |
... |
... |
... |
... |
... |
| Consensus Low |
40.0 |
51.0 |
52.0 |
... |
... |
... |
... |
... |
... |
... |
... |
... |
| Consensus High |
.45.0 |
52.6 |
55.1 |
... |
... |
... |
... |
... |
... |
... |
... |
... |
| CHICAGO PMI |
54.0 |
57.7 |
52.8 |
... |
... |
... |
... |
... |
... |
... |
... |
... |
| RATING |
|
|
|
|
|
|
|
|
|
|
|
|
| Month For |
Jan-26 |
Feb-26 |
Mar-26 |
Apr-26 |
May-26 |
Jun-26 |
Jul-26 |
Aug-26 |
Sep-26 |
Oct-26 |
Nov-26 |
Dec-26 |
|
|
|
|
|
|
|
|
|
|
|
|
|
|
|
| |
|
| |
|
|
|
|
|
|
|
|
|
|
|
Release Schedule | 2025 |
|
|
Chicago PMI | Manufacturing |
|
Today's Week |
|
|
|
|
|
|
|
|
|
|
|
|
|
Chicago PMI (At 9:45 a.m ET)
| SCHEDULE 2025 |
No 1 |
No 2 |
No 3 |
No 4 |
No 5 |
No 6 |
No 7 |
No 8 |
No 9 |
No 10 |
No 11 |
No 12 |
| Release | Week |
|
|
|
|
|
|
|
|
|
|
|
|
| Release | Date |
|
|
|
|
|
|
|
|
|
|
|
|
| Release | Day |
|
|
|
|
|
|
|
|
|
|
|
|
|
|
|
|
|
|
|
|
|
|
|
|
|
| Prior |
36.9 |
39.5 |
45.5 |
47.6 |
44.6 |
40.5 |
44.0 |
47.1 |
41.5 |
40.6 |
43.8 |
36.3 |
| Prior Revised |
... |
... |
... |
... |
... |
... |
... |
... |
... |
... |
... |
... |
| CONSENSUS |
40.0 |
41.0 |
44.1 |
45.8 |
45.0 |
43.0 |
42.0 |
45.2 |
43.5 |
42.0 |
44.3 |
39.5 |
| Consensus Low |
37.2 |
38.0 |
43.0 |
45.4 |
43.0 |
41.6 |
40.6 |
45.0 |
41.0 |
41.5 |
42.8 |
37.8 |
| Consensus High |
41.0 |
42.0 |
45.5 |
46.5 |
46.0 |
46.3 |
43.5 |
48.3 |
45.0 |
45.0 |
46.0 |
41.0 |
| CHICAGO PMI |
39.5 |
45.5 |
47.6 |
44.6 |
40.5 |
44.0 |
47.1 |
41.5 |
40.6 |
43.8 |
36.3 |
43.5 |
| RATING |
|
|
|
|
|
|
|
|
|
|
|
|
| Month For |
Jan-25 |
Feb-25 |
Mar-25 |
Apr-25 |
May-25 |
Jun-25 |
Jul-25 |
Aug-25 |
Sep-25 |
Oct-25 |
Nov-25 |
Dec-25 |
|
|
|
|
|
|
|
|
|
|
|
|
|
|
|
| |
|
| |
|
|
|
|
|
|
|
|
|
|
|
Release Schedule | 2024 |
|
|
Chicago PMI | Manufacturing |
|
Today's Week |
|
|
|
|
|
|
|
|
|
|
|
|
|
Chicago PMI (At 9:45 a.m ET)
| SCHEDULE 2024 |
No 1 |
No 2 |
No 3 |
No 4 |
No 5 |
No 6 |
No 7 |
No 8 |
No 9 |
No 10 |
No 11 |
No 12 |
| Release | Week |
|
|
|
|
|
|
|
|
|
|
|
|
| Release | Date |
|
|
|
|
|
|
|
|
|
|
|
|
| Release | Day |
|
|
|
|
|
|
|
|
|
|
|
|
|
|
|
|
|
|
|
|
|
|
|
|
|
| Prior |
46.9 |
46.0 |
44.0 |
41.4 |
37.9 |
35.4 |
47.4 |
45.3 |
46.1 |
46.1 |
41.6 |
40.2 |
| Prior Revised |
... |
... |
... |
... |
... |
... |
... |
... |
... |
... |
... |
... |
| CONSENSUS |
48.1 |
47.3 |
46.0 |
45.0 |
40.8 |
40.0 |
44.3 |
46.4 |
46.0 |
47.3 |
44.2 |
42.7 |
| Consensus Low |
47.0 |
46.6 |
44.9 |
43.2 |
38.3 |
35.4 |
41.4 |
45.6 |
45.0 |
46.1 |
43.0 |
41.9 |
| Consensus High |
49.4 |
49.0 |
48.0 |
47.0 |
44.1 |
42.0 |
47.8 |
47.5 |
46.8 |
47.5 |
47.5 |
43.0 |
| CHICAGO PMI |
46.0 |
44.0 |
41.4 |
37.9 |
35.4 |
47.4 |
45.3 |
46.1 |
46.6 |
41.6 |
40.2 |
36.9 |
| RATING |
|
|
|
|
|
|
|
|
|
|
|
|
| Month For |
Jan-24 |
Feb-24 |
Mar-24 |
Apr-24 |
May-24 |
Jun-24 |
Jul-24 |
Aug-24 |
Sep-24 |
Oct-24 |
Nov-24 |
Dec-24 |
|
|
|
|
|
|
|
|
|
|
|
|
|
|
|
| |
|
| |
|
|
|
|
|
|
|
|
|
|
|
Release Schedule | 2023 |
|
|
Chicago PMI | Manufacturing |
|
Today's Week |
|
|
|
|
|
|
|
|
|
|
|
|
|
Chicago PMI (At 9:45 a.m ET)
| SCHEDULE 2023 |
No 1 |
No 2 |
No 3 |
No 4 |
No 5 |
No 6 |
No 7 |
No 8 |
No 9 |
No 10 |
No 11 |
No 12 |
| Release | Week |
|
|
|
|
|
|
|
|
|
|
|
|
| Release | Date |
|
|
|
|
|
|
|
|
|
|
|
|
| Release | Day |
|
|
|
|
|
|
|
|
|
|
|
|
|
|
|
|
|
|
|
|
|
|
|
|
|
| Prior |
44.9 |
44.3 |
43.6 |
43.8 |
48.6 |
40.4 |
41.5 |
42.8 |
48.7 |
44.1 |
44.0 |
55.8 |
| Prior Revised |
No |
No |
No |
No |
No |
No |
No |
No |
No |
No |
No |
No |
| CONSENSUS |
45.1 |
45.0 |
43.9 |
43.5 |
47.0 |
44.2 |
43.5 |
44.6 |
47.9 |
45.0 |
45.1 |
50.0 |
| Consensus Low |
42.4 |
43.3 |
42.0 |
43.3 |
44.5 |
43.0 |
41.4 |
42.7 |
47.0 |
44.6 |
43.6 |
49.4 |
| Consensus High |
46.0 |
47.0 |
44.0 |
46.0 |
47.5 |
45.0 |
45.8 |
45.0 |
49.0 |
46.4 |
46.0 |
53.0 |
| CHICAGO PMI |
44.3 |
43.6 |
43.8 |
48.6 |
40.4 |
41.5 |
42.8 |
48.7 |
44.1 |
44.0 |
55.8 |
46.9 |
| RATING |
|
|
|
|
|
|
|
|
|
|
|
|
| Month For |
Jan-23 |
Feb-23 |
Mar-23 |
Apr-23 |
May-23 |
Jun-23 |
Jul-23 |
Aug-23 |
Sep-23 |
Oct-23 |
Nov-23 |
Dec-23 |
|
|
|
|
|
|
|
|
|
|
|
|
|
|
|
| |
|
| |
|
|
|
|
|
|
|
|
|
|
|
Release Schedule | 2022 |
|
|
Chicago PMI | Manufacturing |
|
Today's Week |
|
|
|
|
|
|
|
|
|
|
|
|
|
Chicago PMI (At 9:45 a.m ET)
| SCHEDULE 2022 |
No 1 |
No 2 |
No 3 |
No 4 |
No 5 |
No 6 |
No 7 |
No 8 |
No 9 |
No 10 |
No 11 |
No 12 |
| Release | Week |
|
|
|
|
|
|
|
|
|
|
|
|
| Release | Date |
|
|
|
|
|
|
|
|
|
|
|
|
| Release | Day |
|
|
|
|
|
|
|
|
|
|
|
|
|
|
|
|
|
|
|
|
|
|
|
|
|
| Prior |
63.1 |
65.2 |
56.3 |
62.9 |
56.4 |
60.3 |
56.0 |
52.1 |
52.2 |
45.7 |
45.2 |
37.2 |
| Prior Revised |
64.3 |
No |
No |
No |
No |
No |
No |
No |
No |
No |
No |
No |
| CONSENSUS |
61.7 |
No |
56.9 |
59.7 |
55.8 |
58.1 |
55.4 |
52.1 |
52.0 |
47.0 |
47.1 |
44.0 |
| Consensus Low |
No |
No |
No |
No |
No |
No |
No |
No |
No |
No |
No |
No |
| Consensus High |
No |
No |
No |
No |
No |
No |
No |
No |
No |
No |
No |
No |
| CHICAGO PMI |
65.2 |
56.3 |
62.9 |
56.4 |
60.3 |
56.0 |
52.1 |
52.2 |
45.7 |
45.2 |
37.2 |
44.9 |
| RATING |
|
|
|
|
|
|
|
|
|
|
|
|
| Month For |
Jan-22 |
Feb-22 |
Mar-22 |
Apr-22 |
May-22 |
Jun-22 |
Jul-22 |
Aug-22 |
Sep-22 |
Oct-22 |
Nov-22 |
Dec-22 |
|
|
|
|
|
|
|
|
|
|
|
|
|
|
|
| |
|
| |
|
|
|
|
|
|
|
|
|
|
|
Release Schedule | 2021 |
|
|
Chicago PMI | Manufacturing |
|
Today's Week |
|
|
|
|
|
|
|
|
|
|
|
|
|
Chicago PMI (At 9:45 a.m ET)
| SCHEDULE 2021 |
No 1 |
No 2 |
No 3 |
No 4 |
No 5 |
No 6 |
No 7 |
No 8 |
No 9 |
No 10 |
No 11 |
No 12 |
| Release | Week |
|
|
|
|
|
|
|
|
|
|
|
|
| Release | Date |
|
|
|
|
|
|
|
|
|
|
|
|
| Release | Day |
|
|
|
|
|
|
|
|
|
|
|
|
|
|
|
|
|
|
|
|
|
|
|
|
|
| Prior |
No |
63.8 |
59.5 |
66.3 |
72.1 |
75.2 |
66.1 |
73.4 |
66.8 |
64.7 |
68.4 |
61.8 |
| Prior Revised |
No |
No |
No |
No |
No |
No |
No |
No |
No |
No |
No |
No |
| CONSENSUS |
58.3 |
61.1 |
60.1 |
65.5 |
68.0 |
No |
64.6 |
68.0 |
70.3 |
65.9 |
66.8 |
62.0 |
| Consensus Low |
No |
No |
No |
No |
No |
No |
No |
No |
No |
No |
No |
No |
| Consensus High |
No |
No |
No |
No |
No |
No |
No |
No |
No |
No |
No |
No |
| CHICAGO PMI |
63.8 |
59.5 |
66.3 |
72.1 |
75.2 |
66.1 |
73.4 |
66.8 |
64.7 |
68.4 |
61.8 |
63.1 |
| RATING |
|
|
|
|
|
|
|
|
|
|
|
|
| Month For |
Jan-21 |
Feb-21 |
Mar-21 |
Apr-21 |
May-21 |
Jun-21 |
Jul-21 |
Aug-21 |
Sep-21 |
Oct-21 |
Nov-21 |
Dec-21 |
|
|
|
|
|
|
|
|
|
|
|
|
|
|
|
| |
|
|
| |
|
|
|
|
|
|
|
|
|
|
|
|
Chicago PMI | Manufacturing (9:45 a.m ET)
| DATE/WEEK |
HIGHLIGHTS |
FOR |
ACTUAL |
|
Chicago PMI |
No 12 |
... |
|
Dec-2025 |
|
| |
|
|
|
Chicago PMI |
No 11 |
... |
|
Nov-2025 |
|
| |
|
|
|
Chicago PMI |
No 10 |
... |
|
Oct-2025 |
|
| |
|
|
|
Chicago PMI |
No 9 |
... |
|
Sep-2025 |
|
| |
|
|
|
Chicago PMI |
No 8 |
... |
|
Aug 2025 |
|
| |
|
|
|
Chicago PMI |
No 7 |
... |
|
Jul-2025 |
|
| |
|
|
|
Chicago PMI |
No 6 |
... |
|
Jun-2025 |
|
| |
|
|
|
Chicago PMI |
No 5 |
... |
|
May-2025 |
|
| |
|
|
|
Chicago PMI |
No 4 |
... |
|
Apr-2025 |
|
| |
|
|
|
Chiago PMI |
No 3 |
... |
|
Mar-2025 |
|
| |
|
|
|
Chicago PMI |
No 2 |
... |
|
Feb-2025 |
|
| |
|
|
|
Chiago PMI |
No 1 |
54.0 |
|
Jan-2025 |
|
| |
|
|
|
|
|
|
|
|
| |
|
|
|
|
|
| |
|
|
|
|
|
|
Chicago PMI | Manufacturing (9:45 a.m ET)
| DATE/WEEK |
HIGHLIGHTS |
FOR |
ACTUAL |
|
The Chicago Purchasing Managers' Index (PMI) for December 2025 rose to 43.5, indicating a rebound from November's low of 36.3, but still reflecting ongoing contraction in the manufacturing sector. The Chicago PMI increased by 7.2 points from November, surpassing market expectations of 39.5. However, it marks the 25th consecutive month that the index has remained below the neutral level of 50, which indicates contraction in manufacturing activity. |
No 12 |
43.5 |
|
Dec-2025 |
|
| |
|
|
|
The Chicago Purchasing Managers' Index (PMI) for November 2025 fell sharply to 36.3, indicating a significant contraction in economic activity in the region. Current PMI Value: The Chicago PMI dropped to 36.3 in November 2025, down from 43.8 in October. This marks the 24th consecutive month that the index has remained below the neutral threshold of 50, which separates expansion from contraction. |
No 11 |
36.3 |
|
Nov-2025 |
|
| |
|
|
|
The Chicago Purchasing Managers' Index (PMI) for October 2025 rose to 43.8, indicating a rebound in new orders and improvements in output and order backlogs. This marks the 23rd consecutive month below the neutral threshold of 50, suggesting a soft contraction in business activity. The PMI reflects a slight improvement in the business environment, although employment growth reached its lowest since February. |
No 10 |
43.8 |
|
Oct-2025 |
|
| |
|
|
|
The Chicago Purchasing Managers’ Index (PMI), a key indicator of the economic health of the manufacturing sector in the Chicago region, has reported a lower than expected reading. The actual figure came in at 40.6, falling short of the forecasted 43.4. The Chicago PMI is a significant economic indicator, with a reading above 50 signaling an expansion of the manufacturing sector, and a reading below 50 indicating contraction. The latest reading of 40.6, therefore, suggests a contraction in the manufacturing sector in the Chicago region. |
No 9 |
40.6 |
|
Sep-2025 |
|
| |
|
|
|
The Chicago PMI (Purchasing Managers Index) reported by ISM-Chicago, Inc showed a significant decrease to 41.5 in August 2025, largely reversing the rebound seen in July and marking 21 consecutive months of contraction below the 50-point threshold. This decline was driven by significant drops in new orders, employment, and production, with a particular focus on input cost clarity regarding tariff policy uncertainty. |
No 8 |
41.5 |
|
Aug 2025 |
|
| |
|
|
|
The July 2025 Chicago PMI was 47.1, a significant increase from the prior month but still indicating a contraction in the manufacturing sector. The reading was the best since March 2025, suggesting some improvement in conditions, though it marked the 20th consecutive month of contraction and was below the 50 no-change point. The ISM's manufacturing report for July showed similar trends, with production increasing but new orders and employment continuing to contract. |
No 7 |
47.1 |
|
Jul-2025 |
|
| |
|
|
|
The June 2025 Chicago PMI declined to 40.4, falling below expectations and marking the 19th consecutive month of contraction in the Chicago-area manufacturing sector. The drop was due to lower readings in supplier deliveries, production, employment, and order backlogs, which hit a low point not seen since May 2020. This continued contraction, below the 50-point threshold indicating contraction, is largely attributed to instability caused by ongoing uncertainty surrounding tariffs. |
No 6 |
44.0 |
|
Jun-2025 |
|
| |
|
|
|
The Chicago PMI fell to 40.5 in May 2025, indicating a significant contraction in the manufacturing sector and missing analyst expectations. This marked the 18th consecutive month below the 50-point expansion threshold and was driven by declines in new orders, order backlogs, and production. While employment and supplier deliveries improved, the overall picture showed continued economic weakness, with the May reading being the lowest since January. |
No 5 |
40.5 |
|
May-2025 |
|
| |
|
|
|
The April 2025 Chicago PMI was 44.6, indicating a faster rate of contraction in the region's manufacturing sector compared to the prior month. This was below market expectations of 45.5 and marked the 20th consecutive month of contraction for the index, which falls below the 50.0 threshold that signals expansion. |
No 4 |
44.6 |
|
Apr-2025 |
|
| |
|
|
|
The Chicago PMI rose to 47.6 in March 2025, a significant improvement from the previous month's 45.5 and better than market expectations. Although the index remains below 50, which indicates a contraction in economic activity, the March reading signaled a slower pace of downturn and was the highest level recorded since November 2023. This improvement was driven by increased production, with smaller gains in new orders and employment, though supplier deliveries declined. |
No 3 |
47.6 |
|
Mar-2025 |
|
| |
|
|
|
Chicago PMI shows unexpected rise, signaling manufacturing sector expansion. The Chicago Purchasing Managers’ Index (PMI), a key indicator of the economic health of the manufacturing sector in the Chicago region, has posted an unexpected rise. The actual figure, released recently, stands at 45.5, significantly higher than the forecasted 40.5. This unexpected rise in the Chicago PMI not only surpassed the forecasted figure but also exceeded the previous reading of 39.5. This indicates a stronger than anticipated expansion in the manufacturing sector in the Chicago region.. |
No 2 |
45.5 |
|
Feb-2025 |
|
| |
|
|
|
Chicago PMI shows slight recovery, still below forecast.In recent economic news, the Chicago Purchasing Managers' Index (PMI) has posted a new figure, reflecting the current health of the manufacturing sector in the Chicago region. The actual number for the PMI has come in at 39.5. This figure, although showing an improvement, falls short of the forecasted number of 40.3. The Chicago PMI is a crucial economic indicator, with a reading above 50 indicating an expansion of the manufacturing sector, while a reading below 50 suggests a contraction. Therefore, the current PMI of 39.5 still signifies a contracting manufacturing sector in the Chicago region, albeit at a slower pace than before. |
No 1 |
39.5 |
|
Jan-2025 |
|
| |
|
|
|
|
|
|
|
|
| |
|
|
|
|
|
| |
|
|
|
|
|
|
Chicago PMI | Manufacturing (9:45 a.m ET)
| DATE/WEEK |
HIGHLIGHTS |
FOR |
ACTUAL |
|
Chicago PMI falls to 36.9, signaling sharp manufacturing contraction and bearish pressure on the U.S. dollar. Analysts forecasted a PMI of 42.7, but the actual reading of 36.9 reflects deeper economic struggles. The PMI drop below last month’s 40.2 suggests ongoing manufacturing weakness in the Chicago region. A sub-50 PMI signals contraction, raising concerns about the broader U.S. manufacturing sector. Bearish PMI data hints at potential ISM manufacturing PMI weakness, impacting USD sentiment. |
No 12 |
36.9 |
|
Dec-2024 |
|
| |
|
|
|
Chicago PMI dips below forecast, indicating contraction in manufacturing sector. The Chicago Purchasing Managers' Index (PMI), a key indicator of the economic health of the manufacturing sector in the Chicago region, has reported a figure of 40.2. This latest figure falls below the forecasted number of 44.9, hinting at a contraction in the manufacturing sector. The actual figure of 40.2 not only falls short of the forecasted 44.9 but also represents a decrease from the previous figure of 41.6. This decline suggests that the manufacturing sector in the Chicago region is experiencing a contraction, which could potentially affect the overall health of the U.S. economy. |
No 11 |
40.2 |
|
Nov-2024 |
|
| |
|
|
|
The Chicago Business Barometer, also known as the Chicago PMI, sank to 41.6 in October 2024 from 46.6 in September and well below market estimates of 47. The Chicago Purchasing Managers' Index (PMI) determines the economic health of the manufacturing sector in Chicago region. A reading above 50 indicates expansion of the manufacturing sector; a reading below indicates contraction. The Chicago PMI can be of some help in forecasting the ISM manufacturing PMI.
|
No 10 |
41.6 |
|
Oct-2024 |
|
| |
|
|
|
Modest upturn in Chicago PMI points to slight expansion in manufacturing sector. The Chicago Purchasing Managers' Index (PMI), a key indicator of the economic health of the manufacturing sector in the Chicago region, witnessed a minor uptick, as per the latest data. The actual PMI figure came in at 46.6, marking a slight increase from the previous and forecasted readings. This new figure of 46.6, while still below the crucial 50 mark that separates expansion from contraction, indicates a marginal improvement in the manufacturing sector's performance. It was slightly higher than the forecasted figure of 46.1, suggesting that the sector performed a bit better than analysts had predicted. |
No 9 |
46.6 |
|
Sep-2024 |
|
| |
|
|
|
The Chicago Business BarometerTM, produced with MNI progressed 0.8 points to 46.1 in August. The marginal move means it remains in contractionary territory for the ninth consecutive month, although is comfortably above the year-to- date average of 42.9. The marginal rise was due to three of the five subcomponents improving. The marginal upward movement was driven by New Orders, followed by Production and Supplier Deliveries. Whilst small reductions in Order Backlogs and Employment capped the upside move. |
No 8 |
46.1 |
|
Aug 2024 |
|
| |
|
|
|
The Chicago purchasing managers index fell to 45.3 in July, according to the Institute for Supply Management. July's reading was down from a seven-month high of 47.4 in June but came in above analysts' expectations for a print of 44.8. Chicago PMI Retreats Less than Expected in July 2024. Chicago Purchasing Managers Index slipped to 45.3 in July 2024. The Chicago Business Barometer™, produced with MNI slipped 2.1 points to 45.3 |
No 7 |
45.3 |
|
Jul-2024 |
|
| |
|
|
|
The Chicago Business Barometer rebounded in June following May’s four-year low, according to Market News International (MNI) and the Institute for Supply Management (ISM). The Barometer reading jumped 12 points from May to June, now standing at a seven-month high of 47.4. This is the first monthly rise seen in six months, and the largest monthly movement recorded in nearly four years. |
No 6 |
47.4 |
|
Jun-2024 |
|
| |
|
|
|
The latest Chicago Purchasing Manager's Index (Chicago Business Barometer) fell to 35.4 in May from 37.9 in April. This is the sixth straight monthly decline and the lowest level for the index since May 2020. The latest reading is worse than the 41.1 forecast and keeps the index in contraction territory for a sixth consecutive month. The Chicago PMI assess the business conditions and the economic health of the manufacturing sector in the Chicago region. A value above 50.0 indicate expanding manufacturing activity, while a value below 50.0 indicate contracting manufacturing activity. |
No 5 |
35.4 |
|
May-2024 |
|
| |
|
|
|
The latest Chicago Purchasing Manager's Index (Chicago Business Barometer) fell to 37.9 in April from 41.4 in March. This is the fifth straight monthly decline and the lowest level for the index since November 2022. The latest reading is worse than the 44.9 forecast and keeps the index in contraction territory for a fifth consecutive month. Background on Chicago PMI The Chicago PMI assess the business conditions and the economic health of the manufacturing sector in the Chicago region. |
No 4 |
37.9 |
|
Apr-2024 |
|
| |
|
|
|
The latest Chicago Purchasing Manager's Index (Chicago Business Barometer) fell to 41.4 in March from 44.0 in February. This is the fourth straight monthly decline and the lowest level for the index in ten months. The latest reading is worse than the 45.9 forecast and keeps the index in contraction territory for a fourth consecutive month. Background on Chicago PMI The Chicago PMI assess the business conditions and the economic health of the manufacturing sector in the Chicago region. |
No 3 |
41.4 |
|
Mar-2024 |
|
| |
|
|
|
Chicago PMI Shows Decline in February 2024. In the latest economic data released for the United States, the Chicago Purchasing Managers' Index (Chicago PMI) for the month of February 2024 has shown a decline. The index, which measures manufacturing activity in the Chicago region, dropped to a level of 44, down from 46 in the previous month of January 2024. The lower Chicago PMI figure indicates a slowdown in manufacturing growth in the region, reflecting potential challenges faced by businesses. This news comes amidst global economic uncertainties and supply chain disruptions that have been impacting various sectors. The data was updated on February 29, 2024, highlighting the most recent snapshot of economic conditions in the United States. |
No 2 |
44.0 |
|
Feb-2024 |
|
| |
|
|
|
The Chicago PMI fell 9 tenths in January to a lower-than-expected 46.0 that followed December's 46.9. This index, which can be very volatile, briefly emerged from long sub-50 contraction in November at 55.8. Chicago Purchasing Managers Index down to 46.0 in. Chicago Purchasing Managers Index down to 46.0 in January 2024. January's result leaves the Relative Performance Index at plus 7, near the zero line to indicate that recent US economic data on net are coming in near Econoday's consensus estimates. Yet when excluding inflation readings, such as today's employment cost index which have been coming in below forecasts, the index rises to 21 to indicate that the real economy continues to outperform expectations. For monetary policy, strong economic growth will not pull forward expectations for the Federal Reserve's expected rate cut. |
No 1 |
46.0 |
|
Jan-2024 |
|
| |
|
|
|
|
|
|
|
|
| |
|
|
|
|
|
| |
|
|
|
|
|
|
Chicago PMI | Manufacturing (9:45 a.m ET)
| DATE/WEEK |
HIGHLIGHTS |
FOR |
ACTUAL |
|
The Chicago PMI fell back by 8.9 points to 46.9 in December from 55.8 in November to reverse almost all of its remarkable November rise from 44.0 in October. The December result was much weaker than the consensus 50.0 expectation and below the range of forecasts at 49.4 to 53.0, just as the November result was far above forecasts. The Chicago report, which includes both manufacturing and non-manufacturing businesses, is highly volatile, presumably reflecting a small sample size. The November surge may also have reflected the impact of the end of the UAW autoworkers strike. |
No 12 |
46.9 |
|
Dec-2023 |
|
| |
|
|
|
Chicago business activity index moves into expansion territory for first time in more than a year. The Chicago Business Barometer, also known as the Chicago PMI, jumped to 55.8 in November from 44 in the prior month. That’s the largest monthly gain since September 2020. Economists polled by the Wall Street Journal had forecast a 46 reading. This is the first reading above the 50 threshold for growth since August 2022. It is the highest level of the Chicago PMI since May 2022. The index is produced by the ISM-Chicago with MNI. It is the last of the regional manufacturing indices before the national ISM data for November is released on Friday. |
No 11 |
55.8 |
|
Nov-2023 |
|
| |
|
|
|
The Chicago PMI edged 1 tenth lower in October to 44.0 which compares with Econoday's consensus for 45.0. This is the 14th straight month below 50 to indicate contraction in composite activity for the sample. The Chicago PMI is expected to rise in October to 45.0 versus 44.1 in September which was the 13th straight month of sub-50 contraction. |
No 10 |
|
|
Oct-2023 |
|
| |
|
|
|
Chicago PMI falls nuch more than expected. The PMI was expected to come in today at 46.7 but only came in at 44.1. The current level of 44.1 is below the level the index. Chicago PMI Disappoints in September 2023. The Chicago Business Barometer, also known as the Chicago PMI, fell to 44.1 in September 2023 from 48.7 in August 2023, and well below market consensus of 47.6. |
No 9 |
44.1 |
|
Sep-2023 |
|
| |
|
|
|
Chicago Business Barometer™ - Increases To 48.7 - August 2023 Chicago Report. The Chicago Business Barometer™, produced with MNI, improved by 5.9 points to 48.7 in August. This represents the third consecutive monthly increase and the highest level since August 2022. With the exception of Order Backlogs, all of the subcomponents rose. This represents the third consecutive monthly increase and the highest level since August 2022. With the exception of Order Backlogs, all of the subcomponents rose. |
No 8 |
48.7 |
|
Aug-2023 |
|
| |
|
|
|
Chicago Purchasing Managers Index up to 42.8 in July 2023. The Chicago Business Barometer™, produced with MNI, ticked up by 1.3 points to 42.8 in July, the second consecutive monthly increase. Chicago Business barometer rises to 42.8 in July from 41.5. The Chicago Business Barometer, also known as the Chicago PMI, rose 1.3 points to 42.8 in July from 41.5, according to MNI Indicators. Economists polled by the Wall Street Journal forecast a 4 |
No 7 |
42.8 |
|
Jul-2023 |
|
| |
|
|
|
The Chicago Business BarometerTM, produced with MNI, ticked up by 1.1 points to 41.5 in June, largely due to a less stark contraction in Production. The barometer remains firmly sub-50, signaling ten consecutive months of contractionary business activity in June. Production and Order Backlogs inched up in June, whilst all other subindexes weakened. Prices Paid and Inventories recorded the biggest falls. All subindexes excluding Prices Paid were in contractive (sub-50) territory this month. Production improved by +3.0 points to 42.6 in June, having experienced a tumultuous few months and a marked 8.3 point May decline. |
No 6 |
41.5 |
|
Jun-2023 |
|
| |
|
|
|
Chicago business activity index tumbles to six-month low in May. Index drops 8.2 points to 40.4. The Chicago Business Barometer, also known as the Chicago PMI, fell 8.2 index points to 40.4 in May, according to MNI Indicators. Economists polled by the Wall Street Journal forecast a 47.3 reading. |
No 5 |
40.4 |
|
May-2023 |
|
| |
|
|
|
Chicago Business Barometer™- Lifted to 48.6 in April. The Chicago Business BarometerTM, produced with MNI, improved by 4.8 points to 48.6 in April. This was the highest reading since August 2022. Nonetheless, the headline index remained sub-50, thus signaling an eighth consecutive month of contractionary business activity. However, we note that the non-seasonally adjusted Chicago Business BarometerTM rose to 50.8, above 50 for the first time since August 2022. |
No 4 |
48.6 |
|
Apr-2023 |
|
| |
|
|
|
Chicago business activity index remains in contractionary territory for seventh straight month in March. Index rises to 43.8, above forecast of 43. The Chicago Business Barometer, also known as the Chicago PMI, inched up 0.2 index points to 43.8 in March. It was the first increase since December. The increase was unexpected. Economists polled by the Wall Street Journal forecast a 43 reading. |
No 3 |
43.8 |
|
Mar-2023 |
|
| |
|
|
|
The Chicago PMI, at 43.6 in February, signals contraction for a sixth month in a row and, for a second month in a row, missed Econoday's consensus estimate. Business surveys have been consistently signaling contraction underway in business activity. Watch at the top of the hour for the latest on manufacturing conditions in the Richmond Fed's district. The Chicago PMI is expected to rise modestly in February to 45.0 versus 44.3 in January. February Chicago PMI falls to 43.6. |
No 2 |
43.6 |
|
Feb-2023 |
|
| |
|
|
|
The Chicago PMI contracted for a fifth month in a row. The Chicago Purchasing Manager’s Index (PMI), an index of the strength of manufacturing firms based in the Chicago area, saw declines in January 2023 settling at 44.3, from 44.9 in December 2022. Chicago PMI comes in under expectations; lightest since November 2022. |
No 1 |
44.3 |
|
Jan-2023 |
|
| |
|
|
|
|
|
|
|
|
| |
|
|
|
|
|
| |
|
|
|
|
|
|
Chicago PMI | Manufacturing (9:45 a.m ET)
| DATE/WEEK |
HIGHLIGHTS |
FOR |
ACTUAL |
|
Chicago PMI rebounds in December, remains in contraction territory. Index rises 7.7 points to 44.9, higher than expected. The Chicago Business Barometer, also known as the Chicago PMI, rebounded to 44.9 in December from 37.2 in the prior month, which was the lowest reading since the 2007/2008 financial crisis. Economists polled by the Wall Street Journal forecast a 40.5 reading. |
No 12 |
44.9 |
|
Dec-2022 |
|
| |
|
|
|
Manufacturing sector activity in the Chicago registered an outsized slump in November, the results of a survey revealed.. Market News International's Chicago factory sector Purchasing Managers' index cratered to a reading of 37.2. That was down from an October print of 45.2 and well below economists' forecasts for a reading of 47.0. Subindices for production, new orders and employment all fell to their June 2020 lows, the survey compiler said. Only the subindices for inventories and price paid remained in expansionary territory while those for employment and inventories were the only ones to register upticks. The new orders gauge fell by 8.5 points to 30.7 and that for output by 9.2 points to 35.9. Another sub-index linked to supplier deliveries did fall by 9.4 points to 49.9, reflecting an easing in bottlenecks. The sub-index for prices paid meanwhile dropped by 8.6 points to 66.2. |
No 11 |
37.2 |
|
Nov-2022 |
|
| |
|
|
|
Chicago PMI weakens further in October. Barometer of business dipped to 45.2 in October, the second straight month of contraction. The Chicago Business Barometer, also known as the Chicago PMI, dropped to 45.2 in October from 45.7 in the prior month, according to data released Monday. Economists polled by the Wall Street Journal forecast a 47 reading. |
No 10 |
45.2 |
|
Oct-2022 |
|
| |
|
|
|
Chicago PMI makes sharp decline in September, hits lowest level since 2020. Chicago Purchasing Managers Index for September 2022.Chicago PMI falls to 45.70, signaling contraction. Chicago PMI: fell to 45.70, down from 52.20 last month, decreasing -12.45%. Chicago PMI: fell to 45.70, down from 52.20 last month, decreasing -12.45%. Estimate, consensus was 51.8. |
No 9 |
45.7 |
|
Sep-2022 |
|
| |
|
|
|
Chicago Business Barometer Inches Slightly Higher In August 2022. A report released by MNI Indicators on Wednesday showed its reading on Chicago-area business activity was little changed in the month of August. MNI Indicators said its Chicago business barometer inched up to 52.2 in August from 52.1 in July, with a reading above 50 indicating growth. Economists had expected the business barometer to edge down to 52.0. The slight uptick came after the Chicago business barometer dropped to its lowest level since August 2020 in the previous month. The modest increase by the headline index came as the production index jumped to 54.9 in August from 48.2 in July, while the new orders index climbed to 48.9 from 44.5. |
No 8 |
52.2 |
|
Aug-2022 |
|
| |
|
|
|
Chicago PMI continues to soften in July, falls to lowest level in almost two years Factory activity index drops to 52.1 vs. consensus of 55. The Chicago Business Barometer, also known as the Chicago PMI, fell to 52.1in July from 56 in the prior month. It is the lowest reading since August 2020. Economists polled by the Econoday forecast a steady 56 reading. |
No 7 |
52.1 |
|
Jul-2022 |
|
| |
|
|
|
A first look at manufacturing activity in May, the Chicago PMI signaled a moderating expansion in manufacturing in that part of the country. The index, officially called the MNI Chicago Business Barometer™ fell 4.3 points to 56.0. As with other PMIs, a reading above 50 indicates an expansion, thus manufacturing expanded at a slower pace than in May. |
No 6 |
56.0 |
|
Jun-2022 |
|
| |
|
|
|
Chicago PMI jumps in May, beating expectations. The Chicago Business Barometer, also known as the Chicago PMI, rose to 60.3 in May from 56.4 in the prior month. Economists polled by the Wall Street Journal forecast a 55.9 reading. |
No 5 |
60.3 |
|
May-2022 |
|
| |
|
|
|
Chicago PMI stumbles in April. Manufacturing gauge falls to 56.4, well below forecast of 62. The Chicago Business Barometer, also known as the Chicago PMI, fell to 56.4 in April from 62.9 in the prior month. Economists had expected little change, with analysts polled by the Wall Street Journal forecasting a 62 reading. The index is 14.4 points below it’s reading from April 2021. The index is produced by the ISM-Chicago with MNI. It is released to subscribers three minutes before its release to the public at 9:45 am Eastern. The Chicago PMI is the last of the regional manufacturing indices before the national ISM data for April is released on Monday. In March, the ISM factory index slipped to 57.1, which is its lowest level since September 2020. |
No 4 |
56.4 |
|
Apr-2022 |
|
| |
|
|
|
Chicago PMI Exceeds Expectations in March. The Chicago Business Barometer showed a much bigger than expected increase in March after falling to an 18-month low the month prior, according to the latest indicators from Market News International (MNI) and the Institute for Supply Management (ISM). MNI Indicators said the business barometer jumped to 62.9 in March from 56.3 in February and was well ahead of the expected 57.0 measure. A reading above 50 indicates growth. |
No 3 |
62.9 |
|
Mar-2022 |
|
| |
|
|
|
Chicago PMI weakens. Chicago PMI, opens new tab fell to 56.3 in February from 65.2 in January, well below the consensus, 62.3, leaving economists scrambling to explain the discrepancy. Ian Shepherdson, chief economist at Pantheon Macroeconomics wrote that the reading "increases the risk of a downside surprise in tomorrow’s ISM report" but not by much. The consensus forecast for that is 58.0. |
No 2 |
56.3 |
|
Feb-2022 |
|
| |
|
|
|
Activity at factories in the U.S. Midwestern region defied expectations by gaining momentum in January The Chicago purchasing managers' index (PMI) (USCPMI=ECI), opens new tab, courtesy of MNI Indicators, delivered a print of 65.2, indicating manufacturing expansion accelerated in the first month of 2022, rising from December's upwardly revised 64.3 and coming in well above the 61.7 consensus, which would have indicated a modest slowdown. A PMI number above 50 signifies expanded activity over the previous month. The index has been on a downward trend since May, when scarcity of supply amid booming demand began tossing buckets of cold water on factory expansion. |
No 1 |
65.2 |
|
Jan-2022 |
|
| |
|
|
|
|
|
|
|
|
| |
|
|
|
|
|
| |
|
|
|
|
|
|
Chicago PMI | Manufacturing (9:45 a.m ET)
| DATE/WEEK |
HIGHLIGHTS |
FOR |
ACTUAL |
|
The Chicago purchasing managers' index (PMI) (USCPMI=ECI), opens new tab, courtesy of MNI Indicators, delivered a print of 63.1, a monthly increase of 1.3 points and 1.1 points above consensus. A PMI number over 50 signifies expanded activity over the previous month. The increase was driven by gains in production, new orders and inventories, with employment and deliveries weighing down the headline number. |
No 12 |
63.1 |
|
Dec-2021 |
|
| |
|
|
|
Chicago PMI slumps in November to lowest reading in nine months. The Chicago Business Barometer, also known as the Chicago PMI, fell to 61.8 in November from 68.4 in the prior month. It is the lowest reading since February. November Chicago PMI comes in lower than expected. Chicago PMI data, which came in at 61.8 vs. 67 expected. 00:50. Tue, Nov 30. |
No 11 |
61.8 |
|
Nov-2021 |
|
| |
|
|
|
Chicago PMI Rises to 68.4, Fourth Highest Level in Past Decade. Chicago business activity picks up in October, PMI report shows. The Chicago Business Barometer, also known as the Chicago PMI, rose to 68.4 in October from 64.7 in the prior month. It’s the strongest reading since July. Economists polled by the Wall Street Journal forecast a decline to a 63.5 reading in October. |
No 10 |
68.4 |
|
Oct-2021 |
|
| |
|
|
|
Chicago PMI dips to lowest level in seven months in September. Trouble with rail transport and delivery of raw materials hampered production, firms say. A measure of business conditions in the Chicago region slipped in September to its lowest level in seven months, a trade group said Thursday. The Chicago Business Barometer, also known as the Chicago PMI, slowed to 64.7 in September from 66.8 in the prior month. The index has been moderating from a record high of 75.2 in May. |
No 9 |
64.7 |
|
Sep-2021 |
|
| |
|
|
|
In August, the Chicago PMI declined by 6.6 points to a level of 66.8. This decline comes after the index rose to its second highest reading in July. The figure came in 1.2 points below market expectations. Despite the decline, the index remains firmly in expansion territory and continues to hoover above 50 points. |
No 8 |
66.8 |
|
Aug-2021 |
|
| |
|
|
|
US dollar rises on Chicago PMI data release, with profit taking and month end rebalancing ensuing. The US Chicago PMI for July came in above the market analysts’ highest predictions at 73.4, which is a big jump from the previous reading of 66.1 and on this data the US dollar caught a bid and the US dollar index rose. |
No 7 |
73.4 |
|
Jul-2021 |
|
| |
|
|
|
Chicago PMI slips in June after hitting highest level in almost 50 years. Index falls to 4-month low of 66.1. A measure of business conditions in the Chicago region rose at a slightly slower pace in June, one month after reaching its highest level in 47 years, a trade group said Wednesday. The Chicago Business Barometer, also known as the Chicago PMI, fell to 66.1 in June from 75.2 in the prior month, which had been the highest reading since December 1983. The June reading is the lowest since February. Chicago PMI comes in at 66.1 in June versus 70 expected. Chicago PMI comes in at 66.1 in June versus 70 expected ... CNBC's Rick Santelli breaks down the latest economic data. 00:45. Wed, Jun 30 2021. |
No 6 |
66.1 |
|
Jun-2021 |
|
| |
|
|
|
Chicago regional business barometer soars to highest level since 1973. A measure of business conditions in the Chicago region had another strong reading in May, reaching its highest level in 47 years, a trade group said Friday. The Chicago Business Barometer, also known as the Chicago PMI, jumped to 75.2 in May from 72.1, which had been the highest reading since December 1983. In May, the Chicago PMI surged by 4.3% to a reading of 75.2—the highest since 1973. This month’s reading outperformed its forecast by 6.2 points. The index has increased by 42.9 points over the past twelve months, highlighting the extent of the economic recovery that has taken place since the pandemic-related recession was at its peak. |
No 5 |
75.2 |
|
May-2021 |
|
| |
|
|
|
Chicago April 2021 PMI comes in at 72.1, vs 65 expected. |
No 4 |
72.1 |
|
Apr-2021 |
|
| |
|
|
|
Chicago PMI shows business sentiment and prices keep rising. The Chicago purchasing managers index (PMI) came in at 66.3 in March, the highest it's been since July 2018. What it means: The survey asks business owners whether things are better, worse or the same for their firm, with a reading of 50 meaning that respondents overall were neutral. A reading over 60 shows conditions improving strongly. March Chicago PMI jumps to 66.3, vs. 60.3 expected. Chicago PMI numbers, which came in stronger than expected. 02:25. Wed, Mar 31 . |
No 3 |
66.3 |
|
Mar-2021 |
|
| |
|
|
|
US: Chicago PMI declines to 59.5 in February vs. 61.1 expected. Chicago PMI falls more than expected in January. US Dollar Index holds in the positive territory above 90.50. The data published by the ISM-Chicago showed on Friday that the Chicago Purchasing Managers' Index (PMI) in February dropped to 59.5 from 63.8 in January. This reading came in worse than the market expectation of 61.1 and showed that the economic activity continued to expand at a softer pace. US: Chicago PMI declines to 59.5 in February vs. 61.1 expected ...The data published by the ISM-Chicago showed on Friday that the Chicago Purchasing Managers' Index (PMI) in February dropped to 59.5 from 63.8 in January. |
No 2 |
59.5 |
|
Feb-2021 |
|
| |
|
|
|
Chicago PMI comes in strong, UoM in-line with expectations. Chicago PMI for the month of January turned to be better-than-expected, showing a promising sign of economic recovery Meanwhile, University of Michigan Consumer Sentiment was more-or-less in line with expectations. The exact figures were as follows: Chicago PMI in January: 63.8 pts (vs expected 58.5 pts) |
No 1 |
63.8 |
|
Jan-2021 |
|
| |
|
|
|
|
|
|
|
|
| |
|
|
|
|
|
|
| |
|
|
|
|
|
|
|
|
|
|
|
|
|
|
|
|
|
|
|
|
|
Definitions | Explain |
|
|
Chicago PMI | Manufacturing |
|
Today's Week |
|
|
|
|
|
|
|
|
|
|
|
|
| |
|
|
|
|
| |
|
| CHICAGO PMI |
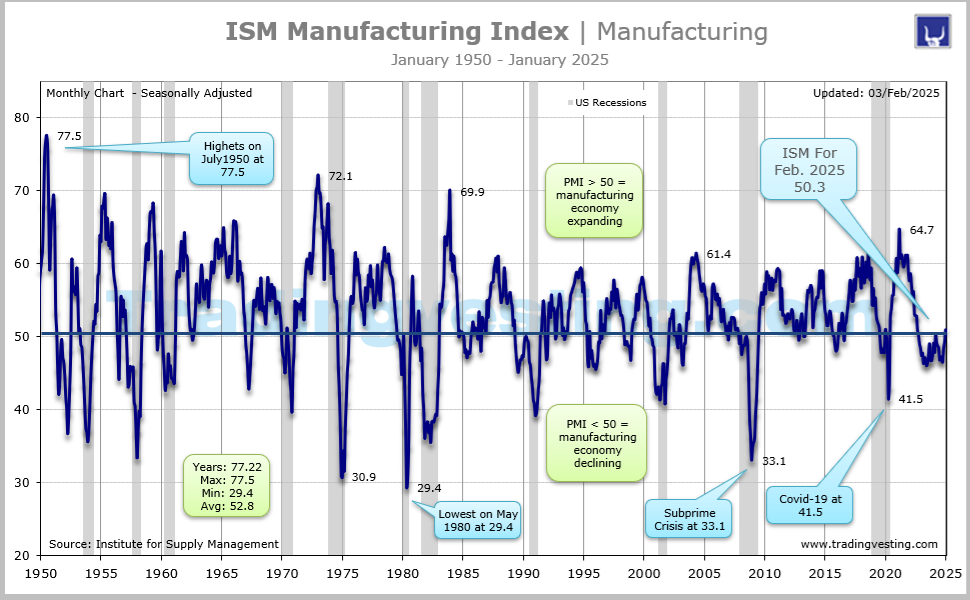
The Chicago PMI is a valuable tool in forecasting the Institute for Supply Management (ISM) manufacturing PMI. it is important to note that while a higher than expected reading is typically viewed as positive or bullish for the USD, a lower than expected reading is generally considered negative or bearish.
The official name of this report is ISM - Chicago although it is commonly referred to as the Chicago PMI.
The traditional name goes back to the years when the ISM was called the National Association of Purchasing Management.
Investors should track economic data like the Chicago PMI to understand the economic backdrop for the various markets.
The stock market likes to see healthy economic growth because that translates to higher corporate profits.
The bond market prefers a moderate growth environment that won't generate inflationary pressures.
PMI data is the Purchasing Managers Index that polls businesses to discover their need for goods and services. Said another way, it is a leading data point of future economic activity. If the reading is greater than 50, it shows expansion and below 50 is contraction. |
|
|
| |
|
|
|
|
|
|
|
|
|
|
|
| |
|
|
|
|
|
|
| DATA INFORMATION |
CHICAGO PMI |
| SOURCE |
Institute for Supply Management. |
| WEB |
www.hts.com |
| FREQUENCY |
Monthly |
| AVAILABILITY |
The first business day of the month. |
| COVERAGE |
Data are for the previous month. Data for June are released in July. |
| REVISIONS |
Yes |
| IMPORTANCE |
Manufacturing - Very Important |
|
| |
|
|
|
|
|
|
|
|
|
|
|
|