 |
 |
|
 |
S&P Case-Shiller | Real Estate |
|
 |
|
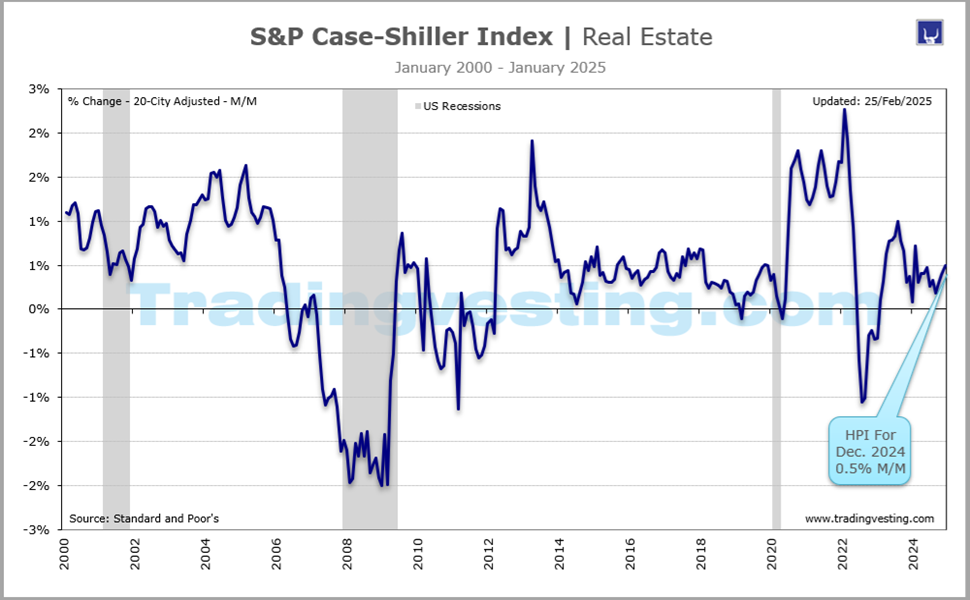
The S&P/Case-Shiller Home Price Indices are the leading measures for the US residential housing market, tracking changes in the value of residential real estate both nationally as well as in 20 metropolitan regions. Read More...
|
|
|
|
|
|
|
| |
|
| |
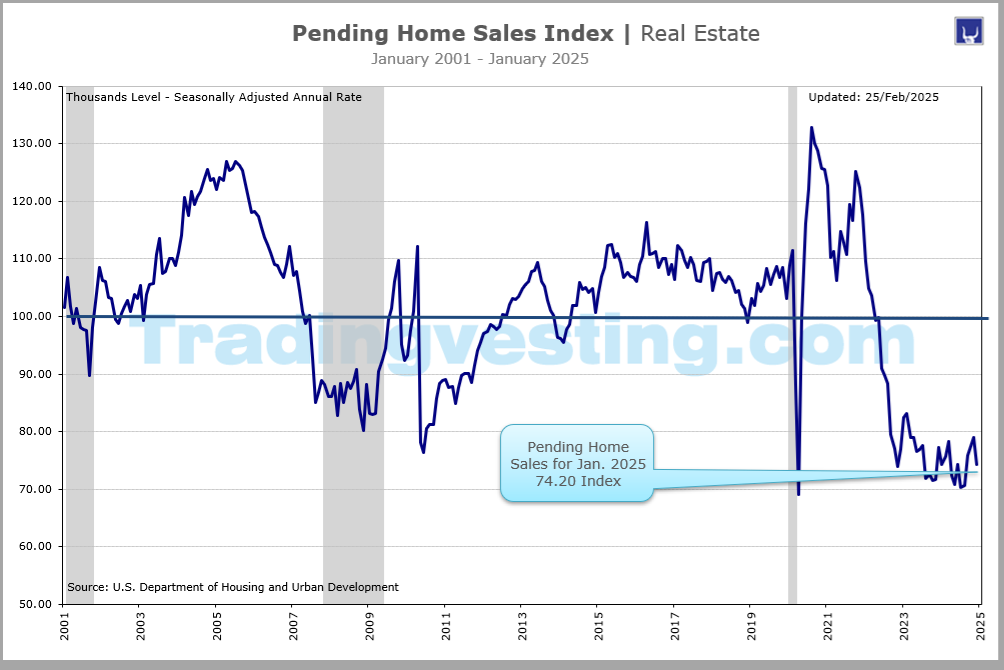
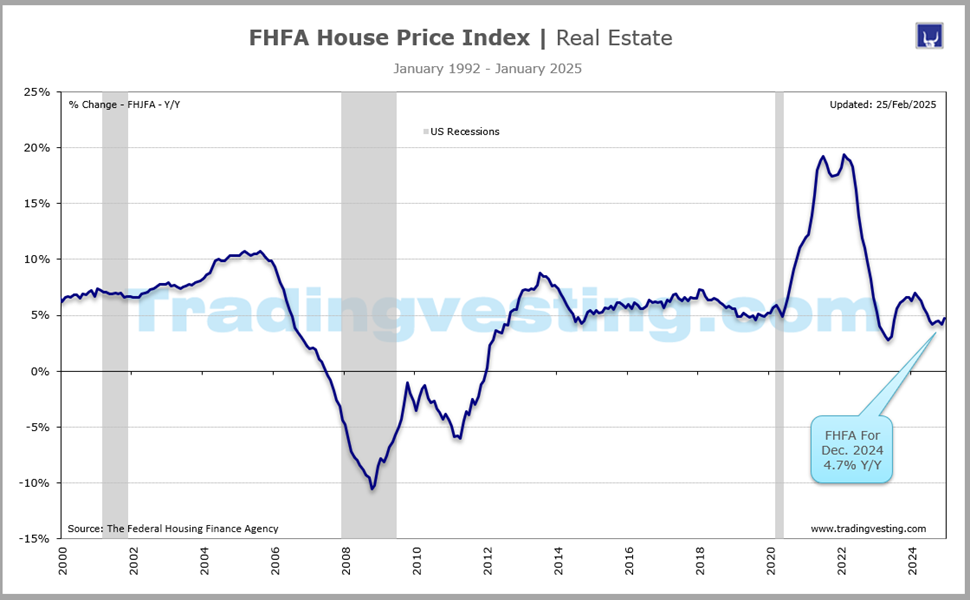
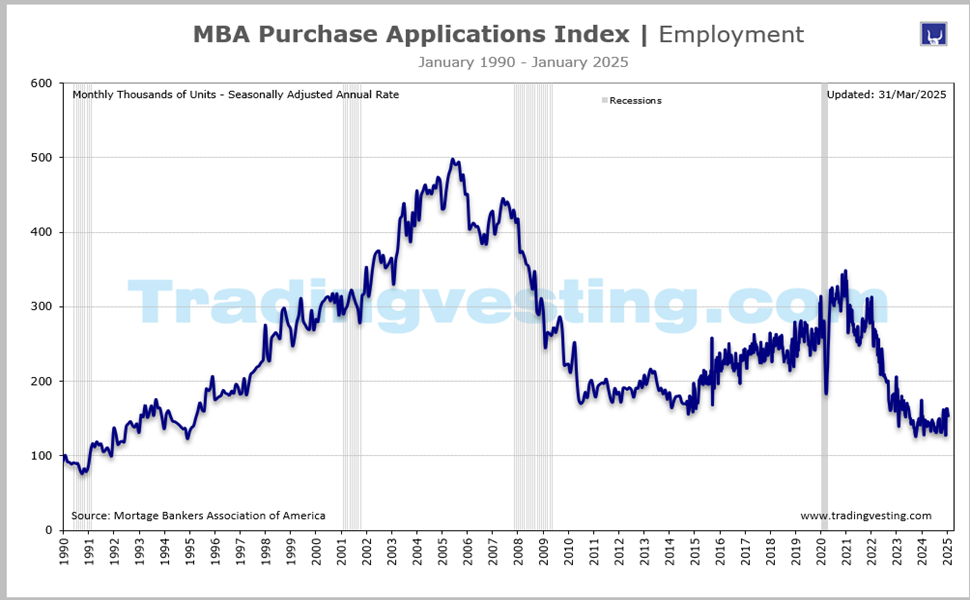
 3. Case Shiller Index (1 of 10) 3. Case Shiller Index (1 of 10) 1. Building Permits (2 of 10) 1. Building Permits (2 of 10)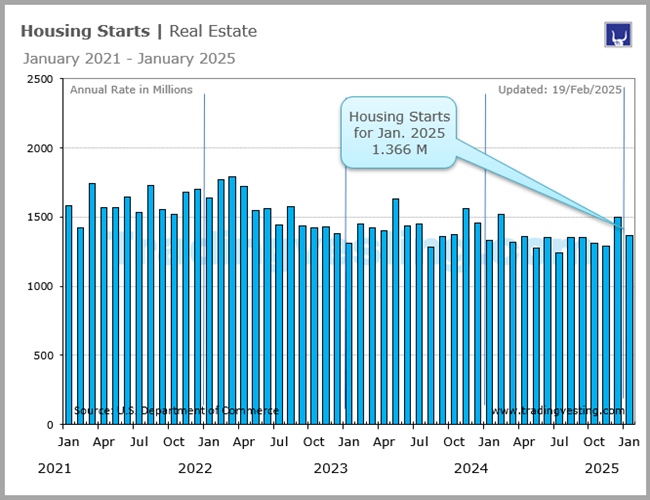 2. Housing Starts (3 of 10) 2. Housing Starts (3 of 10)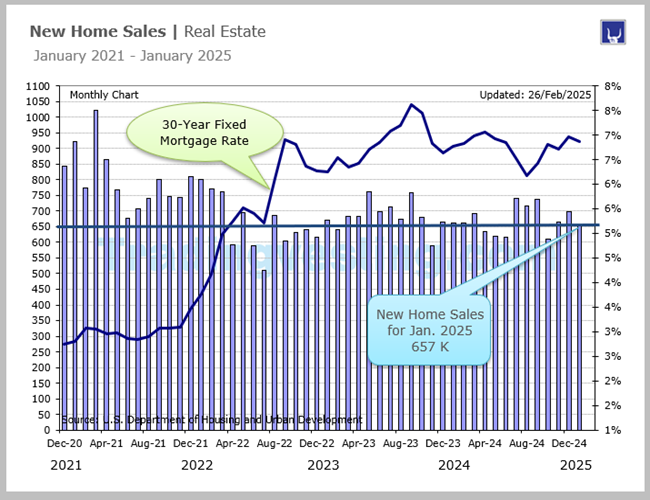 4. New Home Sales (4 of 10) 4. New Home Sales (4 of 10) 5. Existing Home Sales (5 of 10) 5. Existing Home Sales (5 of 10) 6. Pending Home Sales (6 of 10) 6. Pending Home Sales (6 of 10) 7. Housing Market Index (7 of 10) 7. Housing Market Index (7 of 10) 8. FHFA House Price Index (8 of 10) 8. FHFA House Price Index (8 of 10) 9. MBA Purchase Applications (9 of 10) 9. MBA Purchase Applications (9 of 10) 10. Mortgae Rates 30-Year (10 of 10) 10. Mortgae Rates 30-Year (10 of 10)
|
 |
|
|
|
|
| |
|
→ Big Chart |
|
→ Release |
|
| |
|
|
|
|
|
|
|
|
|
|
|
|
|
|
|
|
|
|
|
 |
|
Big Chart | Large Data |
 |
|
S&P Case-Shiller HPI | Real Estate |
|
Today's Week |
 |
|
|
|
|
|
|
|
|
|
|
|
|
|
| |
|
aff |
|
|
|
|
|
|
|
|
|
|
|
|
|
|
|
|
|
|
|
Big Chart | 2024 |
|
|
S&P Case-Shiller HPI | Real Estate |
|
Today's Week |
|
|
|
|
|
|
|
|
|
|
|
|
|
|
| |
|
|
|
|
|
|
|
|
|
|
|
|
|
|
|
|
|
|
|
|
|
Release Schedule | 2026 |
|
|
S&P Case-Shiller HPI | Real Estate |
|
Today's Week |
|
|
|
|
|
|
|
|
|
|
|
|
|
S&P Case-Shiller - 20-City Adjusted M/M and Unadjusted M/M Y/Y (At 9:00)
| SCHEDULE 2026 |
No 1 |
No 2 |
No 3 |
No 4 |
No 5 |
No 6 |
No 7 |
No 8 |
No 9 |
No 10 |
No 11 |
No 12 |
| Release | Week |
|
|
|
|
|
|
|
|
|
|
|
|
| Release | Date |
|
|
|
|
|
|
|
|
|
|
|
|
| Release | Day |
|
|
|
|
|
|
|
|
|
|
|
|
 |
|
|
|
|
|
|
|
|
|
|
|
|
| Prior 20-City Adj |
0.4% |
0.5% |
0.5% |
... |
... |
... |
... |
... |
... |
... |
... |
... |
| Prior Revised |
... |
... |
... |
... |
... |
... |
... |
... |
... |
... |
... |
... |
| CONSENSUS |
... |
0.3% |
... |
... |
... |
... |
... |
... |
... |
... |
... |
... |
| Consensus Low |
... |
0.2% |
... |
... |
... |
... |
... |
... |
... |
... |
... |
... |
| Consensus High |
... |
0.3% |
... |
... |
... |
... |
... |
... |
... |
... |
... |
... |
| ACTUAL ADJ M/M |
0.5% |
0.5% |
0.2% |
... |
... |
... |
... |
... |
... |
... |
... |
... |
|
|
|
|
|
|
|
|
|
|
|
|
|
| 20-City UnAdj |
No 1 |
No 2 |
No 3 |
No 4 |
No 5 |
No 6 |
No 7 |
No 8 |
No 9 |
No 10 |
No 11 |
No 12 |
| Prior20-City |
-0.3% |
0.0% |
-0.1% |
... |
... |
... |
... |
... |
... |
... |
... |
... |
| Prior Unadj Rev |
... |
... |
... |
... |
... |
... |
... |
... |
... |
... |
... |
... |
| ACTUAL M/M |
0.0% |
-0.1% |
-0.1% |
... |
... |
... |
... |
... |
... |
... |
... |
... |
|
|
|
|
|
|
|
|
|
|
|
|
|
| Unadjusted Y/Y |
No 1 |
No 2 |
No 3 |
No 4 |
No 5 |
No 6 |
No 7 |
No 8 |
No 9 |
No 10 |
No 11 |
No 12 |
| Prior YY: |
1.3% |
1.4% |
1.4% |
... |
... |
... |
... |
... |
... |
... |
... |
... |
| Prior Revised YY |
... |
... |
... |
... |
... |
... |
... |
... |
... |
... |
... |
... |
| CONSENSUS Y/Y |
... |
1.4% |
... |
... |
... |
... |
... |
... |
... |
... |
... |
... |
| Consensus Low |
... |
1.0% |
... |
... |
... |
... |
... |
... |
... |
... |
... |
... |
| Consensus High |
... |
1.6% |
... |
... |
... |
... |
... |
... |
... |
... |
... |
... |
| SHILLER Y/Y |
1.4% |
1.4% |
1.2% |
... |
... |
... |
... |
... |
... |
... |
... |
... |
| RATING |
|
|
|
|
|
|
|
|
|
|
|
|
| Month For |
Nov 25 |
Dec 25 |
Jan-26 |
Feb-26 |
Mar-26 |
Apr-26 |
May-26 |
Jun-26 |
Jul-26 |
Aug-26 |
Sep-26 |
Oct-26 |
|
|
|
|
|
|
|
|
|
|
|
|
|
|
|
| Note: Shiller takes Year over Year into main consideration. Moreover, FHFA takes Year over Year for reporting purposes. |
|
| |
|
|
|
|
|
|
|
|
|
|
|
Release Schedule | 2025 |
|
|
S&P Case-Shiller HPI | Real Estate |
|
Today's Week |
|
|
|
|
|
|
|
|
|
|
|
|
|
S&P Case-Shiller - 20-City Adjusted M/M and Unadjusted M/M Y/Y (At 9:00)
| SCHEDULE 2025 |
No 1 |
No 2 |
No 3 |
No 4 |
No 5 |
No 6 |
No 7 |
No 8 |
No 9 |
No 10 |
No 11 |
No 12 |
| Release | Week |
|
|
|
|
|
|
|
|
|
|
|
|
| Release | Date |
|
|
|
|
|
|
|
|
|
|
|
|
| Release | Day |
|
|
|
|
|
|
|
|
|
|
|
|
|
|
|
|
|
|
|
|
|
|
|
|
|
| Prior Adj: |
0.3% |
0.4% |
0.5% |
0.5% |
0.4% |
-0.1% |
-0.3% |
-0.3% |
-0.3% |
-0.1% |
0.2% |
0.1% |
| Prior Revised: |
... |
... |
... |
... |
... |
... |
... |
... |
... |
... |
... |
... |
| CONSENSUS |
0.3% |
... |
... |
0.4% |
0.3% |
... |
... |
... |
-0.2% |
-0.1% |
-0.1% |
0.1% |
| Consensus Low: |
0.2% |
... |
... |
0.2% |
0.2% |
... |
... |
... |
-0.3% |
-0.1% |
-0.1% |
0.1% |
| Consensus High: |
0.3% |
... |
... |
0.5% |
0.4% |
... |
... |
... |
-0.1% |
0.0% |
0.2% |
0.2% |
| ACTUAL ADJ M/M: |
0.4% |
0.5% |
0.5% |
0.4% |
-0.1% |
-0.3% |
-0.3% |
-0.3% |
-0.1% |
0.2% |
0.1% |
0.4% |
|
|
|
|
|
|
|
|
|
|
|
|
|
| Unadjusted M/M |
No 1 |
No 2 |
No 3 |
No 4 |
No 5 |
No 6 |
No 7 |
No 8 |
No 9 |
No 10 |
No 11 |
No 12 |
| Prior Unadj: |
-0.2% |
-0.1% |
-0.1% |
0.1% |
0.7% |
1.1% |
0.7% |
0.4% |
-0.04% |
-0.3% |
-0.6% |
-0.5% |
| Prior Unadj Rev: |
... |
... |
... |
... |
... |
... |
... |
... |
... |
... |
... |
... |
| ACTUAL M/M: |
-0.1% |
-0.1% |
0.1% |
0.7% |
1.1% |
0.7% |
0.4% |
-0.04% |
-0.3% |
-0.6% |
-0.5% |
-0.3% |
|
|
|
|
|
|
|
|
|
|
|
|
|
| Unadjusted Y/Y |
No 1 |
No 2 |
No 3 |
No 4 |
No 5 |
No 6 |
No 7 |
No 8 |
No 9 |
No 10 |
No 11 |
No 12 |
| Prior YY: |
4.2% |
4.3% |
4.5% |
4.7% |
4.5% |
4.1% |
3.4% |
2.8% |
2.1% |
1.8% |
1.6% |
1.4% |
| Prior Revised YY: |
... |
... |
... |
... |
... |
... |
... |
... |
... |
... |
... |
... |
| CONSENSUS Y/Y: |
4.1% |
4.4% |
4.5% |
4.7% |
4.3% |
4.0% |
3.0% |
2.6% |
1.8% |
1.6% |
1.4% |
1.1% |
| Consensus Low: |
4.0% |
4.2% |
4.4% |
4.5% |
4.2% |
3.4% |
2.8% |
2.4% |
1.5% |
1.2% |
1.3% |
1.0% |
| Consensus High: |
4.3% |
4.6% |
4.5% |
4.8% |
4.5% |
4.0% |
3.3% |
2.9% |
1.9% |
2.1% |
1.6% |
1.2% |
| SHILLER Y/Y: |
4.3% |
4.5% |
4.7% |
4.5% |
4.1% |
3.4% |
2.8% |
2.1% |
1.8% |
1.6% |
1.4% |
1.3% |
| RATING |
|
|
|
|
|
|
|
|
|
|
|
|
| Month For: |
Nov 24 |
Dec 24 |
Jan-25 |
Feb-25 |
Mar-25 |
Apr-25 |
May-25 |
Jun-25 |
Jul-25 |
Aug-25 |
Sep-25 |
Oct-25 |
|
|
|
|
|
|
|
|
|
|
|
|
|
|
|
| Note: Shiller takes Year over Year into main consideration. Moreover, FHFA takes Year over Year for reporting purposes. |
|
| |
|
|
|
|
|
|
|
|
|
|
|
Release Schedule | 2024 |
|
|
S&P Case-Shiller HPI | Real Estate |
|
Today's Week |
|
|
|
|
|
|
|
|
|
|
|
|
|
S&P Case-Shiller - 20-City Adjusted M/M and Unadjusted M/M Y/Y (At 9:00)
| SCHEDULE 2024 |
No 1 |
No 2 |
No 3 |
No 4 |
No 5 |
No 6 |
No 7 |
No 8 |
No 9 |
No 10 |
No 11 |
No 12 |
| Release | Week |
|
|
|
|
|
|
|
|
|
|
|
|
| Release | Date |
|
|
|
|
|
|
|
|
|
|
|
|
| Release | Day |
|
|
|
|
|
|
|
|
|
|
|
|
|
|
|
|
|
|
|
|
|
|
|
|
|
| Prior Adj: |
0.6% |
0.1% |
0.2% |
0.1% |
0.6% |
0.3% |
0.4% |
0.3% |
0.4% |
0.3% |
0.4% |
0.2% |
| Prior Revised: |
... |
0.2% |
0.3% |
0.2% |
... |
... |
... |
0.4% |
... |
... |
... |
... |
| Consensus Adj: |
0.4% |
0.2% |
0.2% |
0.1% |
0.3% |
... |
... |
0.2% |
... |
... |
0.3% |
0.2% |
| Consensus Low: |
0.4% |
0.2% |
0.2% |
0.0% |
0.3% |
... |
... |
0.2% |
... |
... |
0.3% |
0.1% |
| Consensus High: |
0.5% |
0.3% |
0.2% |
0.1% |
0.3% |
... |
... |
0.2% |
... |
... |
0.4% |
0.2% |
| ACTUAL Adj M/M: |
0.1% |
0.2% |
0.1% |
0.6% |
0.3% |
0.4% |
0.3% |
0.4% |
0.3% |
0.4% |
0.2% |
0.3% |
|
|
|
|
|
|
|
|
|
|
|
|
|
| Unadjusted M/M |
No 1 |
No 2 |
No 3 |
No 4 |
No 5 |
No 6 |
No 7 |
No 8 |
No 9 |
No 10 |
No 11 |
No 12 |
| Prior Unadj: |
0.1% |
-0.2% |
-0.3% |
-0.1% |
0.9% |
1.6% |
1.4% |
1.0% |
0.6% |
0.0% |
-0.3% |
-0.3% |
| Prior Unadj Rev: |
... |
... |
... |
... |
... |
... |
... |
... |
... |
... |
... |
... |
| ACTUAL M/M: |
-0.2% |
-0.3% |
-0.1% |
0.9% |
1.6% |
1.4% |
1.0% |
0.6% |
0.0% |
-0.3% |
-0.3% |
-0.2% |
|
|
|
|
|
|
|
|
|
|
|
|
|
| Unadjusted Y/Y |
No 1 |
No 2 |
No 3 |
No 4 |
No 5 |
No 6 |
No 7 |
No 8 |
No 9 |
No 10 |
No 11 |
No 12 |
| Prior YY: |
4.9% |
5.4% |
6.1% |
6.6% |
7.3% |
7.4% |
7.2% |
6.8% |
6.5% |
5.9% |
5.2% |
4.6% |
| Prior Revised YY: |
... |
... |
6.2% |
... |
... |
7.5% |
7.3% |
6.9% |
... |
... |
... |
... |
| Consensus Y/Y: |
5.8% |
6.0% |
6.5% |
6.7% |
7.4% |
7.0% |
6.8% |
... |
5.9% |
5.2% |
4.8% |
4.3% |
| Consensus Low: |
5.6% |
6.0% |
6.3% |
6.7% |
7.3% |
6.8% |
6.5% |
... |
5.8% |
5.0% |
4.5% |
4.0% |
| Consensus High: |
5.9% |
6.3% |
6.8% |
7.0% |
7.5% |
7.1% |
6.9% |
... |
5.9% |
5.9% |
4.9% |
4.6% |
| SHILLER Y/Y: |
5.4% |
6.1% |
6.6% |
7.3% |
7.4% |
7.2% |
6.8% |
6.5% |
5.9% |
5.2% |
4.6% |
4.2% |
| RATING |
|
|
|
|
|
|
|
|
|
|
|
|
| Month For: |
Nov 23 |
Dec 23 |
Jan-24 |
Feb-24 |
Mar-24 |
Apr-24 |
May-24 |
Jun-24 |
Jul-24 |
Aug-24 |
Sep-24 |
Oct-24 |
|
|
|
|
|
|
|
|
|
|
|
|
|
|
|
| Note: Year-over-year, the 20-city unadjusted Y/Y |
|
| |
|
|
|
|
|
|
|
|
|
|
|
Release Schedule | 2023 |
|
|
S&P Case-Shiller HPI | Real Estate |
|
Today's Week |
|
|
|
|
|
|
|
|
|
|
|
|
|
S&P Case-Shiller - 20-City Adjusted M/M and Unadjusted M/M Y/Y (At 9:00)
| SCHEDULE 2023 |
No 1 |
No 2 |
No 3 |
No 4 |
No 5 |
No 6 |
No 7 |
No 8 |
No 9 |
No 10 |
No 11 |
No 12 |
| Release | Week |
|
|
|
|
|
|
|
|
|
|
|
|
| Release | Date |
|
|
|
|
|
|
|
|
|
|
|
|
| Release | Day |
|
|
|
|
|
|
|
|
|
|
|
|
|
|
|
|
|
|
|
|
|
|
|
|
|
| Prior Adj: |
-0.5% |
-0.5% |
-0.5% |
-0.4% |
0.1% |
0.5% |
0.9% |
1.0% |
0.9% |
0.9% |
1.0% |
0.7% |
| Prior Revised: |
... |
... |
... |
... |
-0.1% |
0.4% |
... |
... |
... |
0.8% |
... |
... |
| Consensus Adj: |
-0.5% |
-0.5% |
... |
-0.3% |
-0.1% |
0.5% |
0.8% |
1.1% |
0.7% |
0.7% |
0.7% |
0.6% |
| Consensus Low: |
-0.9% |
-0.8% |
... |
-0.5% |
-0.8% |
0.4% |
0.4% |
0.8% |
0.4% |
0.9% |
0.5% |
0.2% |
| Consensus High: |
-0.5% |
-0.4% |
... |
-0.1% |
0.1% |
0.6% |
1.5% |
1.2% |
0.7% |
0.9% |
0.9% |
0.7% |
| ACTUAL Adj M/M: |
-0.5% |
-0.5% |
-0.4% |
0.1% |
0.5% |
0.9% |
1.0% |
0.9% |
0.9% |
1.0% |
0.7% |
0.6% |
| Unadjusted M/M |
No 1 |
No 2 |
No 3 |
No 4 |
No 5 |
No 6 |
No 7 |
No 8 |
No 9 |
No 10 |
No 11 |
No 12 |
| Prior Unadj: |
-0.8% |
-0.8% |
-0.9% |
-0.5% |
0.2% |
1.5% |
1.7% |
1.5% |
0.9% |
0.6% |
0.4% |
0.4% |
| Prior Unadj Rev: |
... |
... |
... |
-0.6% |
0.3% |
1.6% |
... |
... |
... |
... |
... |
... |
| ACTUAL M/M: |
-0.8% |
-0.9% |
-0.5% |
0.2% |
1.5% |
1.7% |
1.5% |
0.9% |
0.6% |
0.4% |
0.2% |
0.1% |
| Unadjusted Y/Y |
No 1 |
No 2 |
No 3 |
No 4 |
No 5 |
No 6 |
No 7 |
No 8 |
No 9 |
No 10 |
No 11 |
No 12 |
| Prior YY: |
8.6% |
6.8% |
4.6% |
2.5% |
0.4% |
-1.1% |
-1.7% |
-1.7% |
-1.2% |
0.1% |
2.2% |
3.9% |
| Prior Revised YY: |
... |
... |
... |
2.6% |
... |
... |
... |
... |
... |
0.2% |
... |
... |
| Consensus Y/Y: |
6.7% |
5.3% |
3.7% |
0.0% |
-1.6% |
-2.3% |
-2.5% |
-1.1% |
-0.6% |
1.6% |
3.8% |
5.0% |
| Consensus Low: |
6.3% |
4.3% |
2.5% |
-0.1% |
-2.5% |
-2.7% |
-2.7% |
-1.3% |
-1.0% |
0.3% |
2.5% |
4.7% |
| Consensus High: |
6.9% |
6.8% |
5.8% |
1.3% |
-0.7% |
-1.5% |
-2.0% |
-1.1% |
0.3% |
1.7% |
4.2% |
5.1% |
| ACTUAL SA Y/Y: |
6.8% |
4.6% |
2.5% |
0.4% |
-1.1% |
-1.7% |
-1.7% |
-1.2% |
0.1% |
2.2% |
3.9% |
4.9% |
| RATING |
|
|
|
|
|
|
|
|
|
|
|
|
| Month For: |
Nov 22 |
Dec 22 |
Jan-23 |
Feb-23 |
Mar-23 |
Apr-23 |
May-23 |
Jun-23 |
Jul-23 |
Aug-23 |
Sep-23 |
Oct-23 |
|
|
|
|
|
|
|
|
|
|
|
|
|
|
|
| |
|
| |
|
|
|
|
|
|
|
|
|
|
|
Release Schedule | 2022 |
|
|
S&P Case-Shiller HPI | Real Estate |
|
Today's Week |
|
|
|
|
|
|
|
|
|
|
|
|
|
S&P Case-Shiller - 20-City Adjusted M/M and Unadjusted M/M Y/Y (At 9:00)
| SCHEDULE 2022 |
No 1 |
No 2 |
No 3 |
No 4 |
No 5 |
No 6 |
No 7 |
No 8 |
No 9 |
No 10 |
No 11 |
No 12 |
| Release | Week |
|
|
|
|
|
|
|
|
|
|
|
|
| Release | Date |
|
|
|
|
|
|
|
|
|
|
|
|
| Release | Day |
|
|
|
|
|
|
|
|
|
|
|
|
|
|
|
|
|
|
|
|
|
|
|
|
|
| Prior: |
0.9% |
1.0% |
1.1% |
1.4% |
2.4% |
2.4% |
1.8% |
1.5% |
0.4% |
-0.8% |
-1.6% |
-1.5% |
| Prior Revised: |
1.0% |
... |
1.0% |
... |
2.5% |
... |
1.7% |
... |
... |
... |
... |
... |
| Consensus: |
1.0% |
0.8% |
1.0% |
1.5% |
1.6% |
1.8% |
1.6% |
... |
... |
... |
... |
... |
| Consensus Low: |
1.0% |
0.7% |
0.5% |
1.4% |
0.9% |
1.6% |
1.5% |
... |
... |
... |
... |
... |
| Consensus High: |
1.3% |
0.8% |
1.0% |
1.5% |
3.1% |
2.0% |
2.1% |
... |
... |
... |
... |
... |
| ACTUAL SA M/M: |
1.2% |
1.1% |
1.4% |
2.4% |
3.1% |
1.8% |
1.3% |
0.4% |
-0.8% |
-1.6% |
-1.5% |
-0.8% |
|
|
|
|
|
|
|
|
|
|
|
|
|
| Prior: |
18.4% |
18.3% |
18.6% |
19.1% |
20.2% |
21.2% |
21.2% |
20.5% |
18.6% |
16.1% |
13.1% |
10.4% |
| Prior Revised: |
... |
... |
... |
... |
20.3% |
21.1% |
21.2% |
... |
18.7% |
16.0% |
... |
... |
| Consensus Y/Y: |
18.0% |
18.0% |
18.4% |
19.2% |
20.5% |
21.0% |
21.0% |
... |
17.0% |
|
|
|
| Consensus Low: |
17.8% |
17.9% |
17.0% |
18.4% |
19.0% |
21.0% |
20.8% |
... |
16.0% |
13.7% |
10.5% |
8.0% |
| Consensus High: |
18.4% |
18.3% |
18.7% |
19.3% |
20.8% |
21.9% |
21.1% |
... |
18.6% |
17.0% |
14.4% |
9.1% |
| ACTUAL SA Y/Y: |
18.3% |
18.6% |
19.1% |
20.2% |
21.2% |
21.2% |
20.5% |
18.6% |
16.1% |
13.1% |
10.4% |
8.6% |
| RATING |
|
|
|
|
|
|
|
|
|
|
|
|
| Month For: |
Nov 21 |
Dec 21 |
Jan-22 |
Feb-22 |
Mar-22 |
Apr-22 |
May-22 |
Jun-22 |
Jul-22 |
Aug-22 |
Sep-22 |
Oct-22 |
|
|
|
|
|
|
|
|
|
|
|
|
|
|
|
| |
|
| |
|
|
|
|
|
|
|
|
|
|
|
Release Schedule | 2021 |
|
|
S&P Case-Shiller HPI | Real Estate |
|
Today's Week |
|
|
|
|
|
|
|
|
|
|
|
|
|
S&P Case-Shiller - 20-City Adjusted M/M and Unadjusted M/M Y/Y (At 9:00)
| SCHEDULE 2021 |
No 1 |
No 2 |
No 3 |
No 4 |
No 5 |
No 6 |
No 7 |
No 8 |
No 9 |
No 10 |
No 11 |
No 12 |
| Release | Week |
|
|
|
|
|
|
|
|
|
|
|
|
| Release | Date |
|
|
|
|
|
|
|
|
|
|
|
|
| Release | Day |
|
|
|
|
|
|
|
|
|
|
|
|
|
|
|
|
|
|
|
|
|
|
|
|
|
| Prior: |
0.7% |
1.4% |
1.3% |
1.2% |
1.2% |
1.6% |
1.6% |
1.8% |
2.2% |
1.5% |
1.4% |
1.0% |
| Prior Revised: |
... |
... |
... |
... |
... |
... |
... |
... |
... |
... |
... |
... |
| Consensus: |
0.7% |
1.0% |
1.1% |
1.1% |
1.1% |
1.2% |
1.5% |
1.6% |
1.6% |
1.5% |
1.1% |
1.0% |
| Consensus Low: |
0.5% |
0.7% |
0.6% |
1.0% |
0.9% |
1.1% |
1.0% |
1.0% |
1.0% |
1.0% |
0.9% |
0.7% |
| Consensus High: |
0.9% |
1.2% |
1.3% |
1.1% |
1.6% |
1.3% |
1.7% |
1.8% |
1.8% |
1.7% |
1.5% |
1.1% |
| ACTUAL SA M/M: |
1.4% |
1.3% |
1.2% |
1.2% |
1.6% |
1.6% |
1.8% |
2.2% |
1.5% |
1.2% |
1.0% |
0.9% |
|
|
|
|
|
|
|
|
|
|
|
|
|
| ACTUAL SA Y/Y: |
9.1% |
10.1% |
11.1% |
11.9% |
13.3% |
14.9% |
16.8% |
18.6% |
19.7% |
19.8% |
19.5% |
18.4% |
| RATING |
|
|
|
|
|
|
|
|
|
|
|
|
| Month For: |
Nov 20 |
Dec 20 |
Jan-21 |
Feb-21 |
Mar-21 |
Apr-21 |
May-21 |
Jun-21 |
Jul-21 |
Aug-21 |
Sep-21 |
Oct-21 |
|
|
|
|
|
|
|
|
|
|
|
|
|
|
|
| |
|
| |
|
Legends: |
 |
Delayed |
 |
Positive View |
 |
Negative View |
 |
Neutral View |
 |
Non Available |
|
|
|
|
|
|
|
|
|
|
|
|
|
|
|
|
|
|
|
|
| |
|
|
|
|
|
|
|
|
|
|
|
|
|
|
|
|
|
|
|
|
|
Brief News | 2026 |
|
|
S&P Case-Shiller HPI | Real Estate |
|
Today's Week |
|
|
|
|
|
|
|
|
|
|
|
|
|
S&P Case-Shiller HPI (At 9:00 a.m ET)
| DATE/WEEK |
HIGHLIGHTS |
FOR |
Y/Y |
|
S&P Case-Shiller HPI |
No 12 |
... |
|
Oct-2026 |
|
| |
|
|
|
S&P Case-Shiller HPI |
No 11 |
... |
|
Sep-2026 |
|
| |
|
|
|
S&P Case-Shiller HPI |
No 10 |
... |
|
Aug-2026 |
|
| |
|
|
|
S&P Case-Shiller HPI |
No 9 |
... |
|
Jul-2026 |
|
| |
|
|
|
S&P Case-Shiller HPI |
No 8 |
... |
|
Jun-2026 |
|
| |
|
|
|
S&P Case-Shiller HPI |
No 7 |
... |
|
May-2026 |
|
| |
|
|
|
S&P Case-Shiller HPI |
No 6 |
... |
|
Apr-2026 |
|
| |
|
|
|
S&P Case-Shiller HPI |
No 5 |
... |
|
Mar-2026 |
|
| |
|
|
|
S&P Case-Shiller HPI |
No 4 |
... |
|
Feb-2026 |
|
| |
|
|
|
S&P Case-Shiller HPI |
No 3 |
... |
|
Jan-2026 |
|
| |
|
|
|
S&P Case-Shiller HPI |
No 2 |
... |
|
Dec-2025 |
|
| |
|
|
|
S&P Case-Shiller HPI |
No 1 |
1.4% |
|
Nov-2025 |
|
| |
|
|
|
|
|
|
|
|
| |
|
|
|
|
|
| |
|
|
|
|
|
|
|
|
|
|
|
|
|
|
|
Brief News | 2025 |
|
|
S&P Case-Shiller HPI | Real Estate |
|
Today's Week |
|
|
|
|
|
|
|
|
|
|
|
|
|
S&P Case-Shiller HPI | Real Estate
| DATE/WEEK |
HIGHLIGHTS |
FOR |
Y/Y |
|
In October 2025, the S&P Cotality Case-Shiller U.S. National Home Price NSA Index showed a 1.4% year-over-year increase, continuing a trend of cooling price growth. The national index stood at 328.98, while the 20-City Composite rose 1.3% annually, as high mortgage rates slowed market momentum and caused broad monthly declines across most cities. |
No 12 |
1.3% |
|
Oct-2025 |
|
| |
|
|
|
The S&P Cotality Case-Shiller U.S. National Home Price Index shows a 1.3% annual increase in September 2025, down from 1.4% in August, based on data released by S&P Dow Jones Indices.Inflation outpaced housing appreciation for the fourth consecutive month, with consumer prices running 1.7 percentage points higher than the home price index. The gap marks the widest since inflation and housing growth began diverging in June, according to S&P Dow Jones Indices. |
No 11 |
1.4% |
|
Sep-2025 |
|
| |
|
|
|
National growth in home values continues to slow, with prices now falling in 9 out of the 20 major metro areas tracked by a key index. The value of single-family homes in the U.S. as measured by repeat transactions rose 1.5% in August compared to a year earlier, according to data from the S&P Cotality Case-Shiller Index released Tuesday. That was down from the 1.7% gain registered in July and the slowest annual growth pace since 2023, when home values briefly declined. Among the 20 major metros tracked by Case-Shiller, home values fell on an annual basis in nine, all located in the South and West: Tampa, Phoenix, Miami, San Francisco, Dallas, Denver, San Diego, Seattle, and Los Angeles. |
No 10 |
1.6% |
|
Aug-2025 |
|
| |
|
|
|
US Home Price Growth Slows Further: Case-Shiller. Home prices declined in July as the benchmark national index fell for a fifth straight month. The seasonally adjusted home prices for the national index saw a 0.1% decrease month-over-month and a 1.8% increase year-over-year. This marks the sixth straight month annual gains have slowed and is the smallest annual increase since July 2023. After adjusting for inflation, the monthly change fell to -0.3% and annual change fell to -2.3%. Home Prices Fall for Fifth Straight Month. |
No 9 |
1.8% |
|
Jul-2025 |
|
| |
|
|
|
On August 26, 2025, S&P Dow Jones Indices released the June 2025 S&P Cotality Case-Shiller Home Price Indices, showing the U.S. National Index increased by 1.9% year-over-year, the 10-City Composite by 2.6%, and the 20-City Composite by 2.1%. These results indicated a continued, but slowing, pace of home price appreciation compared to previous months, influenced by factors like affordability constraints and regional demand differences. |
No 8 |
2.1% |
|
Jun-2025 |
|
| |
|
|
|
Home prices in the 20 biggest metros in the U.S. continued to slow as the housing market weakened under the weight of high mortgage rates and increasing unaffordability. The S&P CoreLogic Case-Shiller 20-city house price index fell 0.3% May compared with the previous month. |
No 7 |
2.8% |
|
May-2025 |
|
| |
|
|
|
Home price hikes are slowing more than expected. Rising supply and slowing demand in the housing market are finally causing prices to cool off, and the weakness is accelerating. Home prices nationally rose just 2.7% in April compared with the previous year, according to the S&P CoreLogic Case-Shiller Index released Tuesday. That is down from a 3.4% annual increase in March and is the smallest gain in nearly two years. Higher mortgage rates, which shot over 7% in April and have settled back just under that mark since then, are keeping potential monthly payments near generational highs and pricing out significant pools of buyers, especially first-timers. The supply of homes for sale is rising sharply, but isstill below pre-pandemic levels. Just 6% of sellers are at risk of selling at a loss, according to a new report from Redfin. That is slightly higher than a year ago, but still historically low. |
No 6 |
3.4% |
|
Apr-2025 |
|
| |
|
|
|
The 20-City Composite posted a year-over-year increase of 4.1%, down from a 4.5% increase in the previous month. New York again reported the highest annual gain among the 20 cities with an 8% increase in March, followed by Chicago and Cleveland with annual increases of 6.5% and 5.9%, respectively. Tampa posted the lowest return, falling 2.2%. The leading measure of U.S. home prices recorded a 3.4% annual gain in March 2025, a slight decrease from the previous reading in February 2025. |
No 5 |
4.1% |
|
Mar-2025 |
|
| |
|
|
|
The 20-City Composite posted a year-over-year increase of 4.5%, down from a 4.7% increase in the previous month. New York again reported the highest annual gain among the 20 cities with a 7.7% increase in February, followed by Chicago and Cleveland with annual increases of 7.0% and 6.6%, respectively. Tampa posted the lowest return, falling 1.5%. The leading measure of U.S. home prices recorded a 3.9% annual gain in February 2025, a slight decrease from the previous reading in January 2025. |
No 4 |
4.5% |
|
Feb-2025 |
|
| |
|
|
|
Sale prices for homes in the biggest U.S. cities increased at a slightly faster-than-expected pace in January, according to the latest S&P CoreLogic Case-Shiller measurement. For the measure’s 20-City Composite Index, prices accelerated at a 4.7% annual pace, up from 4.5% in December and 0.1 percentage point better than the Dow Jones consensus forecast. However, prices for the 20-city index rose just 0.1% on a monthly basis. On a national basis, the index showed a 4.1% annual increase in January, nudging up 0.1 percentage point on a monthly basis. |
No 3 |
4.7% |
|
Jan-2025 |
|
| |
|
|
|
The 20-City Composite posted a year-over-year increase of 4.5%, up from a 4.3% increase in the previous month. New York again reported the highest annual gain among the 20 cities with a 7.2% increase in December, followed by Chicago and Boston with annual increases of 6.6% and 6.3%, respectively. Tampa posted the lowest return, falling 1.1%. The leading measure of U.S. home prices recorded a 3.9% annual gain in December 2024, a slight increase from the previous annual gains in 2024 |
No 2 |
4.5% |
|
Dec-2024 |
|
| |
|
|
|
The 20-City Composite posted a year-over-year increase of 4.3%, up from a 4.2% increase in the previous month. New York again reported the highest annual gain among the 20 cities with a 7.3% increase in November, followed by Chicago and Washington with annual increases of 6.2% and 5.9%, respectively. Tampa posted the lowest return, falling 0.4%. |
No 1 |
4.3% |
|
Nov-2024 |
|
| |
|
|
|
|
|
|
|
|
| |
|
Buscar en cnbc |
|
|
|
| |
|
|
|
|
|
|
|
|
|
|
|
|
|
|
|
Brief News | 2024 |
|
|
S&P Case-Shiller HPI | Real Estate |
|
Today's Week |
|
|
|
|
|
|
|
|
|
|
|
|
|
S&P Case-Shiller HPI | Real Estate
| DATE/WEEK |
HIGHLIGHTS |
FOR |
Y/Y |
|
The S&P CoreLogic Case-Shiller U.S. National Home Price NSA Index, covering all nine U.S. census divisions, reported a 3.6% annual return for October, down from a 3.9% annual gain in the previous month. The 10-City Composite saw an annual increase of 4.8%, down from a 5.2% annual increase in the previous month. The 20-City Composite posted a year-over-year increase of 4.2%, dropping from a 4.6% increase in the previous month. New York again reported the highest annual gain among the 20 cities with a 7.3% increase in October, followed by Chicago and Las Vegas with annual increases of 6.2% and 5.9%, respectively. Tampa posted the smallest year-over-year growth with 0.4% |
No 12 |
4.2% |
|
Oct-2024 |
|
| |
|
|
|
Home-price growth has ‘stalled,’ Case-Shiller says . Home prices are appreciating less rapidly in the 20 largest U.S. cities. Home prices in the 20 biggest U.S. metropolitan areas lost more steam in September 2024, buckling under the pressure of high mortgage rates and historic unaffordability. September 2024 marked the sixth consecutive month of slowing annual appreciation. The S&P CoreLogic Case-Shiller 20-city house-price index rose 0.2% in September, compared with the previous month. The Case-Shiller index tracks home prices across the nation. The data generally reports with a two-month delay. 20-City Adjusted - M/M + 0.2%, 20-City Unadjusted - M/M -0.3% and 20-City Unadjusted - Yearly +4.6%. The index’s 20-city measuring home prices in the largest U.S. cities – reported monthly rises of 0.2%. Year-over-year, the 20-city composite posted increase of 4.6%. |
No 11 |
4.6% |
|
Sep-2024 |
|
| |
|
|
|
The S&P CoreLogic Case-Shiller U.S. National Home Price NSA Index, covering all nine U.S. census divisions, reported a 4.2% annual return for August, down from a 4.8% annual gain in the previous month. The 10-City Composite saw an annual increase of 6.0%, down from a 6.8% annual increase in the previous month. The 20-City Composite posted a year-over-year increase of 5.2%, dropping from a 5.9% increase in the previous month. New York again reported the highest annual gain among the 20 cities with an 8.1% increase in August, followed by Las Vegas and Chicago with annual increases of 7.3% and 7.2%, respectively. Denver posted the smallest year-over-year growth of 0.7%. MONTH-OVER-MONTH: The pre-seasonally adjusted U.S. National Index, 20-City Composite, and 10-City Composite upward trends reversed in August, with a -0.1% drop for the national index, and the 20-City and 10-City Composites saw -0.3% and -0.4% returns for this month, respectively. After seasonal adjustment, the U.S. National Index posted a month-over-month increase of 0.3%, while the 20-City and 10-City Composite reported a monthly rise of 0.4% and 0.3%, respectively. |
No 10 |
|
|
Aug-2024 |
|
| |
|
|
|
Home prices grew at the slowest pace in 8 months, Case Shiller says, but still inch up to new record high. Major real-estate markets are seeing home-price rises slow, S&P says. Home prices in the 20 biggest U.S. metro areas set yet another record high in July, but the pace of price rises has decelerated significantly as prices and mortgage rates weigh on home buyers. The S&P CoreLogic Case-Shiller 20-city house-price index rose 0.3% in July compared to the previous month. Case-Shiller Home Prices Tick in Lower Than Expectations. Case-Shiller Home Prices Increase, but Miss Estimates The definitive measure on home prices is the Case-Shiller index, reported a month in arrears from most other housing data (in this case, July). Overall, we see +5% growth in home price data for mid-summer, but this is lower than the +6% analysts had been expecting, and below the downwardly revised +5.5% the previous month. Breaking the findings down into the two separate indexes, the 10-city survey saw home prices up +6.8% for July, +5.9% on the 20-city. Among region leaders, New York led the way that month: +8.8%, followed by Las Vegas at +8.2%. Of course, this data is still well within the high mortgage rate environment that we see coming down rather rapidly, looking ahead. With a lowering Fed funds rate, this will establish lower mortgage rates over time. Considering pent-up demand over the past couple years of high mortgage rates, we may also expect to see more activity in the Existing Home Sales space, which may put pressure on new homebuilders. |
No 9 |
5.9% |
|
Jul-2024 |
|
| |
|
|
|
Home prices hit record high in June on S&P Case-Shiller Index. Even as mortgage interest rates were rising, home prices reached the highest level ever on the S&P CoreLogic Case-Shiller U.S. National Home Price Index. On a three-month running average ended in June, prices nationally were 5.4% higher than they were in June 2023, according to data released Tuesday. Despite being a record high for the index, the annual gain was smaller than May’s 5.9% reading. The index’s 10-city composite rose 7.4% annually, down from 7.8% in the previous month. The 20-city composite was 6.5% higher year over year, down from a 6.9% increase in May. Prices nationally were 5.4% higher than June 2023. US home prices Seasonally Adjusted prices +0.4% month over month. Unadjusted +0.6% month over month. Unadjusted +6.5% year over year, for Jun-2024, according to the S&P CoreLogic Case-Shiller national home price index. |
No 8 |
6.5% |
|
Jun-2024 |
|
| |
|
|
|
US home prices Seasonally Adjusted prices +0.3% month over month. Unadjusted +1.0% month over month. Unadjusted +6.8% year over year, for May-2024, according to the S&P CoreLogic Case-Shiller national home price index. Case-Shiller home-price index hits another all-time high. The S&P CoreLogic Case-Shiller Home Price Index for May jumped by 5.9% year over year, the third month in a row that the index has posted a new record. While the pace of annualized growth dropped slightly compared to April, the year-to-date growth of the index sits at 4.1%, the fastest start in two years. Home prices typically decline over the course of the second half of the year, but we may see a notably steeper seasonal decline this year. The main reason home prices will moderate is an increase in supply. At the end of May, the inventory of existing homes was up by nearly 20% compared to a year ago. New home inventory hit its highest level since 2008. S&P’s 10-city and 20-city composite indices outpaced the yearly growth at the national level at 7.7% and 6.8%, respectively. This suggests that larger markets are a driver of gains at the national level. |
No 7 |
6.8% |
|
May-2024 |
|
| |
|
|
|
US home prices Seasonally Adjusted prices +0.4% month over month. Unadjusted +1.4% month over month. Unadjusted +7.2% year over year, for Apr-2024, according to the S&P CoreLogic Case-Shiller national home price index. Prices in April rose 6.3% compared with April 2023, according to the S&P CoreLogic Case-Shiller National Home Price Index. Home prices are now 47% higher than they were in early 2020, with the median sale price now five times the median household income. Home prices set another record in April, even as mortgage rates rose and the supply of homes for sale increased. Usually, under those circumstances, prices would weaken, but today’s housing market is unlike any other in recent history. Prices in April rose 6.3% compared with the year-earlier month, according to the S&P CoreLogic Case-Shiller National Home Price Index. It marks the second straight month that the national index jumped at least 1% over its previous all-time high. |
No 6 |
7.2% |
|
Apr-2024 |
|
| |
|
|
|
US home prices Seasonally Adjusted prices +0.3% month over month. Unadjusted +1.6% month over month. Unadjusted +7.4% yer over year, for Mar-2024, according to the S&P CoreLogic Case-Shiller national home price index. Home prices reach new high in March, Case-Shiller says, fueled by scarcity. We’ve witnessed records repeatedly break in both stock and housing markets over the past year. Case-Shiller index tracks home prices across the nation. The data generally reports with a two-month delay. Home prices in the 20 biggest U.S. metros hit another all-time high, as the housing market remains hampered by a low number of properties for sale. The S&P CoreLogic Case-Shiller 20-city house price index rose 0.3% in March compared to the previous month. |
No 5 |
7.4% |
|
Mar-2024 |
|
| |
|
|
|
Home prices soar even higher in February, despite higher mortgage rates, says S&P Case-Shiller. Home prices in February jumped 6.4% year over year, according to the S&P CoreLogic Case-Shiller national home price index. It marked another increase after the prior month’s annual gain of 6%, and the fastest rate of price growth since November 2022. Prices in San Diego saw the biggest rise among the 20 cities in the index, up 11.4% from February of 2023. Both Chicago and Detroit reported 8.9% annual increases. US home prices Seasonally Adjusted prices +0.6% month over month. Unadjusted +0.9% month over month. Unadjusted +7.3% year over year, for Feb-2024, according to the S&P CoreLogic Case-Shiller national home price index. |
No 4 |
7.3% |
|
Feb-2024 |
|
| |
|
|
|
US home prices Seasonally Adjusted prices +0.1% month over month. Unadjusted -0.1% month over month. Unadjusted +6.6% yer over year, for Jan-2024, according to the S&P CoreLogic Case-Shiller national home price index. The S&P CoreLogic Case-Shiller U.S. National Home Price NSA Index, covering all nine U.S. census divisions, reported a 6.0% annual gain in January, up from a 5.6% rise in the previous month. The 10- City Composite showed an increase of 7.4%, up from a 7.0% increase in the previous month. The 20- City Composite posted a year-over-year increase of 6.6%, up from a 6.2% increase in the previous month. San Diego again reported the highest year-over-year gain among the 20 cities with an 11.2% increase in January, followed by Los Angeles, with an increase of 8.6%. Portland, though holding the lowest rank after reporting the smallest year-over-year growth, retained an upward trend with a 0.9% increase this month. The U.S. National Index and the 20-City Composite showed a continued decrease of 0.1%, and 10-City Composite remained unchanged in January. After seasonal adjustment, the U.S. National Index, the 20-City Composite, and the 10-City Composite all posted month-over-month increases of 0.4%, 0.1%, and 0.2% respectively. U.S. home prices continued their drive higher. |
No 3 |
6.6% |
|
Jan-2024 |
|
| |
|
|
|
US home prices Seasonally Adjusted prices +0.2% month over month. Unadjusted -0.3% month over month. Unadjusted +6.1% yer over year, for Dec-2023, according to the S&P CoreLogic Case-Shiller national home price index. |
No 2 |
6.1% |
|
Dec-2023 |
|
| |
|
|
|
Home prices in November 2023 fell 0.2% unadjusted m/m from October, according to the S&P CoreLogic Case-Shiller national home price index. US home prices Seasonally Adjusted prices +0.1% month over month. Unadjusted -0.2% month over month and Unadjusted +5.4% yer over year. While that may not seem like a lot, it is the first monthly drop since January 2023. Mortgage rates rose sharply in October to their highest level in more than 20 years, making houses hard to afford. Seattle and San Francisco reported the largest monthly price declines, falling 1.4% and 1.3%, respectively. Meanwhile, six cities registered a new all-time high in November. Those were Miami; Tampa, Florida; Atlanta; Charlotte, North Carolina; New York; and Cleveland. Prices nationally were still higher than the year before, and those annual gains increased again relative to the prior month. They rose 5.1% from November 2022, up from a 4.7% annual increase in October. The 10-city composite climbed 6.2%, up from a 5.7% advance in October. The 20-city composite rose 5.4%, up from a 4.9% increase in the previous month. |
No 1 |
5.4% |
|
Nov-2023 |
|
| |
|
|
|
|
|
|
|
|
| |
|
|
|
|
|
| |
|
|
|
|
|
|
|
|
|
|
|
|
|
|
|
Brief News | 2023 |
|
|
S&P Case-Shiller HPI | Real Estate |
|
Today's Week |
|
|
|
|
|
|
|
|
|
|
|
|
|
Leading Indicators (LEI) | Business Actvity
| DATE/WEEK |
HIGHLIGHTS |
FOR |
ACTUAL |
|
October home prices post biggest gain of 2023, despite higher mortgage rates, says S&P Case-Shiller. Home prices rose 4.8% nationally in October compared with October 2022, according to the S&P CoreLogic Case-Shiller home price index. That’s a jump from the 4% annual increase in September and marks the strongest annual gain seen in 2023. Among the top 20 cities, Detroit reported the largest year-over-year gain in home prices at 8.1% in October. US home prices Seasonally Adjusted prices +0.6% month over month. Unadjusted +0.1% month over month. Unadjusted +4.9% year over year, for Oct-2023, according to the S&P CoreLogic Case-Shiller national home price index. |
No 12 |
4.9% |
|
Oct-2023 |
|
| |
|
|
|
Seasonally Adjusted prices +0.7% month over month. Unadjusted +0.2% month over month. Unadjusted +3.9% year over year, for Sep-2023, according to the S&P CoreLogic Case-Shiller national home price index. Home prices kept rising even as mortgage rates surged, S&P Case-Shiller says. Home prices were 3.9% higher in September compared with the same month a year earlier, according to the S&P CoreLogic Case-Shiller Index. The growth coincided with the 30-year fixed mortgage rate’s climb toward 8%. Rents are easing, however, while home prices rise. Higher mortgage rates appear to be doing very little to cool home prices. Nationally, prices were 3.9% higher in September compared with the same month a year earlier, up from a 2.5% annual gain in August, according to the S&P CoreLogic Case-Shiller Index. This occurred as the average rate on the 30-year fixed mortgage climbed toward 8%. |
No 11 |
3.9% |
|
Sep-2023 |
|
| |
|
|
|
Seasonally Adjusted prices +1.0% month over month. Unadjusted +0.4% month over month. Unadjusted +2.2% year over year, for Aug-2023, according to the S&P CoreLogic Case-Shiller national home price index. |
No 10 |
|
|
Aug-2023 |
|
| |
|
|
|
Seasonally Adjusted prices +0.9% month over month. Unadjusted +0.6% month over month. Unadjusted +0.1% year over year, for Jul-2023, according to the S&P CoreLogic Case-Shiller national home price index. |
No 9 |
0.1% |
|
Jul-2023 |
|
| |
|
|
|
U.S. home prices rose on a monthly basis in June while annual prices were unchanged, adding to a growing body of evidence that housing costs have already begun to recover. The S&P CoreLogic Case-Shiller national home price index, which covers all nine U.S. census divisions, increased month over month by 0.7% in June on a seasonally adjusted basis after rising by 0.8% in May. Another index tracking the 20 largest metro areas rose 0.9% on a monthly basis, topping estimates in a Reuters poll of economists for a 0.8% gain. On a year-over-year basis, the national price index was unchanged in June versus a 0.4% fall in May. The 20-city index was down by 1.2% in June after sliding 1.7% annually in May, a possible sign that an anticipated bottoming in prices could be materializing. US home prices Seasonally Adjusted prices +0.9% month over month. Unadjusted +0.9% month over month. Unadjusted -1.2% year over year, for Jun-2023, according to the S&P CoreLogic Case-Shiller national home price index. |
No 8 |
-1.2% |
|
Jun-2023 |
|
| |
|
|
|
Seasonally Adjusted prices +1.0% month over month. Unadjusted +1.5% month over month. Unadjusted -1.7% year over year, for May-2023, according to the S&P CoreLogic Case-Shiller national home price index. Home prices continue to climb with ‘striking’ regional differences, says S&P Case-Shiller. Prices nationally rose 0.7% month to month, seasonally adjusted. The index’s 10-city composite fell 1%, year over year, slightly less than the 1.1% decrease in the previous month. The 20-city composite dropped 1.7%, the same as the annual decline in April. Home prices in May rose for the fourth straight month on the S&P CoreLogic Case-Shiller home price index, but regional differences are widening. The gains come despite a sharp jump in mortgage interest rates during the month. Prices nationally rose 0.7% month to month, seasonally adjusted. The index’s 10-city composite gained 1.1%, and the 20-city composite gained 1%. Prices nationally were still down 0.5% compared with May 2022, but they are just 1% below their June 2022 peak. The 10-city composite fell 1%, year over year, slightly less than the 1.1% decrease in the previous month. The 20-city composite dropped 1.7%, the same as the annual decline in April. |
No 7 |
-1.7% |
|
May-2023 |
|
| |
|
|
|
Seasonally Adjusted prices +0.9% month over month. Unadjusted +1.7% month over month. Unadjusted -1.7% year over year, for Mar-2023, according to the S&P CoreLogic. Home prices rose for third straight month in April, S&P Case-Shiller index says. Home prices in April were 0.5% higher month to month, after seasonal adjustments. Prices are now just 2.4% below their June 2022 peak. Home prices peaked last June, falling sharply through the beginning of this year. Now, they’re recovering steadily. Home prices in April were still down 0.2% compared with April 2022, according to the S&P CoreLogic Case-Shiller national home price index. They were, however, 0.5% higher month to month, after seasonal adjustments. Prices are now just 2.4% below their June 2022 peak. |
No 6 |
-1.7% |
|
Apr-2023 |
|
| |
|
|
|
Seasonally Adjusted prices +0.5% month over month. Unadjusted +1.5% month over month. Unadjusted -1.1% year over year, for Mar-2023, according to the S&P CoreLogic Home price declines may be over, S&P Case-Shiller says. Nationally, home prices in March were 0.7% higher than March 2022, S&P CoreLogic Case-Shiller Indices said. After seasonal adjustment, prices increased nationally 0.4% in March compared with February. The 10-city composite gained 0.6% and 20-city composite rose 0.5%. Steep competition in the housing market and low supply are heating up home prices again. Nationally, home prices in March were 0.7% higher than March 2022, S&P CoreLogic Case-Shiller Indices said Tuesday. The 10-city composite, which includes the Los Angeles and New York metropolitan areas, dropped 0.8% year over year, compared with a 0.5% increase in the previous month. The 20-city composite, which includes Dallas-Fort Worth and the Detroit area, fell 1.1%, down from a 0.4% annual gain in the previous month. |
No 5 |
-1.1% |
|
Mar-2023 |
|
| |
|
|
|
Seasonally Adjusted prices +0.1% month over month. Unadjusted +0.2% month over month. Unadjusted +0.4% year over year, for Feb-2023, according to the S&P CoreLogic Case-Shiller national home price index. |
No 4 |
0.4% |
|
Feb-2023 |
|
| |
|
|
|
Seasonally Adjusted prices -0.4% month over month. Unadjusted -0.5% month over month. Unadjusted +2.5% year over year, for Jan-2023, according to the S&P CoreLogic Case-Shiller national home price index. |
No 3 |
2.5% |
|
Jan-2023 |
|
| |
|
|
|
Seasonally Adjusted prices -0.5% month over month. Unadjusted -0.9% month over month. Unadjusted +4.6% year over year, for Dec-2022, according to the S&P CoreLogic Case-Shiller national home price index.Home price gains weakened sharply to end 2022, according to S&P Case-Shiller. Higher mortgage rates weighed on home price gains in December. Home prices in December were 5.8% higher than the previous December, according to S&P Case-Shiller. That’s down from a 7.6% annual gain in November. Prices are now 4.4% below their June peak. Higher mortgage rates weighed on home price gains at the end of 2022. While prices were still higher than they were a year earlier, the rate of increase slowed quickly, according to data released Tuesday. Home prices in December were 5.8% higher than the previous December, according to the S&P CoreLogic Case-Shiller U.S. National Home Price NSA Index. That is down from a 7.6% annual gain in November. Prices are now 4.4% below their June peak. |
No 2 |
4.6% |
|
Dec-2022 |
|
| |
|
|
|
Seasonally Adjusted prices -0.5% month over month. Unadjusted -0.8% month over month. Unadjusted +6.8% year over year, for Nov-2022, according to the S&P CoreLogic Case-Shiller national home price index. |
No 1 |
6.8% |
|
Nov-2022 |
|
| |
|
|
|
|
|
|
|
|
| |
|
|
|
|
|
| |
|
|
|
|
|
|
|
|
|
|
|
|
|
|
|
Brief News | 2021-2022 |
|
|
S&P Case-Shiller HPI | Real Estate |
|
Today's Week |
|
|
|
|
|
|
|
|
|
|
|
|
|
S&P Case-Shiller HPI
| DATE/WEEK |
HIGHLIGHTS |
FOR |
Y/Y |
|
Unadjusted -0.8% month over month. Unadjusted +8.6% year over year, for Oct-2022, according to the S&P CoreLogic Case-Shiller national home price index. Annual price growth in the increasingly fragile U.S. housing market slid into the single digits in October for the first time in about two years when mortgage rates that month surged above 7 percent and further stifled demand, a pair of closely watched surveys showed on Tuesday. The S&P CoreLogic Case Shiller national home price index increased by 9.2 percent in October, down from 10.7 percent in September and notching the first single-digit gain since November 2020. |
No 12 |
8.6% |
|
Oct-2022 |
|
| |
|
|
|
Unadjusted -1.5% month over month. Unadjusted +10.4% year over year, for Sep-2022, according to the S&P CoreLogic Case-Shiller national home price index. |
No 11 |
10.4% |
|
Sep-2022 |
|
| |
|
|
|
Unadjusted -1.6% month over month. Unadjusted +13.1% year over year, for Aug-2022, according to the S&P CoreLogic Case-Shiller national home price index. Home prices were found to have cooled at a record pace in August, according to the latest S&P CoreLogic Case-Shiller U.S. National Home Price Index. Prices in August were 13 percent higher nationally compared to August 2021, but that is down from a 15.6 percent annual gain in the previous month. The 2.6-percent difference was the largest deceleration in the history of the index going back to 1987.
|
No 10 |
13.1% |
|
Aug-2022 |
|
| |
|
|
|
Unadjusted -0.8% month over month. Unadjusted +16.1% year over year, for Jul-2022, according to the S&P CoreLogic Case-Shiller national home price index. Home prices cooled in July at the fastest rate in the history of S&P Case-Shiller Index. The 10-City composite rose 14.9% year over year, down from 17.4% in June. The 20-City composite gained 16.1%, down from 18.7% in the previous month. Tampa, Miami and Dallas saw the highest annual gains among the 20 cities in July, with increases of 31.8%, 31.7% and 24.7%, respectively. U.S. home prices cooled in July at the fastest rate in the history of the S&P CoreLogic Case-Shiller Index, according to a report released Tuesday. Home prices in July were still higher than they were a year ago, but cooled significantly from June gains. Prices nationally rose 15.8% over July 2021, well below the 18.1% increase in the previous month, according to the report. The 20-City composite, which adds regions such as the Seattle metro area and greater Detroit, gained 16.1%, down from 18.7% in the previous month. July’s year-over-year gains were lower compared with June in each of the cities covered by the index. |
No 9 |
16.1% |
|
Jul-2022 |
|
| |
|
|
|
Home prices weakened in June 2022, but were still much higher than a year ago, says S&P Case Shiller. Home prices in June 2022 were 18% higher than during the same month last year, according to the S&P CoreLogic Case-Shiller Indices. That’s a weaker pace than in May 2022 of this year, which showed an 19.9% annual gain. Home prices in June were 18% higher than during the same month last year, according to the S&P CoreLogic Case-Shiller Indices. That’s a weaker pace than in May of this year, which showed an 19.9% annual gain. The 10-city composite rose 17.4%, down from 19.1% in the previous month. The 20-city composite was higher 18.6% year-over-year, down from 20.5% in May 2022. It’s important to bear in mind that deceleration and decline are two entirely different things, and that prices are still rising at a robust clip, While the drop may seem small, it is the largest single-month decline in prices since January 2011. It is also the second-worst July performance dating back to 1991, behind the 0.9% decline in July 2010, during the Great Recession. We’ve noted previously that mortgage financing has become more expensive as the Federal Reserve ratchets up interest rates, a process that continued as our June data were gathered. As the macroeconomic environment continues to be challenging, home prices may well continue to decelerate. |
No 8 |
18.6% |
|
Jun-2022 |
|
| |
|
|
|
Home price growth slowed for the second straight month in May 2022, S&P Case-Shiller says. Home prices in May 2022 were 19.7% higher compared with the same month last year, according to the S&P CoreLogic Case-Shiller National Home Price Index. This marks the second month of slower increases, as the housing market cools due to higher mortgage rates and increasing concern over inflation. In April, the annual gain was 20.6%. Home prices in May were 19.7% higher compared with the same month last year, according to the S&P CoreLogic Case-Shiller National Home Price Index. This marks the second month of slower increases, as the housing market cools due to higher mortgage rates and increasing concern over inflation. In April, the annual gain was 20.6%. The 10-city composite rose 19% year over year, down from 19.6% in the previous month. The 20-city composite increased 20.5%, down from 21.2% in April. Despite this deceleration, growth rates are still extremely robust, with all three composites at or above the 98th percentile historically. |
No 7 |
20.5% |
|
May-2022 |
|
| |
|
|
|
Home price increases slowed in April 2022 for the first time in months, S&P Case-Shiller says. Prices rose 20.4% nationally in April compared with the same month a year ago, according to the S&P CoreLogic Case-Shiller Index. In March, home prices grew 20.6%. The last slight deceleration was in November of last year. In a change from the last five months, when most of the 20 cities saw month-to-month price gains, only nine cities saw prices rise faster in April than they had done in March. Home price increases slowed ever so slightly in April, but it is the first potential sign of a cooling in prices. Prices rose 20.4% nationally in April compared with the same month a year ago, according to the S&P CoreLogic Case-Shiller Index. In March, home prices grew 20.6%. The last slight deceleration was in November of last year. The 10-city composite annual increase was 19.7%, up from 19.5% in March. The 20-city composite posted a 21.2% annual gain, up from 21.1% in the previous month. In a change from the last five months, when most of the 20 cities saw month-to-month price gains, only nine cities saw prices rise faster in April than they had done in March. Cities in the South continued to see the strongest monthly gains, including Charlotte, North Carolina; Tampa, Florida; Atlanta, Dallas and Miami. |
No 6 |
21.2% |
|
Apr-2022 |
|
| |
|
|
|
Home prices surged over 20% in March 2022 as interest rates also rose, according to S&P Case-Shiller. Rising mortgage rates did not slow down rising home prices in March. Nationally, home prices were 20.6% higher than they were in March 2021, according to the S&P CoreLogic Case-Shiller Home Price Index. That is higher than the 20% gain in February. The index is a three-month running average ending in March. The average rate on the 30-year fixed mortgage stood at 3.29% at the start of January and ended March at 4.67%, according to Mortgage News Daily. The Case-Shiller’s 10-city composite rose 19.5% annually in March, up from 18.7% in February. The 20-city composite saw a 21.2% year-over-year gain, up from 20.3% in the previous month. For both national and 20-city composites, March’s reading was the highest year-over-year price change in more than 35 years of data. |
No 5 |
21.2% |
|
Mar-2022 |
|
| |
|
|
|
Home prices jumped nearly 20% in February 2022, but slowdown may be coming, S&P Case-Shiller says. Home prices increased 19.8% in February 2022 year over year, according to the S&P CoreLogic Case-Shiller national home price index. The 10-city composite annual increase came in at 18.6%, up from 17.3% in the previous month. The 20-city composite was up 20.2%, up from 18.9% in the previous month. Phoenix, Tampa, Florida, and Miami saw annual home price gains of 32.9% 32.6% and 29.7% respectively. Home prices increased 19.8% in February year over year, according to the S&P CoreLogic Case-Shiller national home price index. That is up from the 19.1% annual increase in January and is the third-highest reading in the index’s 35-year history. The 10-city composite annual increase came in at 18.6%, up from 17.3% in the previous month. The 20-city composite was up 20.2%, up from 18.9% in the previous month. |
No 4 |
20.2% |
|
Feb-2022 |
|
| |
|
|
|
Home prices heated up to start the year, with huge surges in Arizona and Florida, says S&P Case-Shiller report. Home prices nationally rose 19.2% year over year in January, up from 18.9% in December, according to the S&P CoreLogic Case-Shiller Index. The 10-city composite annual increase was 17.5%, up from 17.1% in the previous month. The 20-city composite rose 19.1%, up from 18.6% in December. Phoenix, Tampa, Florida, and Miami saw the biggest annual gains at 32.6%, 30.8% and 28.1%, respectively. After cooling off ever so slightly toward the end of last year, home price gains reaccelerated in January. Home prices nationally rose 19.2% year over year in January, up from 18.9% in December, according to the S&P CoreLogic Case-Shiller Index. The 10-city composite annual increase was 17.5%, up from 17.1% in the previous month. The 20-city composite rose 19.1% Jan 2022, up from 18.6% in December. The macroeconomic environment is evolving rapidly. Declining COVID cases and a resumption of general economic activity has stoked inflation, and the Federal Reserve has begun to increase interest rates in response. We may soon begin to see the impact of increasing mortgage rates on home prices |
No 3 |
19.1% |
|
Jan-2022 |
|
| |
|
|
|
The 20-City Composite posted an 18.6% annual gain, up from 18.3% a month earlier. The 20-City results were higher than analysts’ expectations of an 18% annual gain, according to Bloomberg consensus estimates.A persistent low inventory of homes dropped to record low levels in December, according to a recent report from the National Association of Realtors. In the face of continued strong demand, prices were pushed higher. However, rising mortgage rates could start to quell some of that demand, Lazarra said. In the short term, we should soon begin to see the impact of increasing mortgage rates on home prices.Month-to-month, home prices in the US National Index, which covers all nine U.S. Census divisions, increased 1.3% in December from November, after seasonal adjustment. |
No 2 |
18.6% |
|
Dec-2021 |
|
| |
|
|
|
Home prices surged in November 2021, but at a slower rate than in October, S&P Case-Shiller says. Even as the housing market entered its traditionally slower season in November, home prices showed big gains from a year ago. Prices rose 18.8% year over year on the S&P CoreLogic Case-Shiller National Home Price Index. Yet that was a slower rate than the October 2021 pace, which was a 19% annual gain. The 10-city composite rose 16.8% annually, down from 17.2% in the previous month. The 20- city composite grew 18.3%, down from 18.5% in October 2021. |
No 1 |
18.3% |
|
Nov-2021 |
|
| |
|
|
|
|
U.S. home prices surge 18.4% in October 2021. The S&P CoreLogic Case-Shiller 20-city home price index, out Tuesday, climbed 18.4% in October from a year earlier. The gain marked a slight deceleration from a 19.1% year-over-year increase in September but was about in line with what economists had been expecting. All 20 cities posted double-digit annual gains. The National Association of Realtors reported last week that sales of previously occupied homes rose for the third straight month in November to a seasonally adjusted annual rate of 6.46 million. |
No 12 |
19.5% |
|
Oct-2021 |
|
| |
|
|
|
Home price gains slow down for the first time since May 2020. Home prices rose 19.5% in September year over year, down from a 19.8% annual gain in August 2021, according to the S&P CoreLogic Case-Shiller National Home Price Index. Home prices are still considerably higher than they were a year ago, when the pandemic caused a massive run on housing, but the gains are finally starting to ease up. That is the first decrease in the annual gain since May 2020. The 10-city composite rose 17.8% from a year ago, down from an 18.6% gain in August. The 20-city composite gained 19.1% year over year, down from 19.6% in the previous month.. |
No 11 |
18.4% |
|
Sep-2021 |
|
| |
|
|
|
U.S. single-family home prices rose less than expected in August 2021, posting the smallest monthly gain in more than a year, a closely watched survey said on Tuesday. The S&P CoreLogic Case Shiller composite index of 20 metropolitan areas rose 1.2% on a seasonally adjusted basis after posting a 1.5% increase in July 2021. It was the smallest monthly gain since July 2020 and was below the consensus estimate in a Reuters poll of economists for a gain of 1.5%. |
No 10 |
19.5% |
|
Aug-2021 |
|
| |
|
|
|
U.S. home prices soared in July 2021 by a record amount from a year earlier as buyers desperate for homes bid up prices amid a limited supply. The S&P CoreLogic Case-Shiller 20-city home price index surged 19.9% in July compared with a year ago, the largest gain on records dating back to 2000. In 17 of the 20 cities, prices rose more quickly in July than in June. And prices reached all-time highs in 19 of 20 cities. The one exception was Chicago, where prices are just 0.3% below their 2006 peak. Sales of new and existing homes have jumped this year, driven by low mortgage rates and a desire for more living space during the pandemic. |
No 9 |
19.8% |
|
Jul-2021 |
|
| |
|
|
|
The S&P CoreLogic Case-Shiller U.S. National Home Price Index® rose 18.6% year-over-year in June (non-seasonally adjusted), up from 16.8% in May. Annual growth was up from April in both the 20-city index (to 19.1%, from 17.1%) and 10-city index (to 18.5% from 16.6%). The slow rise in inventory that marked the beginning of summer wasn’t enough to cool the sizzling market, with the already rapidly rising Case-Shiller indices hitting the gas accelerating into the middle of the year instead of tapping the brakes. The national Case-Shiller Home Price Index rose 18.6% year-over-year in June. Annual growth in the smaller 20-city composite index exceeded the national pace (19.1%) and annual growth in the 10-city index (18.5%) almost matched national appreciation. The annual rate of growth was faster in June than in May in all three main indices. On a monthly (seasonally adjusted) basis, the national index was up 1.8% from May, while the 10- and 20-city indices were up 1.6% and 1.8% month-over-month, respectively. |
No 8 |
19.7% |
|
Jun-2021 |
|
| |
|
|
|
Housing price growth set a record for the second consecutive month in May 2021. S&P Corelogic Case-Shiller Index Reports Record High Annual Home Price Gain of 16.6% in May 2021. S&P Dow Jones Indices (S&P DJI) today released the latest results for the S&P CoreLogic Case-Shiller Indices, the leading measure of U.S. home prices. Data released today for May 2021 show that home prices continue to increase across the U.S. The S&P CoreLogic Case-Shiller U.S. National Home Price NSA Index, covering all nine U.S. census divisions, reported a 16.6% annual gain in May, up from 14.8% in the previous month. The S&P CoreLogic Case-Shiller U.S. National Home Price Index® rose 16.6% year-over-year in May (non-seasonally adjusted), up from 14.8% in April. |
No 7 |
16.6% |
|
May-2021 |
|
| |
|
|
|
Home prices in April 2021 saw an annual gain of 14.6% in April, up from a 13.3% increase in March, according to the S&P CoreLogic Case-Shiller National Home Price Index. Among larger cities covered by the index, the 10-city composite was up 14.4% year over year, up from 12.9% the previous month. The 20-city composite was 14.9% higher, up from 13.4% in March. Phoenix, San Diego, and Seattle reported the highest year-over-year gains. All were up over 20% from the year before. “April’s performance was truly extraordinary. The 14.6% gain in the National Composite is literally the highest reading in more than 30 years of S&P CoreLogic Case-Shiller data,” said Craig Lazzara, managing director and global head of index investment strategy at S&P DJI. |
No 6 |
19.7% |
|
Apr-2021 |
|
| |
|
|
|
Home prices in March 2021 were 13.2% higher in March 2021, compared with March 2020, according to the S&P CoreLogic Case-Shiller National Home Price Index. That’s up from the 12% annual gain in February, and it marks the 10th straight month of accelerating home prices. The March gain is the largest since December 2005 and is one of the largest in the index’s 30-year history. Prices are being pushed higher by incredibly strong competition in the market. High demand is butting up against near record-low supply, resulting in bidding wars for the vast majority of listings. The 10-city composite rose 12.8% year over year, up from 11.7% in the previous month. The 20-city composite increased 13.3%, up from 12% in February. |
No 5 |
16.6% |
|
Mar-2021 |
|
| |
|
|
|
Home prices in top 20 U.S. cities up nearly 12% in past year: Case-Shiller. Home price gains continue to outpace expectations, as tight supply and strong demand lead to bidding wars. Nationally, prices in February 2021 rose 12% year over year, up from 11.2% in January, according to the S&P CoreLogic Case-Shiller home price index. The 10-city composite rose 11.7% annually, up from 10.9% in January. The 20-city composite gained 11.9%, up from 11.1% in the previous month. All the gains were in the double digits, except Chicago and Las Vegas. |
No 4 |
19.7% |
|
Feb-2021 |
|
| |
|
|
|
Home-price growth accelerated to a 15-year high in January 2021, as the supply of homes for sale dropped to a new low. The S&P CoreLogic Case-Shiller National Home Price Index, which measures average home prices in major metropolitan areas across the nation, rose 11.2% in the year that ended in January, up from a 10.4% annual rate the prior month. January marked the highest annual rate of price growth since February 2006. House-buying demand remains robust due to record-low interest rates and a desire for more space. Sales of previously owned homes, which make up the bulk of the housing market, rose in 2020 to their highest annual level since 2006, according to the National Association of Realtors.... |
No 3 |
16.6% |
|
Jan-2021 |
|
| |
|
|
|
The S&P CoreLogic Case-Shiller U.S. National Home Price NSA Index, covering all nine U.S. census divisions, reported a 10.4% annual gain in December 2020, up from 9.5% in the previous month. The 10-City Composite annual increase came in at 9.8%, up from 8.9% in the previous month. The 20-City Composite posted a 10.1% year-over-year gain, up from 9.2% in the previous month. After seasonal adjustment, the U.S. National Index posted a month-over-month increase of 1.3%, while the 10-City and 20-City Composites both posted increases of 1.2% and 1.3% respectively. In December, 18 cities (excluding Detroit) reported increases before seasonal adjustment, while all 19 cities reported increases after seasonal adjustment. |
No 2 |
19.7% |
|
Dec-2020 |
|
| |
|
|
|
..S&P Case-Shiller Index Shows Annual Home Price Gains Climbed To 9.5% In November 2020.
The S&P CoreLogic Case-Shiller U.S. National Home Price NSA Index, covering all nine U.S. census divisions, reported a 9.5% annual gain in November, up from 8.4% in the previous month. The 10-City Composite annual increase came in at 8.8%, up from 7.6% in the previous month. The 20-City Composite posted a 9.1% year-over-year gain, up from 8.0% in the previous month. |
No 1 |
16.6% |
|
Nov-2020 |
|
| |
|
|
|
|
|
|
|
|
| |
|
|
|
|
|
| |
|
Legends: |
|
Delayed |
|
Positive View |
|
Negative View |
|
Neutral View |
|
Non Available |
|
|
|
|
|
|
|
|
|
|
|
|
|
|
|
|
|
|
|
|
| |
|
|
|
|
|
|
|
|
|
|
|
|
|
|
|
|
|
|
|
|
|
Definitions | Explain |
|
|
S&P Case-Shiller HPI | Real Estate |
|
Today's Week |
|
|
|
|
|
|
|
|
|
|
|
|
| |
|
|
|
|
| |
|
| S&P CASE-SHILLER HPI |
Why do we treat rising house prices as a good thing?
Because it is often the only investment many people have, and many people in the government own multiple as an investment themselves so it does not benefit them to stabilize it.
Because if house prices fall, the banks have risky investments, people will be in negative equity and if the market crashes or something happens and there are wide spread foreclosures the banks will lose Billions.
Because as a person with a mortgage currently my house going up in value means I can borrow a bit more when I renew and put the money towards something like a new kitchen. Higher asset value = more leverage to borrow cheaply and this is how most people pay for home improvements.
ncreasing prices for housing are pretty much universally treated as positive in the news and in political discourse: newspapers run headlines like "Good news: Home values are up" and talk about "housing recoveries" when home prices go up and housing's "remaining depressed" (as opposed to "remaining moderate" or "remaining affordable") when they don't. (See here for several more examples.) But as with any other good, rising home prices are good for sellers and bad for buyers. I can't see any reason why everyone seems to treat the sellers' status as more important.
Considered a good thing by whom? Financial institutions and speculators. Home owners. Renters: no, because rents are associated with house prices. If incomes are not growing at the pace of house prices, renters will be squeezed, to the benefit.
Higher housing prices are directly caused by the lack of housing inventory. Freddie Mac estimates the housing market has added about 5.8 million houses in the past four years — however, demand has increased at pretty much the same rate.De
|
|
|
| |
|
|
|
|
|
|
|
|
|
|
|
|
|
|
|
|
|
|
|
|
|
Data | Source |
|
|
S&P Case-Shiller HPI | Real Estate |
|
Today's Week |
|
|
|
|
|
|
|
|
|
|
|
|
| |
|
|
|
|
|
|
| DATA INFORMATION |
S&P CASE-SHILLER HPI |
| SOURCE |
U.S. Department of Housing & Urban Development. |
| WEB |
www.hud.gov |
| FREQUENCY |
Monthly |
| AVAILABILITY |
Usually during the third week of the month. |
| COVERAGE |
Data are for the previous month. Data for June are released in July. |
| REVISIONS |
Yes |
| IMPORTANCE |
Real Estate - Low Importance |
|
| |
|
|
|
|
|
|
|
|
|
|
|
|