|
 |
|
 |
Housing Market Index | Real Estate |
|
 |
|
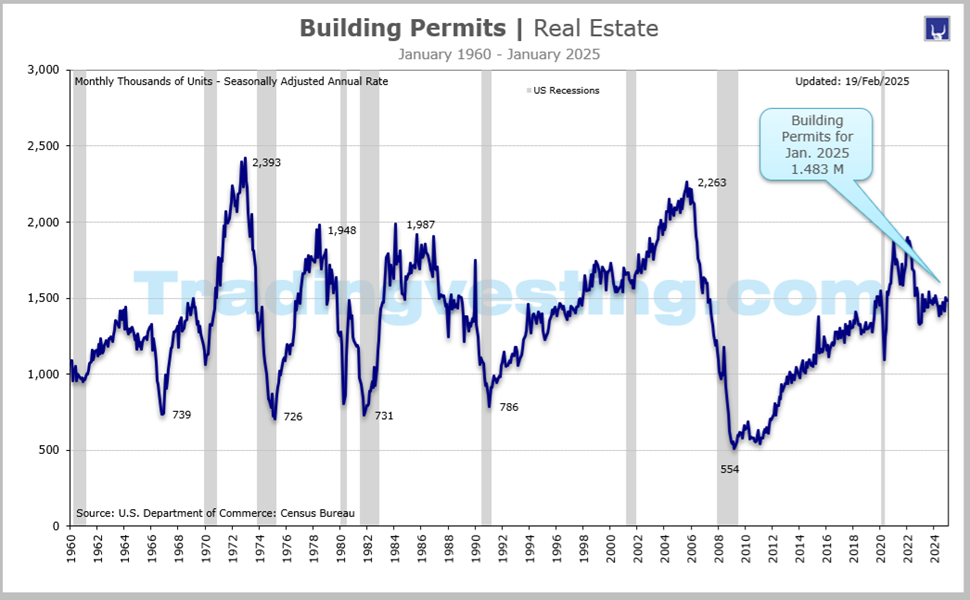
Formerly known as "New Residential Construction" it is an aproximation of the number of housing units on which some constructions was performed during the month: the number of residential units on which construction is begun each month. Read More
|
|
|
|
|
|
|
| |
|
| |
 7. Housing Market Index (7 of 10) 7. Housing Market Index (7 of 10) 8. FHFA House Price Index (8 of 10) 8. FHFA House Price Index (8 of 10) 9. MBA Purchase Applications (9 of 10) 9. MBA Purchase Applications (9 of 10) 10. Mortgage Rates 30-Year (10 of 10) 10. Mortgage Rates 30-Year (10 of 10)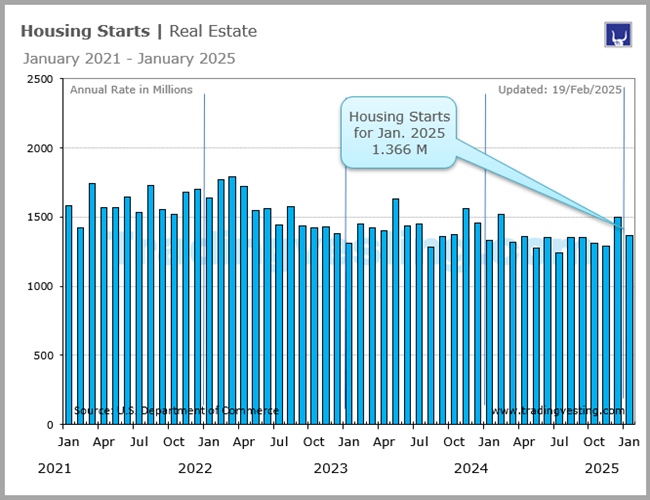 1. Housing Starts (1 of 10) 1. Housing Starts (1 of 10) 2. Building Permits (2 of 10) 2. Building Permits (2 of 10) 3. Case Shiller Index (3 of 10) 3. Case Shiller Index (3 of 10) 4. New Home Sales (4 of 10) 4. New Home Sales (4 of 10) 5. Existing Home Sales (5 of 10) 5. Existing Home Sales (5 of 10) 6. Pending Home Sales (6 of 10) 6. Pending Home Sales (6 of 10)
|
 |
|
|
|
|
| |
|
→ Big Chart |
|
→ Release |
|
| |
|
|
|
|
|
|
|
|
|
|
|
|
|
|
|
|
|
|
|
 |
|
Big Chart | Large Data |
 |
|
Housing Market Index HMI | Real Estate |
|
Today's Week |
 |
|
|
|
|
|
|
|
|
|
|
|
|
|
| |
|
|
|
|
|
|
|
|
|
|
|
|
|
| |
|
|
|
|
|
|
|
|
|
|
|
|
|
|
|
|
|
|
|
|
|
Release Schedule | 2026 |
|
|
Housing Market Index HMI | Real Estate |
|
Today's Week |
|
|
|
|
|
|
|
|
|
|
|
|
|
Housing Market Index HMI (At 10:00 a.m ET)
| SCHEDULE 2026 |
No 1 |
No 2 |
No 3 |
No 4 |
No 5 |
No 6 |
No 7 |
No 8 |
No 9 |
No 10 |
No 11 |
No 12 |
| Release | Week |
|
|
|
|
|
|
|
|
|
|
|
|
| Release | Date |
|
|
|
|
|
|
|
|
|
|
|
|
| Release | Day |
|
|
|
|
|
|
|
|
|
|
|
|
 |
|
|
|
|
|
|
|
|
|
|
|
|
| Prior |
39 |
37 |
36 |
... |
... |
... |
... |
... |
... |
... |
... |
... |
| Prior Revised |
... |
... |
37 |
... |
... |
... |
... |
... |
... |
... |
... |
... |
| CONSENSUS |
40 |
38 |
37 |
... |
... |
... |
... |
... |
... |
... |
... |
... |
| Consensus Low |
39 |
37 |
37 |
... |
... |
... |
... |
... |
... |
... |
... |
... |
| Consensus High |
40 |
41 |
38 |
... |
... |
... |
... |
... |
... |
... |
... |
... |
| HMI LEVEL |
37 |
36 |
38 |
... |
... |
... |
... |
... |
... |
... |
... |
... |
| RATING |
|
|
|
|
|
|
|
|
|
|
|
|
| Month For |
Jan-26 |
Feb-26 |
Mar-26 |
Apr-26 |
May-26 |
Jun-26 |
Jul-26 |
Aug-26 |
Sep-26 |
Oct-26 |
Nov-26 |
Dec-26 |
|
|
| |
|
| |
|
|
|
|
|
|
|
|
|
|
|
Release Schedule | 2025 |
|
|
Housing Market Index HMI | Real Estate |
|
Today's Week |
|
|
|
|
|
|
|
|
|
|
|
|
|
Housing Market Index HMI (At 10:00 a.m ET)
| SCHEDULE 2025 |
No 1 |
No 2 |
No 3 |
No 4 |
No 5 |
No 6 |
No 7 |
No 8 |
No 9 |
No 10 |
No 11 |
No 12 |
| Release | Week |
|
|
|
|
|
|
|
|
|
|
|
|
| Release | Date |
|
|
|
|
|
|
|
|
|
|
|
|
| Release | Day |
|
|
|
|
|
|
|
|
|
|
|
|
|
|
|
|
|
|
|
|
|
|
|
|
|
| Prior |
46 |
47 |
42 |
39 |
40 |
34 |
32 |
33 |
32 |
32 |
37 |
38 |
| Prior Revised: |
... |
... |
... |
... |
... |
... |
... |
... |
... |
... |
... |
... |
| CONSENSUS |
46 |
47 |
42 |
38 |
40 |
36 |
33 |
33 |
33 |
33 |
37 |
39 |
| Consensus Low |
45 |
45 |
42 |
35 |
38 |
34 |
31 |
32 |
32 |
32 |
34 |
37 |
| Consensus High |
47 |
48 |
44 |
41 |
41 |
41 |
33 |
34 |
38 |
34 |
40 |
40 |
| HMI LEVEL |
47 |
42 |
39 |
40 |
34 |
32 |
33 |
32 |
32 |
37 |
38 |
39 |
| RATING |
|
|
|
|
|
|
|
|
|
|
|
|
| Month For |
Jan-25 |
Feb-25 |
Mar-25 |
Apr-25 |
May-25 |
Jun-25 |
Jul-25 |
Aug-25 |
Sep-25 |
Oct-25 |
Nov-25 |
Dec-25 |
|
|
| |
|
| |
|
|
|
|
|
|
|
|
|
|
|
Release Schedule | 2024 |
|
|
Housing Market Index HMI | Real Estate |
|
Today's Week |
|
|
|
|
|
|
|
|
|
|
|
|
|
Housing Market Index HMI (At 10:00 a.m ET)
| SCHEDULE 2024 |
No 1 |
No 2 |
No 3 |
No 4 |
No 5 |
No 6 |
No 7 |
No 8 |
No 9 |
No 10 |
No 11 |
No 12 |
| Release | Week |
|
|
|
|
|
|
|
|
|
|
|
|
| Release | Date |
|
|
|
|
|
|
|
|
|
|
|
|
| Release | Day |
|
|
|
|
|
|
|
|
|
|
|
|
|
|
|
|
|
|
|
|
|
|
|
|
|
| Prior |
37 |
44 |
48 |
51 |
51 |
45 |
43 |
42 |
39 |
41 |
43 |
46 |
| Prior Revised: |
... |
... |
... |
... |
... |
... |
... |
41 |
... |
... |
... |
... |
| CONSENSUS |
38 |
46 |
48 |
51 |
51 |
45 |
43 |
42 |
40 |
42 |
43 |
47 |
| Consensus Low |
37 |
43 |
46 |
48 |
49 |
45 |
42 |
41 |
38 |
42 |
40 |
46 |
| Consensus High |
43 |
47 |
50 |
52 |
52 |
48 |
45 |
43 |
42 |
43 |
45 |
49 |
| HMI LEVEL |
44 |
48 |
51 |
51 |
45 |
43 |
42 |
39 |
41 |
43 |
46 |
46 |
| RATING |
|
|
|
|
|
|
|
|
|
|
|
|
| Month For |
Jan-24 |
Feb-24 |
Mar-24 |
Apr-24 |
May-24 |
Jun-24 |
Jul-24 |
Aug-24 |
Sep-24 |
Oct-24 |
Nov-24 |
Dec-24 |
|
|
| |
|
| |
|
|
|
|
|
|
|
|
|
|
|
Release Schedule | 2023 |
|
|
Housing Market Index HMI | Real Estate |
|
Today's Week |
|
|
|
|
|
|
|
|
|
|
|
|
|
Housing Market Index HMI (At 10:00 a.m ET)
| SCHEDULE 2023 |
No 1 |
No 2 |
No 3 |
No 4 |
No 5 |
No 6 |
No 7 |
No 8 |
No 9 |
No 10 |
No 11 |
No 12 |
| Release | Week |
|
|
|
|
|
|
|
|
|
|
|
|
| Release | Date |
|
|
|
|
|
|
|
|
|
|
|
|
| Release | Day |
|
|
|
|
|
|
|
|
|
|
|
|
|
|
|
|
|
|
|
|
|
|
|
|
|
| Prior |
31 |
35 |
42 |
44 |
45 |
50 |
55 |
56 |
50 |
45 |
40 |
34 |
| Prior Revised: |
... |
... |
... |
... |
... |
... |
... |
... |
... |
... |
... |
... |
| CONSENSUS |
31 |
37 |
41 |
45 |
45 |
50 |
56 |
56 |
50 |
45 |
40 |
36 |
| Consensus Low |
30 |
34 |
40 |
43 |
43 |
48 |
55 |
55 |
49 |
41 |
38 |
32 |
| Consensus High |
32 |
38 |
42 |
47 |
46 |
52 |
58 |
58 |
52 |
47 |
42 |
38 |
| HMI LEVEL |
35 |
42 |
44 |
45 |
50 |
55 |
56 |
50 |
45 |
40 |
34 |
37 |
| RATING |
|
|
|
|
|
|
|
|
|
|
|
|
| Month For |
Jan-23 |
Feb-23 |
Mar-23 |
Apr-23 |
May-23 |
Jun-23 |
Jul-23 |
Aug-23 |
Sep-23 |
Oct-23 |
Nov-23 |
Dec-23 |
|
|
| |
|
| |
|
|
|
|
|
|
|
|
|
|
|
Release Schedule | 2022 |
|
|
Housing Market Index HMI | Real Estate |
|
Today's Week |
|
|
|
|
|
|
|
|
|
|
|
|
|
Housing Market Index HMI (At 10:00 a.m ET)
| SCHEDULE 2022 |
No 1 |
No 2 |
No 3 |
No 4 |
No 5 |
No 6 |
No 7 |
No 8 |
No 9 |
No 10 |
No 11 |
No 12 |
| Release | Week |
|
|
|
|
|
|
|
|
|
|
|
|
| Release | Date |
|
|
|
|
|
|
|
|
|
|
|
|
| Release | Day |
|
|
|
|
|
|
|
|
|
|
|
|
|
|
|
|
|
|
|
|
|
|
|
|
|
| Prior |
84 |
83 |
82 |
79 |
77 |
69 |
67 |
55 |
49 |
46 |
38 |
36 |
| Prior Revised: |
... |
... |
81 |
... |
... |
... |
... |
... |
... |
... |
... |
... |
| CONSENSUS |
84 |
83 |
81 |
78 |
75 |
68 |
66 |
55 |
48 |
44 |
36 |
34 |
| Consensus Low |
84 |
81 |
80 |
76 |
75 |
63 |
64 |
53 |
45 |
42 |
34 |
32 |
| Consensus High |
85 |
84 |
83 |
81 |
77 |
70 |
66 |
58 |
51 |
47 |
37 |
35 |
| HMI LEVEL |
83 |
82 |
79 |
77 |
69 |
67 |
55 |
49 |
46 |
38 |
33 |
31 |
| RATING |
|
|
|
|
|
|
|
|
|
|
|
|
| Month For |
Jan-22 |
Feb-22 |
Mar-22 |
Apr-22 |
May-22 |
Jun-22 |
Jul-22 |
Aug-22 |
Sep-22 |
Oct-22 |
Nov-22 |
Dec-22 |
|
|
| |
|
| |
|
|
|
|
|
|
|
|
|
|
|
Release Schedule | 2021 |
|
|
Housing Market Index HMI | Real Estate |
|
Today's Week |
|
|
|
|
|
|
|
|
|
|
|
|
|
Housing Market Index HMI (At 10:00 a.m ET)
| SCHEDULE 2021 |
No 1 |
No 2 |
No 3 |
No 4 |
No 5 |
No 6 |
No 7 |
No 8 |
No 9 |
No 10 |
No 11 |
No 12 |
| Release | Week |
|
|
|
|
|
|
|
|
|
|
|
|
| Release | Date |
|
|
|
|
|
|
|
|
|
|
|
|
| Release | Day |
|
|
|
|
|
|
|
|
|
|
|
|
|
|
|
|
|
|
|
|
|
|
|
|
|
| Prior |
86 |
83 |
84 |
82 |
83 |
83 |
81 |
80 |
75 |
76 |
80 |
83 |
| Prior Revised: |
... |
... |
... |
... |
... |
... |
... |
... |
... |
... |
... |
... |
| CONSENSUS |
86 |
83 |
83 |
83 |
83 |
83 |
82 |
80 |
75 |
75 |
80 |
84 |
| Consensus Low |
82 |
81 |
82 |
82 |
83 |
82 |
80 |
78 |
73 |
72 |
78 |
83 |
| Consensus High |
88 |
84 |
85 |
84 |
84 |
83 |
83 |
81 |
77 |
77 |
82 |
84 |
| HMI LEVEL |
83 |
84 |
82 |
83 |
83 |
81 |
80 |
75 |
76 |
80 |
83 |
84 |
| RATING |
|
|
|
|
|
|
|
|
|
|
|
|
| Month For |
Jan-21 |
Feb-21 |
Mar-21 |
Apr-21 |
May-21 |
Jun-21 |
Jul-21 |
Aug-21 |
Sep-21 |
Oct-21 |
Nov-21 |
Dec-21 |
|
|
| |
|
| |
|
Legends: |
 |
Delayed |
 |
Positive View |
 |
Negative View |
 |
Neutral View |
 |
Non Available |
|
|
|
|
|
|
|
|
|
|
|
|
|
|
|
|
|
|
|
|
| |
|
|
|
|
|
|
|
|
|
|
|
|
|
|
|
|
|
|
|
|
|
Brief News | 2026 |
|
|
Housing Market Index HMI | Real Estate |
|
Today's Week |
|
|
|
|
|
|
|
|
|
|
|
|
|
Housing Market Index HMI (At 10:00 a.m ET)
| DATE/WEEK |
HIGHLIGHTS |
FOR |
HMI |
|
Housing Market Index |
No 12 |
... |
|
Dec-2026 |
|
| |
|
|
|
Housing Market Index |
No 11 |
... |
|
Nov-2026 |
|
| |
|
|
|
Housing Market Index |
No 10 |
... |
|
Oct-2026 |
|
| |
|
|
|
Housing Market Index |
No 9 |
... |
|
Sep-2026 |
|
| |
|
|
|
Housing Market Index |
No 8 |
... |
|
Aug-2026 |
|
| |
|
|
|
Housing Market Index |
No 7 |
... |
|
Jul-2026 |
|
| |
|
|
|
Housing Market Index |
No 6 |
... |
|
Jun-2026 |
|
| |
|
|
|
Housing Market Index |
No 5 |
... |
|
May-2026 |
|
| |
|
|
|
Housing Market Index |
No 4 |
... |
|
Apr-2026 |
|
| |
|
|
|
Housing Market Index |
No 3 |
... |
|
Mar-2026 |
|
| |
|
|
|
Housing Market Index. The NAHB/Wells Fargo Housing Market Index eased to 36 in February of 2026 from 37 in the previous month, contrasting slightly with market expectations that it would improve to 38. It was the softest reading in five months, reflecting continued challenges in the US housing market. |
No 2 |
36 |
|
Feb-2026 |
|
| |
|
|
|
Housing Market Index. The NAHB/Wells Fargo Housing Market Index (HMI) for January 2026 was 37, representing a two-point decline from December 2025 as builder sentiment fell to start the year. This indicates a pessimistic outlook, with 40% of builders reporting price cuts and 65% using incentives, primarily due to affordability challenges and high material costs. |
No 1 |
37 |
|
Jan-2026 |
|
| |
|
|
|
|
|
|
|
|
| |
|
|
|
|
|
| |
|
|
|
|
|
|
|
|
|
|
|
|
|
|
|
Brief News | 2025 |
|
|
Housing Market Index HMI | Real Estate |
|
Today's Week |
|
|
|
|
|
|
|
|
|
|
|
|
|
Housing Market Index HMI (At 10:00 a.m ET)
| DATE/WEEK |
HIGHLIGHTS |
FOR |
HMI |
|
Housing Market Index. US December NAHB housing market index 39 vs 39 expected. The market is getting a sense of where Fed rates will bottom and it looks like US 30-year yields will finish the year where they started. In short, there is no help coming for the US housing market. |
No 12 |
39 |
|
Dec-2025 |
|
| |
|
|
|
Housing Market Index. The National Association of Home Builders (NAHB)/Wells Fargo Housing Market Index (HMI) rose one point to 38 in November 2025, signaling slight improvement in builder confidence for new single-family homes while remaining below the 50-point break-even mark. This marked the highest confidence level in six months despite continued market challenges |
No 11 |
38 |
|
Nov-2025 |
|
| |
|
|
|
Housing Market Index. The NAHB/Wells Fargo Housing Market Index (HMI) for October 2025 stood at 37. While this marked a five-point increase from September, indicating a slight rise in builder confidence due to lower mortgage rates, it remained well below the 50-point mark, signaling continued contraction in the market for newly built single-family homes. |
No 10 |
37 |
|
Oct-2025 |
|
| |
|
|
|
Builder sentiment levels remained unchanged in September but lower mortgage rates and expectations that the Federal Reserve will soon cut the federal funds rate led to higher future sale expectations in the coming months. Builder confidence in the market for newly built single-family homes was 32 in September, unchanged from the August reading, according to the National Association of Home Builders (NAHB)/Wells Fargo Housing Market Index (HMI) released today. While builder sentiment has hovered at a relatively low reading between 32 and 34 since May, builders expressed optimism that a more favorable interest rate climate could bring hesitant buyers off the sidelines in the final quarter of 2025. |
No 9 |
32 |
|
Sep-2025 |
|
| |
|
|
|
In August 2025, the NAHB/Wells Fargo Housing Market Index (HMI) for new single-family homes in the U.S. decreased slightly to 32 from 33 in July. This marks a continued low level of builder confidence, driven by factors like high construction costs and poor housing affordability, leading to high rates of price cuts and incentives by builders. |
No 8 |
32 |
|
Aug-2025 |
|
| |
|
|
|
In July 2025, the NAHB/Wells Fargo Housing Market Index (HMI) showed a slight improvement, with builder confidence rising to 33 from 32 in the previous month, according to Haver Analytics and the NAHB website. This increase was driven by higher expectations for future sales, though traffic of prospective buyers remained low. Meanwhile, different reports show mixed results for home prices in July, with Redfin indicating that U.S. home prices fell 0.1% month-over-month, while Forbes reported a 0.2% year-over-year gain for the median resale home price, reaching a record high for July. |
No 7 |
33 |
|
Jul-2025 |
|
| |
|
|
|
Housing Market Index. The U.S. homebuilder sentiment, as measured by the NAHB/Wells Fargo Housing Market Index (HMI), fell two points to 32 in June 2025, reaching its lowest level since December 2022. This decline indicates prevailing negative sentiment among builders, with the index remaining below 50 for the past 14 months. |
No 6 |
32 |
|
Jun-2025 |
|
| |
|
|
|
The U.S. homebuilder sentiment, measured by the NAHB/Wells Fargo Housing Market Index (HMI)**, fell to 34 in May 2025, marking its lowest point since November 2023. This decline, a significant drop of six points from April, reflects builder pessimism driven by factors including elevated interest rates, tariff policies impacting material costs, and lingering inflation. |
No 5 |
34 |
|
May-2025 |
|
| |
|
|
|
Housing Market Index. The U.S. homebuilder sentiment, measured by the NAHB/Wells Fargo Housing Market Index (HMI), edged up to 40 in April 2025, a slight increase from 39 in March, exceeding economists' forecasts of 37. Despite this modest rise, builder confidence remained in negative territory (below 50) due to factors like growing economic uncertainty from tariffs, elevated building material costs, and labor shortages. |
No 4 |
40 |
|
Apr-2025 |
|
| |
|
|
|
U.S. homebuilder sentiment dropped to a seven-month low in March as tariffs on imported materials raised construction costs, a survey showed on Monday. The National Association of Home Builders/Wells Fargo Housing Market Index dropped three points to 39 this month, the lowest level since August. Economists polled by Reuters had forecast the index at 42. |
No 3 |
39 |
|
Mar-2025 |
|
| |
|
|
|
Later this morning, the Homebuilder Confidence survey for February hits the tape. It’s expected to tick down to 46 from 47 reported the prior month, which was the strongest since April of last year. August was the low point of the past 12 months, at 39. Considering that mortgage rates are not expected to sink down to more comfortable levels in the near term, we’d have to say homebuilder confidence is hanging in there. We’ll see what the results are today. |
No 2 |
42 |
|
Feb-2025 |
|
| |
|
|
|
U.S. Housing Market Index Unexpectedly Inches Up To Nine-Month High In January 2025. Reflecting hopes for an improved economic growth and regulatory environment, the National Association of Home Builders released a report on Thursday unexpectedly showing a modest improvement by U.S. homebuilder confidence in the month of January. The report said the NAHB/Wells Fargo Housing Market Index crept up to 47 in January from 46 in December. Economists had expected the index to edge down to 45. |
No 1 |
47 |
|
Jan-2025 |
|
| |
|
|
|
|
|
|
|
|
| |
|
|
|
|
|
| |
|
|
|
|
|
|
|
|
|
|
|
|
|
|
|
Brief News | 2024 |
|
|
Housing Market Index HMI | Real Estate |
|
Today's Week |
|
|
|
|
|
|
|
|
|
|
|
|
|
Housing Market Index HMI (At 10:00 a.m ET)
| DATE/WEEK |
HIGHLIGHTS |
FOR |
HMI |
|
NAHB December US housing market index 46 vs 47 expected. The creep higher in rates isn't going to help the undersupply of US housing, nor is the tough housing market in Florida. NAHB Housing Market Index Remains Unchanged At 46. NAHB Housing Market Index was unchanged at 46 in December, missing analyst estimates. The report indicated that NAHB Housing Market Index remained unchanged at 46 in December, while analysts expected that it would increase to 47. Current sales expectations remained unchanged at 48. Sales expectations in the next six months increased from 63 in November to 66 in December, reaching the highest level since April 2022. The report showed that traffic of prospective buyers declined from 32 in November to 31 in December. |
No 12 |
46 |
|
Dec-2024 |
|
| |
|
|
|
US homebuilder confidence at 7-month high in November, survey says. NAHB/Wells Fargo housing market index rises to 46, highest since April. Republican election sweep boosts builder optimism for regulations supportive for industry. Industry faces challenges from labor shortages, high materials costs, and mortgage rates U.S. homebuilder sentiment rose to a seven-month high in November and expectations for sales in the next six months surged to the highest in about two-and-a-half years after a Republican election sweep fueled optimism for regulatory changes that could lead to more residential construction, a survey said on Monday. The National Association of Home Builders/Wells Fargo Housing Market Index rose to 46 this month, the highest since April, from 43 in October. The reading was higher than all 28 estimates in a poll of economists by Reuters, which had a median expectation for 43. |
No 11 |
46 |
|
Nov-2024 |
|
| |
|
|
|
Homebuilder confidence rises in October despite mortgage rates increasing. Homebuilders are feeling more confident about the housing market despite a recent sharp rise in mortgage rates. The National Association of Home Builders (NAHB)/Wells Fargo Housing Market Index rose two points to 43 in October from the previous month, marking the second consecutive monthly gain. October’s reading was higher than economists’ estimates of 42, per Bloomberg data.Still, any reading under 50 indicates more builders view conditions as poor rather than good. |
No 10 |
|
|
Oct-2024 |
|
| |
|
|
|
U.S. home builder confidence edged up in September as mortgage rates fell, breaking four months of consecutive declines, but remained at relatively low levels as rising costs continued to impede construction. The NAHB/Wells Fargo Housing Market Index of builder confidence rose to 41 this month from 39 in August, the National Association of Home Builders said on Tuesday. A Reuters poll showed economists expected the outlook to increase to 40 this month. It was the first positive view of future home sales since May. The Federal Reserve is set to begin a rate-cutting cycle at the conclusion of its policy meeting on Wednesday. |
No 9 |
41 |
|
Sep-2024 |
|
| |
|
|
|
Builder Confidence Moves Lower as Market Waits for Rate Cuts. A lack of affordability and buyer hesitation stemming from elevated interest rates and high home prices contributed to a decline in builder sentiment in August. Builder confidence in the market for newly built single-family homes was 39 in August, down two points from a downwardly revised reading of 41 in July, according to the National Association of Home Builders (NAHB)/Wells Fargo Housing Market Index (HMI) released today. This is the lowest reading since December 2023. |
No 8 |
39 |
|
Aug-2024 |
|
| |
|
|
|
Homebuilder confidence remained subdued in July, dropping to its lowest reading since December as high borrowing costs weighed on sentiment. The National Association of Home Builders' index of confidence came in at 42 in July, down a point from the prior month—a reading that shows a majority of builders believe the market is in poor condition. Economists were expecting the index to move up one point instead, according to a survey of economists by the Wall Street Journal and Dow Jones Newswires. |
No 7 |
42 |
|
Jul-2024 |
|
| |
|
|
|
Homebuilder Confidence Hits Lowest Reading Since December 2023. Builder confidence in the market for single-family homes in June was 43, down from 45 the previous month.“Persistently high mortgage rates are keeping many prospective buyers on the sidelines,” said NAHB Chairman Carl Harris. With mortgage rates remaining high, little change in inflation and the Fed still not making any decisions when it comes to a rate cut, homebuilder confidence remains troubled as it hit its lowest reading since December 2023, according to the latest National Association of Home Builders (NAHB) data. |
No 6 |
43 |
|
Jun-2024 |
|
| |
|
|
|
U.S. Homebuilder Confidence Unexpectedly Slumps In May. With higher mortgage rates weighing on sentiment, the National Association of Home Builders released a report on Wednesday showing an unexpected deterioration in U.S. homebuilder confidence in the month of May. The report said the NAHB/Wells Fargo Housing Market Index tumbled to 45 in May from 51 in April. Economists had expected the index to come in unchanged. Homebuilder confidence decreased for the first time since November 2023, as mortgage rates averaged above 7 percent for the past four weeks per data from Freddie Mac. |
No 5 |
45 |
|
May-2024 |
|
| |
|
|
|
U.S. homebuilder confidence holds steady in April. U.S. homebuilder confidence held steady in April at the highest since last July, snapping four months of gains with uncertainty about interest rates keeping potential home buyers hesitant, data released Monday showed. The National Association of Home Builders (NAHB)/Wells Fargo Housing Market Index was unchanged this month at 51. Measures of current sales and prospective buyer traffic both ticked up to their highest levels since August while the survey's measure of sales in the next six months slipped. |
No 4 |
51 |
|
Apr-2024 |
|
| |
|
|
|
U.S. home builder confidence rose in March to the highest level since July due to lower mortgage rates and an improved pricing environment amid a continued existing home inventory shortage, the National Association of Home Builders said on Monday. The NAHB/Wells Fargo Housing Market Index of builder confidence rose to 51 this month from an unrevised 48 in February. A Reuters poll showed economists expected the outlook to remain unchanged at 48 in March. |
No 3 |
51 |
|
Mar-2024 |
|
| |
|
|
|
Builder Sentiment Posts Third Consecutive Monthly Gain. Expectations that mortgage rates will continue to moderate in the coming months, the prospect of future rate cuts by the Federal Reserve later this year, and a protracted lack of existing inventory helped provide a boost to builder sentiment for the third straight month. Builder confidence in the market for newly built single-family homes climbed four points to 48 in February, according to the National Association of Home Builders (NAHB)/Wells Fargo Housing Market Index (HMI) released today. This is the highest level since August 2023. |
No 2 |
48 |
|
Feb-2024 |
|
| |
|
|
|
Homebuilder confidence started the year off on a high note, climbing 7 points to 44 in January, according to the National Association of Home Builders’ Housing Market Index. Even so, the index remains below the 50-point threshold, indicating poor building conditions during the next six months. Improvement this month stems largely from lower mortgage rates. All three subcomponents increased, while the regional scores on a three-month moving average held steady or rose. |
No 1 |
44 |
|
Jan-2024 |
|
| |
|
|
|
|
|
|
|
|
| |
|
|
|
|
|
| |
|
|
|
|
|
|
|
|
|
|
|
|
|
|
|
Brief News | 2023 |
|
|
Housing Market Index HMI | Real Estate |
|
Today's Week |
|
|
|
|
|
|
|
|
|
|
|
|
|
Housing Market Index HMI (At 10:00 a.m ET)
| DATE/WEEK |
HIGHLIGHTS |
FOR |
HMI |
|
Homebuilder sentiment in the U.S. rebounded in December after falling for four consecutive months, according to a report released by the National Association of Home Builders on Monday. The report said the NAHB/Wells Fargo Housing Market Index climbed to 37 in December after falling to an eleven-month low of 34 in November. Economists had expected the index to rise to 36. With mortgage rates down roughly 50 basis points over the past month, builders are reporting an uptick in traffic as some prospective buyers who previously felt priced out of the market are taking a second look. |
No 12 |
37 |
|
Dec-2023 |
|
| |
|
|
|
U.S. home builder confidence weakened in November despite signs of easing mortgage rates that could bolster the outlook into the end of the year, according to a report released Thursday. The National Association of Homebuilders’ index of builder confidence fell to 34 in November from 40 in October. The six-point fall is the fourth-straight drop in builder confidence, leaving the index at its lowest since December 2022. Confidence could improve in coming months, however, as mortgage rates that peaked near 8% last month look poised to decline and credit conditions loosen across the economy. |
No 11 |
34 |
|
Nov-2023 |
|
| |
|
|
|
Homebuilder confidence fell in October to the lowest levels since January, according to a report released Tuesday, signaling sky-high mortgage rates are weighing on construction firm optimism and potential buyer traffic. U.S. home builder confidence falls to lowest since January 2023. The confidence index fell for the third-straight month to 40 from a revised September reading of 44, the National Association of Homebuilders (NAHB)/ Wells Fargo report said. The figure is also below a Reuters poll showing economist expectations of an unchanged index of 44. |
No 10 |
|
|
Oct-2023 |
|
| |
|
|
|
Home builder confidence took a hit in September as average mortgage rates for a 30-year fixed-rate loan stayed above 7%. Builder confidence in the market for newly built single-family homes in September fell five points to 45, according to the National Association of Home Builders / Wells Fargo Housing Market Index released Monday. This follows a six-point drop in August. The monthly index looks at current sales, buyer traffic and the outlook for sales of new-construction homes over the next six months. September’s reading is the first time in five months that overall builder sentiment levels dropped below the break-even measure of 50. Home builder sentiment had been rising earlier this year, riding the wave of demand caused by lack of inventory in the existing home market. But confidence dropped for the first time this year in August, as rates climbed. |
No 9 |
45 |
|
Sep-2023 |
|
| |
|
|
|
U.S. home builder confidence weakened in August for the first time this year, according to a report released Tuesday, as record-breaking mortgage rates and still-high housing prices discouraged prospective buyers. The National Association of Home Builders/Wells Fargo Housing Market Index retreated to 50 in August from a 13-month peak of 56 in July. Builder confidence was largely undermined by a drop in prospective buyer traffic, which fell to 34 in August from a year-long high of 40 in July. Economists polled by Reuters expected builder confidence to remain unchanged at 56. |
No 8 |
50 |
|
Aug-2023 |
|
| |
|
|
|
Homebuilder sentiment rises again in July, but builders warn higher mortgage rates are hurting. Builder sentiment in the market for single-family homes rose 1 point in July to 56, according to the National Association of Home Builders/Wells Fargo Housing Market Index. It marks the seventh straight month of gains and the highest level since June 2022. A reading above 50 is considered positive sentiment. Builders say low supply in the resale market is driving demand for new construction, but higher mortgage rates and supply-side challenges continue to put pressure on the market. Builder sentiment in the market for single-family homes rose 1 point in July to 56, according to the National Association of Home Builders/Wells Fargo Housing Market Index. It marks the seventh straight month of gains and the highest level since June 2022. A reading above 50 is considered positive sentiment. Builders say low supply in the resale market is driving demand for new construction. |
No 7 |
56 |
|
Jul-2023 |
|
| |
|
|
|
Builder confidence has officially climbed into positive territory, according to the National Association of Home Builders (NAHB)/Wells Fargo Housing Market Index (HMI), which rose five points in June 2023 to 55. Anything above 50 signifies general optimism among home builders. And this would be the sixth monthly increase in builder confidence in the market for newly-built, for-sale, single-family homes. According to the National Association of Home Builders (NAHB)/Wells Fargo Housing Market Index (HMI) for June 2023, builder confidence in the market for newly-built single-family homes has climbed into positive territory for the first time since July 2022. The combination of solid buyer demand, the shortage of existing inventory, and improving supply chain efficiency boosted builder confidence by five points, raising it from 50 to 55, marking the sixth consecutive month of upticks in builder sentiment. |
No 6 |
55 |
|
Jun-2023 |
|
| |
|
|
|
U.S. homebuilder sentiment rose to a 10-month high in May as tight housing supply boosted demand for new construction, according to a survey on Tuesday that also showed tightening credit conditions were becoming a challenge. The National Association of Home Builders/Wells Fargo Housing Market index increased five points to a reading of 50 this month. The fifth straight monthly increase lifted the index to the midpoint mark of 50 for the first time since July 2022. Economists polled by Reuters had predicted the index would be unchanged at 45. |
No 5 |
50 |
|
May-2023 |
|
| |
|
|
|
Confidence among U.S. single-family homebuilders improved for a fourth straight month in April as a dearth of previously owned homes and falling mortgage rates boosted demand for new houses, but a shortage of building materials remained a challenge. The National Association of Home Builders/Wells Fargo Housing Market index edged up one point to 45 this month, the highest level since September. A reading below 50 indicates that more builders view conditions as poor rather than good. Economists polled by Reuters had forecast the index would be unchanged at 44. |
No 4 |
45 |
|
Apr-2023 |
|
| |
|
|
|
Builder Confidence Edges Higher in March but Future Outlook Uncertain. Although high construction costs and elevated interest rates continue to hamper housing affordability, builders expressed cautious optimism in March as a lack of existing inventory is shifting demand to the new home market. Builder confidence in the market for newly built single-family homes in March rose two points to 44, according to the National Association of Home Builders (NAHB)/Wells Fargo Housing Market Index (HMI) released today. This is the third straight monthly increase in builder sentiment levels. |
No 3 |
44 |
|
Mar-2023 |
|
| |
|
|
|
Confidence among U.S. single-family homebuilders improved for a second straight month in February – and by much more than economists had anticipated – in a fresh signal the housing market was turning a corner after last years huge slump. The National Association of Home Builders on Wednesday said its NAHB/Wells Fargo Housing Market index rose seven points to 42 this month, notching the largest monthly gain in nearly a decade outside of the rebound from the spring 2020 COVID-19 lockdowns. The reading – the highest since September – was also higher than all 33 projections in a Reuters survey of economists, which had a median estimate of 37. A reading below 50 indicates that more builders view conditions as poor rather than good. |
No 2 |
42 |
|
Feb-2023 |
|
| |
|
|
|
The National Association of Homebuilders (NAHB) revealed that its national Housing Market Index (HMI) bumped up from December’s low of 31 to a more-encouraging 35. Homebuilder sentiment is on the rise for the first time in over a year as mortgage interest rates noticeably dropped in early 2023. Mortgage interest rates are somewhat tied to 10-year Treasury yields, which have fallen with decreasing inflation rates. In December, there were hopes that we had reached the bottom of the pessimistic streak, as the rate of decline had slowed even though sentiment was still going down. Fortunately, this prediction was accurate. |
No 1 |
35 |
|
Jan-2023 |
|
| |
|
|
|
|
|
|
|
|
| |
|
|
|
|
|
| |
|
|
|
|
|
|
|
|
|
|
|
|
|
|
|
Brief News | 2022 |
|
|
Housing Market Index HMI | Real Estate |
|
Today's Week |
|
|
|
|
|
|
|
|
|
|
|
|
|
Housing Market Index HMI (At 10:00 a.m ET)
| DATE/WEEK |
HIGHLIGHTS |
FOR |
HMI |
|
A housing market index put together by the National Association of Homebuilders and Wells Fargo started out at 83 at the beginning of this year and steadily dropped every month until it hit 31 in December. This is the lowest confidence reading since mid-2012 with the exception of spring 2020. Homebuilder sentiment is a closely watched indicator of whether builders will try to build more or fewer new homes in the future. The association’s chief economist said the soft data point to a hard landing for the U.S. economy next year.. Homebuilders are trying to offer cheaper houses to get people to buy, but construction prices have gone up 30% in 2022. These costs aren’t something the Fed’s interest rate hikes directly affect. |
No 12 |
31 |
|
Dec-2022 |
|
| |
|
|
|
Homebuilder sentiment drops to a decade low, as builders add more incentives. Homebuilder sentiment in the single-family housing market fell to the lowest level in a decade in November, as builders continue to struggle with higher costs for labor and materials and lower demand from homebuyers. A monthly sentiment index from the National Association of Home Builders dropped 5 points from October to 33. That is the 11th straight monthly decline and the lowest level since June 2012, with the exception of a very brief drop at the start of the Covid-19 pandemic that was followed by a strong rebound. A year ago, builder sentiment stood at 83. Of the index’s three components, current sales conditions fell 6 points to 39, and sales expectations in the next six months dropped 4 points to 31. Buyer traffic declined 5 points to 20. The drop in November is the 11th straight monthly decline and the lowest level since June 2012, with the exception of a brief fall at the start of the Covid-19 pandemic. |
No 11 |
33 |
|
Nov-2022 |
|
| |
|
|
|
Confidence among U.S. single-family homebuilders fell for the 10th straight month in October as soaring mortgage rates and bottlenecks for building materials made new housing less affordable for many first-time buyers. The National Association of Home Builders/Wells Fargo Housing Market index dropped eight points to 38 this month. With the exception of the short-lived plunge during the spring of 2020 when the country locked down during the first wave of COVID-19, this was the lowest reading since August 2012. A reading above 50 indicates that more builders view conditions as good rather than poor. Economists polled by Reuters had forecast the index at 43. |
No 10 |
38 |
|
Oct-2022 |
|
| |
|
|
|
Confidence among U.S. single-family homebuilders fell for the ninth straight month in September as soaring mortgage rates and persistently high prices for building materials made new housing less affordable for many first-time buyers. The National Association of Home Builders/Wells Fargo Housing Market index dropped three points to 46 this month. Discounting the plunge during the spring of 2020 when the economy was reeling from the first wave of COVID-19, this was the lowest reading since May 2014. A reading below 50 indicates that more builders view conditions as poor rather than good. Economists polled by Reuters had forecast the index at 47. |
No 9 |
46 |
|
Sep-2022 |
|
| |
|
|
|
U.S. single-family homebuilders' confidence and New York state factory activity fell in August to their lowest levels since near the start of the COVID pandemic, a further sign the economy is softening as the Federal Reserve raises interest rates. The National Association of Home Builders/Wells Fargo Housing Market Index fell 6 points to 49 this month, the eighth consecutive monthly decline and the lowest reading outside of the pandemic era since 2014, a survey released on Monday showed. A reading under 50 indicates that more builders view conditions as poor than good. According to the NAHB, rising construction costs and high mortgage rates weighed on sentiment. The Fed's increasingly aggressive fight to quash high inflation by lifting borrowing costs has already begun to be felt in the housing sector, which is highly sensitive to interest rates. |
No 8 |
49 |
|
Aug-2022 |
|
| |
|
|
|
U.S. home builder sentiment plummeted in July to its lowest level since the early months of the coronavirus pandemic, as high inflation and the steepest borrowing costs in more than a decade brought customer traffic to a near standstill. At the same time, a gauge of activity in the services sector activity in the U.S. Northeast turned negative this month for the first time in a year, and firms there do not see an improvement over the next six months. The National Association of Home Builders/Wells Fargo Housing Market Index fell for a seventh straight month to 55, the lowest level since May 2020, from 67 in June, NAHB said in a statement on Monday. Readings above 50 mean more builders view market conditions as favorable than poor. July's reading was below all 31 estimates in a Reuters poll of economists, which had a median expectation for a decline to 65. Moreover, the 12-point drop was the second-largest in the history of the series dating to 1985, exceeded only by the 42-point plunge in April 2020 when most of the country was under a COVID-19 lockdown. |
No 7 |
55 |
|
Jul-2022 |
|
| |
|
|
|
U.S. home builder sentiment hits two-year low in June, 2022. Confidence among U.S. single-family homebuilders dropped to a two-year low in June as high inflation and rising mortgage rates reduced affordability for entry-level and first-time buyers, a survey showed on Wednesday. The National Association of Home Builders/Wells Fargo Housing Market index fell two points to 67 this month, the lowest reading since June 2020. It was the sixth straight monthly decline in the index. A reading above 50 indicates that more builders view conditions as good rather than poor. |
No 6 |
67 |
|
Jun-2022 |
|
| |
|
|
|
Homebuilder sentiment falls to 2-year low on declining demand and rising costs. Builder sentiment in the market for single-family homes fell sharply in May, as mortgage rates shot higher and building material costs showed no relief. Sentiment fell an outsized 8 points to 69 in May, according to the National Association of Home Builders/Wells Fargo Housing Market Index. Readings above 50 are considered positive, but this is the fifth straight month that builder sentiment has declined. It’s the lowest reading since June 2020, when builders had a brief, quick negative reaction to the beginning of the Covid pandemic before rapidly bouncing back. As the economy shut down, demand for single-family homes with outdoor space in the suburbs skyrocketed. Builder sentiment hit a record high of 90 by November 2020. entiment fell 8 points to 69 in May, according to the National Association of Home Builders/Wells Fargo Housing Market Index. Of the index’s three components, current sales conditions fell 8 points to 78, and sales expectations in the next six months dropped 10 points to 63. Buyer traffic fell 9 points to 52. |
No 5 |
69 |
|
May-2022 |
|
| |
|
|
|
Confidence among U.S. single-family homebuilders fell to a seven-month low in April as surging mortgage rates and snarled supply chains boosted housing costs, shutting out some first-time buyers from the market, a survey showed on Monday. The housing market is under the spotlight as the Federal Reserve adopts an aggressive monetary policy stance in its fight against sky-high inflation, sending the 30-year fixed mortgage rate above 5% for first time in over a decade. But with housing inventory at record lows, the blow from surging borrowing costs could be modest. The National Association of Home Builders/Wells Fargo Housing Market index dropped two points to 77 this month. The fourth straight monthly decline pushed the index to its lowest level since last September. A reading above 50 indicates that more builders view conditions as good rather than poor. Homebuilding sentiment dropped to its lowest level in nearly two years in the Midwest. It also fell in the West, but rose in the Northeast and edged up in the densely populated South. |
No 4 |
77 |
|
Apr-2022 |
|
| |
|
|
|
The National Association of Home Builders (NAHB)/Wells Fargo Housing Market Index (HMI) reported that builder sentiment in the market for newly built single-family homes edged 2-points lower in March to a reading of 79. Despite four consecutive monthly declines, the HMI has posted solid reading for the past 6-months. Any reading above 50 indicates that more builders view conditions as good rather than poor and that demand remains strong. The NAHB notes that while builders continue to report solid buyer traffic numbers, helped by historically low existing home inventory and a persistent housing deficit, increasing development and construction costs have taken a toll on builder confidence. As a result, the March HMI recorded its lowest future sales expectations in the survey since June 2020. |
No 3 |
79 |
|
Mar-2022 |
|
| |
|
|
|
Homebuilders’ confidence falls as they wait months for cabinets, garage doors and appliances. Homebuilder confidence fell for the second straight month. Residential construction costs are up 21% year over year.“These delivery delays are raising construction costs and pricing prospective buyers. Supply chain issues for homebuilders appear to be getting worse, and that is weighing on confidence in the industry. Builder confidence in the single-family, newly built housing market fell 1 point in February to 82 on the National Association of Home Builders/Wells Fargo Housing Market Index. That is the second straight month of declines. Anything above 50 is considered positive. The index stood at 84 in February 2021. |
No 2 |
82 |
|
Feb-2022 |
|
| |
|
|
|
January NAHB Housing Market Index stands at 83. January NAHB Housing Market Index: 83 vs. 84 consensus and 84 prior. “The solid market for home building continued in November despite ongoing supply-side challenges,” said NAHB Chairman Chuck Fowke, a custom home builder from Tampa, Fla. “Lack of resale inventory combined with strong consumer demand continues to boost single-family home building.” |
No 1 |
83 |
|
Jan-2021 |
|
| |
|
|
|
|
|
|
|
|
| |
|
|
|
|
|
| |
|
|
|
|
|
|
|
|
|
|
|
|
|
|
|
Brief News | 2021 |
|
|
Housing Market Index HMI | Real Estate |
|
Today's Week |
|
|
|
|
|
|
|
|
|
|
|
|
|
Housing Market Index (HMI) | Real Estate (10:00)
| DATE/WEEK |
HIGHLIGHTS |
FOR |
ACTUAL |
|
NAHB Housing Market Index: "Home Builder Sentiment Strong at Year’s End". The National Association of Home Builders (NAHB) Housing Market Index (HMI) is a gauge of builder opinion on the relative level of current and future single-family home sales. It is a diffusion index, which means that a reading above 50 indicates a favorable outlook on home sales; below 50 indicates a negative outlook. The latest reading of 84 is up 1 from last month's 83. |
No 12 |
84 |
|
Dec-2021 |
|
| |
|
|
|
Higher prices and longer wait times do not appear to be turning buyers away from the nation’s homebuilders. With demand still surging, homebuilder confidence in the market for single-family homes rose more than expected in November, to the highest level since last May. Confidence rose 3 points to 83 on the National Association of Home Builders (NAHB)/Wells Fargo Housing Market Index (HMI). Anything above 50 is considered positive. Analyst expectations had been for it to remain unchanged at 80. Sentiment stood at 90 in November 2020. |
No 11 |
83 |
|
Nov-2021 |
|
| |
|
|
|
The nation’s homebuilders aren’t seeing any relief from supply chain issues that have slowed construction recently, but high buyer demand appears to be making up for it. Builder confidence in the single-family home construction market rose 4 points to 80 in October on the National Association of Home Builders/Wells Fargo Housing Market Index. That is still down from 85 in October 2020 and from the record high 90 in November of last year. Anything above 50 is considered positive. |
No 10 |
80 |
|
Oct-2021 |
|
| |
|
|
|
Homebuilders in the single-family construction market are feeling better, as lumber prices are way down from sky-high levels and buyer demand is growing. Builder sentiment rose 1point in September to 76, according to the National Association of Home Builders/Wells Fargo Housing Market Index. It was the first increase in three months. Sentiment stood at 83 in September of last year and then set a record high of 90 last November. It then dropped off dramatically when lumber prices spiked and supply chain issues hampered construction. |
No 9 |
76 |
|
Sep-2021 |
|
| |
|
|
|
U.S. homebuilder confidence in the market for single-family homes fell in August to its lowest reading in 13 months, driven by higher construction costs and supply shortages, a report released on Tuesday showed. The NAHB/Wells Fargo Housing Market index declined 5 points to a reading of 75 this month, its lowest level since July 2020, from 80 in July. Economists polled by Reuters had expected the index to remain unchanged from the month prior. |
No 8 |
|
|
Aug-2021 |
|
| |
|
|
|
U.S. homebuilders are happy with buyer demand, but higher construction costs are starting to eat away at their confidence. A monthly sentiment index dropped 1 point to 80 in July. The index was at a record high of 90 in November. Anything above 50 is considered positive. Of the index’s three components, current sales conditions fell 1 point to 86. Buyer traffic declined 6 points to 65, and sales expectations in the next six months rose 2 points to 81. |
No 7 |
80 |
|
Jul-2021 |
|
| |
|
|
|
Builder sentiment in June fell to its lowest level since August, as construction costs pushed new home prices higher, sidelining buyers and making it harder for some builders to get loans. The National Association of Home Builders/Wells Fargo Housing Market Index dropped 2 points to 81, down from a recent record peak of 90 last November. Anything above 50 is still considered positive. “Higher costs and declining availability for softwood lumber and other building materials pushed down builder sentiment in June,” said NAHB Chairman Chuck Fowke, a homebuilder from Tampa, Florida. “These higher costs have moved some new homes beyond the budget of prospective buyers, which has slowed the strong pace of home building.” |
No 6 |
81 |
|
Jun-2021 |
|
| |
|
|
|
Strong buyer demand is keeping homebuilders confident, but rising costs of construction materials are weighing on housing affordability. Builder sentiment in the single-family housing market was unchanged at 83 in May, according to the NAHB/Wells Fargo Housing Market Index. Anything above 50 is considered positive sentiment.The index had plummeted to 37 last May, as the pandemic lockdown hit and the housing market shut down. It then rebounded dramatically in June and July, as consumers rushed out to buy suburban homes, seeking more space for working and schooling from home. Builders now say they continue to see a steady stream of buyers, due in large part to the extreme shortage of existing homes for sale. Continued low mortgage rates are helping some with affordability, but with prices rising fast, purchasing power is weakening. |
No 5 |
83 |
|
May-2021 |
|
| |
|
|
|
April showers may bring brighter days for homebuilders. The National Association of Home Builders/Wells Fargo Housing Market Index increased to 83, seasonally adjusted, compared to March’s reading of 82. The index tracks homebuilder confidence in current and future single-family home sales and traffic of potential homebuyers on a monthly basis. Homebuilders’ outlook on both activity from prospective buyers and single-family sales ticked up this month compared to March, but sentiment around sales in six months’ time dropped two points to a reading of 81 from 83. |
No 4 |
83 |
|
Apr-2021 |
|
| |
|
|
|
Homebuilder confidence drops as interest rates and lumber prices rise. The National Association of Home Builders/Wells Fargo Housing Market Index fell 2 points to 82 in March. Of the index’s three components, current sales conditions fell 3 points to 87. Sales expectations in the next six months increased 3 points to 83, and buyer traffic was unchanged at 72. A monthly index measuring homebuilder confidence in the single-family housing market fell, as builders face rising interest rates and rising costs for materials, especially lumber. The National Association of Home Builders/Wells Fargo Housing Market Index fell 2 points to 82 in March. Anything above 50 is considered positive sentiment. The index stood at 72 in March 2020 and hit a high of 90 in November. |
No 3 |
82 |
|
Mar-2021 |
|
| |
|
|
|
Builder sentiment rose one point to 84 in February according to the latest National Association of Home Builders/Wells Fargo Housing Market Index (HMI) released Wednesday. Anything above 50 is considered positive sentiment.
While home prices are a concern in both the new and existing home markets, there appears to be very little pullback in buyer demand.
Current sales conditions held steady at 90, and traffic of prospective buyers rose four points to 72. |
No 2 |
84 |
|
Feb-2021 |
|
| |
|
|
|
Spike in lumber and land prices causes homebuilder confidence to fall from epic high. Builder confidence in the market for single-family homes fell 3 points in January to 83, according to the NAHB/Wells Fargo Housing Market Index. Anything above 50 is considered positive. Of the index’s three components, current sales conditions dropped 2 points to 90. Sales expectations in the next six months fell 2 points to 83 and buyer traffic fell 5 points to 68. Just two months ago, homebuilders had never been happier. Buyer demand, driven by the pandemic-induced desire for larger newer homes in the suburbs, had homebuilder sentiment at an all-time high. Now the rising cost of getting homes built is making builders less optimistic. |
No 1 |
83 |
|
Jan-2021 |
|
| |
|
|
|
|
|
|
|
|
| |
|
|
|
|
|
| |
|
Legends: |
|
Delayed |
|
Positive View |
|
Negative View |
|
Neutral View |
|
Non Available |
|
|
|
|
|
|
|
|
|
|
|
|
|
|
|
|
|
|
|
|
| |
|
|
|
|
|
|
|
|
|
|
|
|
|
|
|
|
|
|
|
|
|
Definitions | Explain |
|
|
Housing Market Index HMI | Real Estate |
|
Today's Week |
|
|
|
|
|
|
|
|
|
|
|
|
| |
|
|
|
|
| |
|
| How the HMI Affects You? |
The survey, which asks builders about perceptions of single family home sales and about expectations going forward for the next six months.
The NAHB/Wells Fargo Housing Market Index gauges builder perceptions of current single-family home sales and sales expectations for the next six months as good, fair or poor. The survey also asks builders to rate traffic of prospective buyers as high to very high, average or low to very low. Scores from each component are then used to calculate a seasonally adjusted index where any number over 50 indicates that more builders view conditions as good than poor.
The NAHB/Well Fargo Housing Market Index, a measure of builder confidence in the market for newly built, single-family homes in the United States.
An HMI below 50 represents an overall pessimism about the U.S. market for newly built houses.
But really, who cares?
Like most of the economic that we are subjected to, not only are the numbers interpreted incorrectly, the data is mostly meaningless.
The NAHB home builder's survey uses "a diffusion index on a scale of 0 to 100, based on a survey of builders. The index has 3 components--current sales, model home sales traffic, and builder expectations for 6 months hence rated on the basis of good, fair, or lousy. The most important of these is traffic, which reflects future sales. A reading below 50 means that more builders rate conditions as poor or very poor, rather than good or very good. |
|
|
| |
|
|
|
|
|
|
|
|
|
|
|
|
|
|
|
|
|
|
|
|
|
Data | Source |
|
|
Housing Market Index HMI | Real Estate |
|
Today's Week |
|
|
|
|
|
|
|
|
|
|
|
|
| |
|
|
|
|
|
|
| DATA INFORMATION |
HOUSING MARKET INDEX HMI |
| SOURCE |
U.S. Department of Housing & Urban Development. |
| WEB |
www.hud.gov |
| FREQUENCY |
Monthly |
| AVAILABILITY |
Usually during the third week of the month. |
| COVERAGE |
Data are for the previous month. Data for June are released in July. |
| REVISIONS |
Yes |
| IMPORTANCE |
Real Estate - Low Importance |
|
| |
|
|
|
|
|
|
|
|
|
|
|
|