What is Tradingvesting.com ?
Tradingvesting.com is a Tool that allows users to Learn Investing by
following a Portfolio Model based on a Short-Term Trend and a Long Term Trend of the S&P 500 Index.
→ Tool | Prepare Traders and Investors for week Ahead
→ Guideline | Help Traders and Investors Identify Trends
----------------------------------------------------------------------
How do I start with Tradingvesting.com
1. Follow our Weekly Economic Calendar
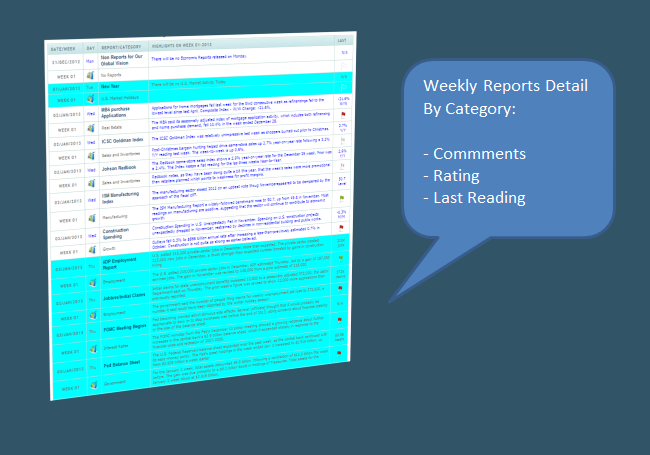
Our Economic Calendar is organized on a Weekly Basis. You can click on any week and go back or go to the upcoming weeks. Every report has been categorized and is posted on the Economic Calendar. If you click on the Report you will see a separate page with the Releases, the Ratings, Big Chart, Small Chart, and News. There is also a comparison with the other Reports in the the category.
So, every week you will see:
1) Weekly - Economic Reports
2) Weekly - Ratings
3) Weekly - Charts
4) Weekly - Brief News
5) Weekly - Global Top News
We have 4 main topics that are seen in the Economic Calendar:
1) Economic Reports: 12 Categories with 61 Reports
2) Earnings Season: 21 Top Stocks
and Earnings
3) Market Correlation: 5 Categories with 7 Reports
4) World Factors: 3 Categories and 10 Reports
After the week is finished, we rate the current week into a 52-Weeks Summary and a GlobalView summary.
The same process is done with the Top Stocks earnings.
2. 52-Week Summary
Once the Week is over we summarized and compared the reports rating. We compare results to expectations, consensus:
Look at the difference between the "actual" reported data and the "consensus" forecast. A significant difference can cause sharp market reactions. You can view a better picture of the year by organizing the year in 52-weeks.
3. GlobalView - Monthly Summary
We prioritize market events: Focus on high-impact events, such as interest rate decisions from major central banks like the FOMC, or important economic reports like the US non-farm payroll, unmeployment rate, which are often more impactful than secondary reports like the ADP employment report.
4. Earnings Season
We follow 20 Top Stocks of the S&P 500 index. We rate their performance according to the consensus and the actual earnings report on these stocks.
5. Top News
We follow the Top News of the Week.
6. Geopolitical Risk
We rate the week according to the most important Geopolitical risk.
7. Charts
Charts tell a story....We provide you with a ChartBook that tells a story. ChartBook Tells the Story of Markets and the Economy.
8. Simulated Portfolio Model
We provide you with a Simulated Portfolio Model. Test our Portfolio Model Strategy to beat the market and outperform the S&P 500 Index. View a detailed log of all our transactions and Portfolio Model change. Track Our Portfolio Model Performance and compare against the S&P 500 index
9. Put It All Together
To support our globalview you can easily see a big picture economics. Identify market Trends that can have a big impact on investments, large and small.
Plan the week ahead: Use the economic calendar to see what reports are coming up and plan your trades or research accordingly. For example, you can prepare for a major central bank announcement or a key economic report.
View upcoming economic events, understand their potential market impact by checking ratings, and compare the actual data to market consensus. You must ubderstand these reports and analyze charts.
|