 |
 |
|
 |
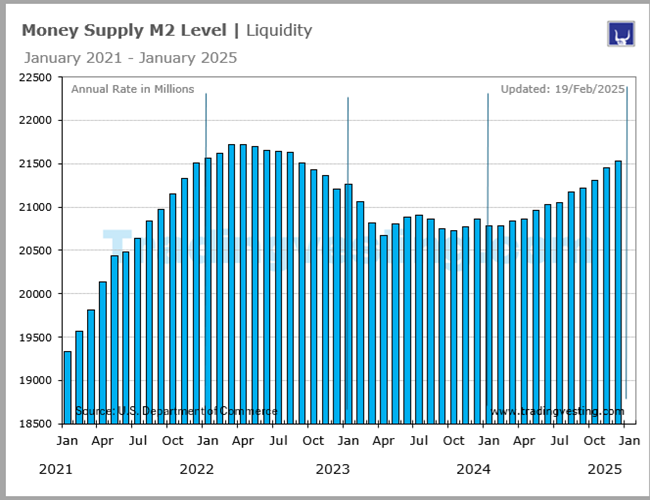
Money Supply M2 | Liquidity |
|
 |
|
M2 includes everything in M1 plus savings accounts, time deposits under $100,000, and money market mutual funds (except those held in IRAs). M1 includes currency, travelers checks, and checking account deposits. . Read More...
|
|
|
|
|
|
|
| |
|
| |
 1. Money Supply (1 of 2) 1. Money Supply (1 of 2) 1. Money Supply (1 of 2) 1. Money Supply (1 of 2) 2. Fed Balance Sheet (2 of 2) 2. Fed Balance Sheet (2 of 2)
|
 |
|
|
|
|
| |
|
→ Big Chart |
|
→ Release |
|
| |
|
|
|
|
|
|
|
|
|
|
|
|
|
|
|
|
|
|
|
 |
|
Big Chart | Large Data |
 |
|
Money Supply | Liquidity |
|
Today's Week |
 |
|
|
|
|
|
|
|
|
|
|
|
|
|
| |
|
|
|
|
|
|
|
|
|
|
|
|
|
| |
|
|
|
|
|
|
|
|
|
|
|
|
|
|
|
|
|
|
|
|
|
Release Schedule | 2026 |
|
|
Money Supply | Liquidity |
|
Today's Week |
|
|
|
|
|
|
|
|
|
|
|
|
|
Money Supply M/M (At 13:00 ET)
| RELEASE 2026 |
Date |
Day |
Prior |
Prior Rev |
M2 Level |
M/M $Chg |
M/M %Chg |
Rating |
For |
 |
27/Jan/2026 |
Tue |
$22,322.4 B |
$22,322.1 B |
$22,410.0 B |
$88.9 B |
0.4% |
|
Dec 2025 |
 |
24/Feb/2026 |
Tue |
$22,410.0 B |
$22,366.2 B |
$22,442.1 B |
$75.9 B |
0.3% |
|
Jan 2026 |
 |
24/Mar/2026 |
Tue |
$22,442.1 B |
$22,469.1 B |
$22,667.3 B |
$198.2 B |
0.9% |
|
Feb 2026 |
 |
28/Apr/2026 |
Tue |
$22,667.3 B |
... |
... |
... |
... |
|
Mar 2026 |
 |
26/May/2026 |
Tue |
... |
... |
... |
... |
... |
|
Apr 2026 |
 |
23/Jun/2026 |
Tue |
... |
... |
... |
... |
... |
|
May 2026 |
 |
28/Jul/2026 |
Tue |
... |
... |
... |
... |
... |
|
Jun 2026 |
 |
25/Aug/2026 |
Tue |
... |
... |
... |
... |
... |
|
Jul 2026 |
 |
22/Sep/2026 |
Tue |
... |
... |
... |
... |
... |
|
Aug 2026 |
 |
27/Oct/2026 |
Tue |
... |
... |
... |
... |
... |
|
Sep 2026 |
 |
24/Nov/2026 |
Tue |
... |
... |
... |
... |
... |
|
Oct 2026 |
 |
22/Dec/2026 |
Tue |
... |
... |
... |
... |
... |
|
Nov 2026 |
| RELEASE 2026 |
Date |
Day |
Prior |
Prior Rev |
M2 Level |
M/M $Chg |
M/M %Chg |
Rating |
For |
|
|
|
|
|
|
|
|
|
|
|
|
| |
 |
| |
|
|
|
|
|
|
|
|
|
|
|
Release Schedule | 2025 |
|
|
Money Supply | Liquidity |
|
Today's Week |
|
|
|
|
|
|
|
|
|
|
|
|
|
Money Supply M/M (At 13:00 ET)
| SCHEDULE 2025 |
Date |
Day |
Prior |
Prior Rev |
M2 Level |
M/M $Chg |
M/M %Chg |
Rating |
For |
| WEEK 05 |
28/Jan/2025 |
Tue |
$21,447.6 B |
$21,448.3 B |
$21,533.8 B |
$85.5 B |
0.4% |
|
Dec 2024 |
| WEEK 09 |
25/Feb/2025 |
Tue |
$21,533.8 B |
$21,549.3 B |
$21,561.4 B |
$12.1 B |
0.1% |
|
Jan 2025 |
| WEEK 13 |
25/Mar/2025 |
Tue |
$21,561.4 B |
$21,577.1 B |
$21,671.0 B |
$93.9 B |
0.4% |
|
Feb 2025 |
| WEEK 17 |
22/Apr/2025 |
Tue |
$21,671.0 B |
$21,670.5 B |
$21,762.5 B |
$92.0 B |
0.4% |
|
Mar 2025 |
| WEEK 22 |
27/May/2025 |
Tue |
$21,762.5 B |
$21,706.8 B |
$21,862.5 B |
$155.7 B |
0.7% |
|
Apr 2025 |
| WEEK 26 |
24/Jun/2025 |
Tue |
$21,862.5 B |
$21,862.4 B |
$21,942.0 B |
$79.6 B |
0.4% |
|
May 2025 |
| WEEK 30 |
22/Jul/2025 |
Tue |
$21,942.0 B |
$21,883.6 B |
$22,020.8 B |
$137.2 B |
0.6% |
|
Jun 2025 |
| WEEK 35 |
26/Aug/2025 |
Tue |
$22,020.8 B |
$22,021.4 B |
$22,115.4 B |
$94.0 B |
0.4% |
|
Jul 2025 |
| WEEK 39 |
23/Sep/2025 |
Tue |
$22,115.4 B |
$22,115.8 B |
$22,195.4 B |
$79.6 B |
0.4% |
|
Aug 2025 |
| WEEK 44 |
28/Oct/2025 |
Tue |
$22,195.4 B |
$22,100.4 B |
$22,212.5 B |
$104.1 B |
0.5% |
|
Sep 2025 |
| WEEK 48 |
25/Nov/2025 |
Tue |
... |
... |
... |
... |
... |
|
Oct 2025 |
| WEEK 52 |
23/Dec/2025 |
Thu |
... |
... |
$22,322.4 B |
$24.4 B |
0.1% |
|
Nov 2025 |
| SCHEDULE 2025 |
Date |
Day |
Prior |
Prior Rev |
M2 Level |
M/M $Chg |
M/M %Chg |
Rating |
For |
|
|
|
|
|
|
|
|
|
|
|
|
| |
|
| |
|
|
|
|
|
|
|
|
|
|
|
Release Schedule | 2024 |
|
|
Money Supply | Liquidity |
|
Today's Week |
|
|
|
|
|
|
|
|
|
|
|
|
|
Money Supply M/M (At 13:00 ET)
| SCHEDULE 2024 |
Date |
Day |
Prior |
Prior Rev |
M2 Level |
M/M $Chg |
M/M %Chg |
Rating |
For |
| WEEK 04 |
23/Jan/2024 |
Tue |
$20,767.4 B |
$20,767.5 B |
$20,865.2 B |
$97.7 B |
0.5% |
|
Dec 2023 |
| WEEK 09 |
27/Feb/2024 |
Tue |
$20,865.2 B |
$20,827.2 B |
$20,781.8 B |
$-45.4 B |
-0.2% |
|
Jan 2024 |
| WEEK 13 |
26/Mar/2024 |
Tue |
$20,781.8 B |
$20,790.2 B |
$20,783.6 B |
$-6.6 B |
0.0% |
|
Feb 2024 |
| WEEK 17 |
23/Apr/2024 |
Tue |
$20,783.6 B |
$20,748.6 B |
$20,841.2 B |
$92.6 B |
0.4% |
|
Mar 2024 |
| WEEK 22 |
28/May/2024 |
Tue |
$20,841.2 B |
$20,841.5 B |
$20,867.3 B |
$25.8 B |
0.1% |
|
Apr 2024 |
| WEEK 26 |
25/Jun/2024 |
Tue |
$20,867.3 B |
$20,870.2 B |
$20,963.4 B |
$93.2 B |
0.4% |
|
May 2024 |
| WEEK 30 |
23/Jul/2024 |
Tue |
$20,963.4 B |
$20,951.7 B |
$21,024.8 B |
$73.0 B |
0.3% |
|
Jun 2024 |
| WEEK 35 |
27/Aug/2024 |
Tue |
$21,024.7 B |
$20,025.1 B |
$21,054.4 B |
$29.3 B |
0.1% |
|
Jul 2024 |
| WEEK 39 |
24/Sep/2024 |
Tue |
$21,054.4 B |
$21,058.9 B |
$21,174.9 B |
$116.0 B |
0.6% |
|
Aug 2024 |
| WEEK 43 |
22/Oct/2024 |
Tue |
$21,174.9 B |
$21,141.2 B |
$21,221.2 B |
$80.0 B |
0.4% |
|
Sep 2024 |
| WEEK 48 |
26/Nov/2024 |
Tue |
$21,221.2 B |
$21,222.7 B |
$21,311.2 B |
$88.5 B |
0.4% |
|
Oct 2024 |
| WEEK 52 |
26/Dec/2024 |
Thu |
... |
... |
$21,477.6 B |
... |
... |
|
Nov 2024 |
| SCHEDULE 2024 |
Date |
Day |
Prior |
Prior Rev |
M2 Level |
M/M $Chg |
M/M %Chg |
Rating |
For |
|
|
|
|
|
|
|
|
|
|
|
|
| |
|
| |
|
|
|
|
|
|
|
|
|
|
|
Release Schedule | 2023 |
|
|
Money Supply | Liquidity |
|
Today's Week |
|
|
|
|
|
|
|
|
|
|
|
|
|
Money Supply M/M (At 13:00 ET)
| SCHEDULE 2023 |
Date |
Day |
Prior |
Prior Rev |
M2 Level |
M/M $Chg |
M/M %Chg |
Rating |
For |
| WEEK 04 |
24/Jan/2023 |
Tue |
$21,351 |
$21,354 |
$21,207 |
$-147.4 B |
-0.7% |
|
Dec 2022 |
| WEEK 09 |
28/Feb/2023 |
Tue |
$21,207 |
$21,236 |
$21,267 |
$30.9 B |
0.1% |
|
Jan 2023 |
| WEEK 13 |
28/Mar/2023 |
Tue |
$21,267 |
$21,183 |
$21,062 |
$-121.0 B |
-0.6% |
|
Feb 2023 |
| WEEK 17 |
25/Apr/2023 |
Tue |
$21,062 |
$21,075 |
$20,818 |
$-257.3 B |
-1.2% |
|
Mar 2023 |
| WEEK 21 |
23/May/2023 |
Tue |
$20,818 |
$20,840 |
$20,673 |
$-167.2 B |
-0.8% |
|
Apr 2023 |
| WEEK 26 |
27/Jun/2023 |
Tue |
$20,673 |
$20,674 |
$20,805 |
$130.9 B |
0.6% |
|
May 2023 |
| WEEK 30 |
25/Jul/2023 |
Tue |
$20,805 |
$20,841 |
$20,889 |
$47.8 B |
0.2% |
|
Jun 2023 |
| WEEK 34 |
22/Aug/2023 |
Tue |
$20,889 |
$20,890 |
$20,902 |
$12.7 B |
0.1% |
|
Jul 2023 |
| WEEK 39 |
26/Sep/2023 |
Tue |
$20,902 |
$20,905 |
$20,865 |
$-40.0 B |
-0.2% |
|
Aug 2023 |
| WEEK 43 |
24/Oct/2023 |
Tue |
$20,865 |
$20,825 |
$20,754 |
$-70.4 |
-0.3% |
|
Sep 2023 |
| WEEK 48 |
28/Nov/2023 |
Tue |
$20,754 |
$20,755 |
$20,726 |
$-29.5 |
-0.1% |
|
Oct 2023 |
| WEEK 52 |
26/Dec/2023 |
Tue |
$20,726 |
... |
$20,767 |
$41.8 B |
0.2% |
|
Nov 2023 |
| SCHEDULE 2023 |
Date |
Day |
Prior |
Prior Rev |
M2 Level |
M/M $Chg |
M/M %Chg |
Rating |
For |
|
|
|
|
|
|
|
|
|
|
|
|
| |
|
| |
|
|
|
|
|
|
|
|
|
|
|
Release Schedule | 2022 |
|
|
Money Supply | Liquidity |
|
Today's Week |
|
|
|
|
|
|
|
|
|
|
|
|
|
Money Supply M/M (At 13:00 ET)
| SCHEDULE 2022 |
Date |
Day |
Prior |
Prior Rev |
M2 Level |
M/M $Chg |
M/M %Chg |
Rating |
For |
| WEEK 04 |
23/Jan/2022 |
Tue |
... |
... |
... |
... |
... |
|
Dec 2021 |
| WEEK 09 |
27/Feb/2022 |
Tue |
... |
... |
... |
... |
... |
|
Jan 2022 |
| WEEK 13 |
26/Mar/2022 |
Tue |
... |
... |
... |
... |
... |
|
Feb 2022 |
| WEEK 17 |
23/Apr/2022 |
Tue |
... |
... |
... |
... |
... |
|
Mar 2022 |
| WEEK 22 |
28/May/2022 |
Tue |
... |
... |
... |
... |
... |
|
Apr 2022 |
| WEEK 26 |
25/Jun/2022 |
Tue |
... |
... |
... |
... |
... |
|
May 2022 |
| WEEK 30 |
23/Jul/2022 |
Tue |
... |
... |
... |
... |
... |
|
Jun 2022 |
| WEEK 35 |
27/Aug/2022 |
Tue |
... |
... |
... |
... |
... |
|
Jul 2022 |
| WEEK 39 |
24/Sep/2022 |
Tue |
... |
... |
... |
... |
... |
|
Aug 2022 |
| WEEK 43 |
22/Oct/2022 |
Tue |
... |
... |
... |
... |
... |
|
Sep 2022 |
| WEEK 48 |
26/Nov/2022 |
Tue |
... |
... |
... |
... |
... |
|
Oct 2022 |
| WEEK 52 |
26/Dec/2022 |
Thu |
... |
... |
... |
... |
... |
|
Nov 2022 |
| SCHEDULE 2022 |
Date |
Day |
Prior |
Prior Rev |
M2 Level |
M/M $Chg |
M/M %Chg |
Rating |
For |
|
|
|
|
|
|
|
|
|
|
|
|
| |
|
| |
|
|
|
|
|
|
|
|
|
|
|
Release Schedule | 2021 |
|
|
Money Supply | Liquidity |
|
Today's Week |
|
|
|
|
|
|
|
|
|
|
|
|
|
Money Supply M/M (At 13:00 ET)
| SCHEDULE 2021 |
Date |
Day |
Prior |
Prior Rev |
M2 Level |
M/M $Chg |
M/M %Chg |
Rating |
For |
| WEEK 04 |
23/Jan/2021 |
Tue |
... |
... |
... |
... |
... |
|
Dec 2020 |
| WEEK 09 |
27/Feb/2021 |
Tue |
... |
... |
... |
... |
... |
|
Jan 2021 |
| WEEK 13 |
26/Mar/2021 |
Tue |
... |
... |
... |
... |
... |
|
Feb 2021 |
| WEEK 17 |
23/Apr/2021 |
Tue |
... |
... |
... |
... |
... |
|
Mar 2021 |
| WEEK 22 |
28/May/2021 |
Tue |
... |
... |
... |
... |
... |
|
Apr 2021 |
| WEEK 26 |
25/Jun/2021 |
Tue |
... |
... |
... |
... |
... |
|
May 2021 |
| WEEK 30 |
23/Jul/2021 |
Tue |
... |
... |
... |
... |
... |
|
Jun 2021 |
| WEEK 35 |
27/Aug/2021 |
Tue |
... |
... |
... |
... |
... |
|
Jul 2021 |
| WEEK 39 |
24/Sep/2021 |
Tue |
... |
... |
... |
... |
... |
|
Aug 2021 |
| WEEK 43 |
22/Oct/2021 |
Tue |
... |
... |
... |
... |
... |
|
Sep 2021 |
| WEEK 48 |
26/Nov/2021 |
Tue |
... |
... |
... |
... |
... |
|
Oct 2021 |
| WEEK 52 |
26/Dec/2021 |
Thu |
... |
... |
... |
... |
... |
|
Nov 2021 |
| SCHEDULE 2021 |
Date |
Day |
Prior |
Prior Rev |
M2 Level |
M/M $Chg |
M/M %Chg |
Rating |
For |
|
|
|
|
|
|
|
|
|
|
|
|
| |
|
|
| |
|
|
|
|
|
|
|
|
|
|
|
|
Money Supply M/M (At 13:00 ET)
| DATE/WEEK |
HIGHLIGHTS |
FOR |
M2 |
|
Money Supply |
No 12 |
... |
|
Nov-2025 |
|
| |
|
|
|
Money Supply |
No 11 |
... |
|
Oct-2025 |
|
| |
|
|
|
Money Supply |
No 10 |
... |
|
Sep-2025 |
|
| |
|
|
|
Money Supply |
No 9 |
... |
|
Aug-2025 |
|
| |
|
|
|
Money Supply |
No 8 |
... |
|
Jul-2025 |
|
| |
|
|
|
bbbbb |
No 7 |
... |
|
Jun-2025 |
|
| |
|
|
|
Louis reported that the M2 money supply reached $21.942 trillion by May 2025, surpassing its previous record. This rapid expansion in the money supply is believed to have weakened the dollar, sparking worries about the potential consequences of an oversupply of currency on its international standing. The United States M2 money supply has reached a new all-time high of $21.94 trillion. This milestone reflects the ongoing expansion of the monetary base, which includes cash, checking deposits, and easily convertible near money. The increase in M2 supply is often monitored by economists and investors as an indicator of potential inflationary pressures and economic activity. |
No 6 |
21,942 |
|
May-2025 |
|
| |
|
|
|
Just days ago, the Board of Governors of the Federal Reserve System reported that the U.S. M2 money supply hit an all-time record high of $21.863 trillion in April 2025. The entirety of the 4.76% peak-to-trough drop between April 2022 and October 2023 has been erased. U.S. M2 money supply hit a peak in April of 2022. That's a month after the Federal Reserve started raising interest rates to fight inflation. As rates climbed, M2 money supply fell. It continued to drop until late 2023, after the Fed indicated no further plans for rate hikes. The recovery has been slow as the Fed has been hesitant to cut rates too quickly and stoke further inflation. |
No 5 |
21,862 |
|
Apr-2025 |
|
| |
|
|
|
U.S. M2 money supply In March 2025, U.S. M2 made history by reaching an all-time high of $21.763 trillion. It's the first time M2 achieved a fresh record since April 2022 ($21.75 trillion). With M2 money supply expanding by almost 4% on a year-over-year basis, it would appear the U.S. economy is relatively healthy. |
No 4 |
21,762 |
|
Mar-2025 |
|
| |
|
|
|
According to data from the Board of Governors of the Federal Reserve System, the U.S. M2 money supply clocked in at $21.671 trillion in February 2025. Superficially, this represents a very modest decline of 0.24% from its all-time high of $21.723 trillion set in April 2022. |
No 3 |
21,671 |
|
Feb-2025 |
|
| |
|
|
|
In January 2025, US M2 money supply showed a slight month-over-month decrease of 0.55% but a year-over-year increase of 4.52%, reaching a level of $21.85 trillion, while the M1 money supply increased by 0.24% month-over-month and 3.95% year-over-year. The Center for Financial Stability (CFS) reported that its broadest and most important measure of money, CFS Divisia M4, grew by 3.5% year-over-year in January 2025, slightly up from 3.4% in December 2024. |
No 2 |
21,561 |
|
Jan-2025 |
|
| |
|
|
|
M2 Money Supply Approaches All-Time High, Bullish Signal for Crypto. The U.S. M2 money supply continued to increase in December a bullish catalyst for risk-on assets. he U.S. M2 money supply continued to increase in December 2024, now shy of its all-time high of $22 trillion. An increase in the M2 money supply is a bullish catalyst for risk assets. The U.S. M2 money supply increased in December to $21.5 trillion, just shy of its all-time high.Continued growth in the M2 money supply is a bullish indicator for risk assets as it indicates more liquidity is entering the system, which typically finds itself in risk-assets first. The M2 money supply has clocked in a new monthly high every month since January 2024. The M2 money supply influences CPI by affecting inflation trends. While the Federal Reserve is actively tightening through quantitative easing and keeping the Fed funds rate at an elevated level while trying to bring CPI back down to its 2% inflation target, the M2 money supply continues to grow. The M2 money supply measures the total amount of money in circulation within an economy, including both liquid and less liquid assets. Meanwhile, the CPI index tracks the average price change of goods and services over time, which indicates inflation. |
No 1 |
21,533 |
|
Dec-2024 |
|
| |
|
|
|
|
|
|
|
|
| |
|
|
|
|
|
| |
|
|
|
|
|
| |
| |
|
|
|
|
|
| |
|
|
|
|
|
|
|
|
|
|
|
|
|
|
|
Brief News | 2021-2022 |
|
|
Money Supply | Liquidity |
|
Today's Week |
|
|
|
|
|
|
|
|
|
|
|
|
| |
| |
|
|
|
|
|
|
| |
|
|
|
|
|
|
|
|
|
|
|
| |
|
|
|
|
| |
|
| MONEY SUPPLY |
M2-Money Supply?
This is a first for the U.S. money supply in more than 90 years.
The forecasting metric I've alluded to above is the U.S. money supply. Though the U.S. money supply has five different measures, the two with the most merit tend to be M1 and M2.
M1 money supply takes into account cash and coins in circulation, as well as demand deposits in a checking account. Think of it as money that's very accessible and can be spent at the drop of a hat.
Meanwhile, M2 factors in everything in M1 and adds in savings accounts, money market accounts, and certificates of deposit (CDs) under $100,000. It's still money that's accessible, but it takes a bit more work to get to and spend. It's this category, M2 money supply, which is cause for concern.
Normally, little attention is paid to M2 money supply. That's because it's been rising with virtually no interruption for the last nine decades. With the U.S. economy growing over time, it's not surprising that more capital has been needed to facilitate transactions.
What's abnormal is a decline in the U.S. money supply -- which is exactly what we're witnessing right now with M2.
In April 2022, the Board of Governors of the Federal Reserve reported that M2 peaked at an all-time high of $21.722 trillion. For some context, that's up from $286.6 billion in January 1959 and represents a compound annual growth rate of approximately 7%.
But as of April 2024, M2 came in at $20.867 trillion, representing a decline of nearly $855 billion -- 3.94% on a percentage basis -- in two years. It's the first time M2 money supply has backed off more than 2% from its all-time high since the Great Depression.
The stipulation to this decline that shouldn't be overlooked is that M2 exploded higher by 26% on a year-over-year basis during the height of the COVID-19 pandemic. Multiple rounds of fiscal stimulus from the federal government, coupled with low interest rates, flooded the U.S. economy with capital that rapidly expanded the money supply. An argument can be made that the nearly 4% retracement in M2 over the last two years is nothing more than a normalization after a historic expansion.
I'll also point out that M2 has actually risen on a year-over-year basis. Despite being down 3.94% from its all-time high in April 2022, M2 is higher by a very modest 0.14% from where things stood one year ago.
Nevertheless, history has been quite clear about what happens anytime the M2 money supply retraces by at least 2% from its high -- and it's not good news for Wall Street or the U.S. economy. May, 2024.
M2-Money Supply
Continued growth in the M2 money supply is a bullish indicator for risk assets as it indicates more liquidity is entering the system, which typically finds itself in risk-assets first.
The M2 money supply influences CPI by affecting inflation trends. While the Federal Reserve is actively tightening through quantitative easing and keeping the Fed funds rate at an elevated level while trying to bring CPI back down to its 2% inflation target, the M2 money supply continues to grow.
The M2 money supply measures the total amount of money in circulation within an economy, including both liquid and less liquid assets. Meanwhile, the CPI index tracks the average price change of goods and services over time, which indicates inflation.
The M2 money supply is a broad measure of the total money circulating in the economy. It includes highly liquid assets like cash and checking deposits. As well as less liquid assets such as savings accounts and money market funds. Since January 2024, the M2 money supply has set a new monthly high. This persistent increase signals that liquidity is flowing into the economy. When M2 increases, money is available for spending and investing in the economy. A rising M2 money supply is a bullish indicator for risk assets like stocks and cryptocurrencies. Historically, this can fuel inflation and impact financial markets. Notably, the Consumer Price Index (CPI), which tracks the rising cost of goods and services, also reflects how inflation trends change. This is because M2’s growth has a direct influence on the CPI. When more money enters the system, it often leads to higher prices of goods and services, making it harder for the Federal Reserve to control inflation. M2 Grows Amidst Federal Reserve Effort to Stabilize the Economy The Federal Reserve has been trying to curb inflation by maintaining high interest rates and reducing its balance sheet through quantitative tightening. The goal is to return CPI inflation to its annual 2% target. However, the continued expansion of M2 suggests that these efforts have not significantly slowed liquidity growth.
|
|
|
| |
|
|
|
|
|
|
|
|
|
|
|
| |
|
|
|
|
|
|
| DATA INFORMATION |
TREASURY BUDGET |
| SOURCE |
Financial Management Service, U.S. Department of the Treasury |
| WEB |
www.fms.treas.gov |
| FREQUENCY |
Monthly |
| AVAILABILITY |
Second week of the month |
| COVERAGE |
Data are for the previous month. Data for June are released in July. |
| REVISIONS |
No |
| IMPORTANCE |
Treasury - Very Important |
|
| |
|
|
|
|
|
|
|
|
|
|
|
|


