10-Year Treasury Yield
The 10-year Treasury note yield fell on Monday after President Donald Trump said further military strikes against Iran had been postponed after “productive” negotiations between the warring sides. The benchmark yield was down more than 4 basis points at 4.348%. Earlier in the session, the benchmark security hit its highest level since July as traders had feared the Federal Reserve wouldn’t be lowering interest rates this year and actually could hike as their next move. It then fell sharply, but then turned back to flat before moving lower once again as traders processed the news.
CFNAI Chicago Fed National Activity Index
The Chicago Fed National Activity Index (CFNAI) decreased to –0.11 in February 2026 from +0.20 in January. Two of the four broad categories of indicators used to construct the index decreased from January, and three categories made negative contributions in February. The index's three-month moving average, CFNAI-MA3, increased to –0.01 in February from –0.02 in January.
Construction Spending
US construction spending declined 0.3% month-over-month in January 2026, reaching a seasonally adjusted annual rate of $2.19 trillion, following a revised 0.8% increase in December 2025 and missing market expectations of a 0.1% rise. Private construction fell 0.6% to $1.66 trillion, with residential construction down 0.8% and nonresidential construction slipping 0.4%. In contrast, public construction spending rose 0.6% to $529.2 billion, led by a 3.3% surge in highway construction, while public educational construction dipped 0.2%.
US Dollar Index
The US Dollar Index spiked to session highs before plunging after Trump announced a postponement of strikes on Iranian energy infrastructure. The Fed held rates at 3.50% to 3.75% last week, with Chair Powell noting inflation progress has been slower than hoped; the updated dot plot still projects one cut in 2026. Trump announced a five-day postponement of planned strikes on Iranian power plants, citing productive talks with Tehran; Iran denied any negotiations, and the Strait of Hormuz remains closed.
Productivity and Costs
U.S. worker productivity growth slowed more than initially thought in the fourth quarter, but the trend remained solid and could get a boost from the rapid adoption of artificial intelligence by businesses.The sharp downgrade to productivity last quarter, which was reported by the Labor Department on Tuesday, pushed unit labor costs sharply higher amid strong rises in labor compensation.Though economists viewed the surge in costs as temporary, given labor market softness, they said the pace was incompatible with a return of inflation back down to the Federal Reserve's 2% target.Unit labor costs - the price of labor per single unit of output - increased at a 4.4% rate last quarter. That figure was revised up from the initially estimated 2.8% pace. Growth in unit labor costs for the third quarter was revised down to a 1.0% pace from a 1.8% rate. Unit labor costs increased 2.3% in 2025. "Strong productivity growth alongside stable or declining wage growth means the labor market won't be a source of inflationary pressures in the near term.
PMI Mfg Flash
Recent data shows the Flash Manufacturing PMI came in at 52.4, beating estimates, indicating a positive outlook for the manufacturing sector. The index reflects the first impacts of economic conditions, such as inflation and supply chain disruptions, on manufacturing activity.This data is crucial for businesses and policymakers to make informed decisions regarding production and procurement strategies.
Money Supply
The global money supply has surged to $142 trillion in 2025, a 446% increase since 2000. This growth is primarily driven by China, the U.S., and the European Union, which together account for nearly three-quarters of the total. The increase in money supply has been a response to pandemic stimulus and aggressive credit growth, leading to a 25% jump from 2020-22.
Crypto World Bitcoin
The news suggests continued institutional adoption and capital rotation into Bitcoin. MicroStrategy's massive fundraising plan signals strong corporate confidence despite current unrealized losses, potentially creating sustained buying pressure. The divergence between Bitcoin ETF inflows and gold ETF outflows indicates Bitcoin is gaining ground as an alternative store of value amid elevated interest rates.
MBA Mortgage Applications
Mortgage demand drops more than 10% as rates hit the highest level since October. The average contract interest rate for 30-year fixed-rate mortgages with conforming loan balances increased last week to 6.43% from 6.30%. Refinance demand dropped 15% week to week. Mortgage demand from homebuyers fell 5%.
Current Account
The US current account deficit has shown a significant narrowing in recent quarters, with the fourth quarter recording a contraction of $48.4 billion, or 20.2%, to $190.7 billion. This reduction marks the lowest level since the first quarter of 2021 and represents a decrease of $69.3 billion, or 5.8%, to $1.12 trillion in 2025. The deficit represented 2.4% of GDP, down from 3.1% in the third quarter. This trend is attributed to a rise in primary income and a reduction in the goods trade deficit, partly due to tariffs on imports.
Import and Export Prices
The recent news on import and export prices indicates a significant increase in prices outside of oil. The Bureau of Labor Statistics reported that import prices rose by 1.3% in February, driven by higher fuel and non-fuel costs. Export prices also increased by 1.5%, marking the biggest monthly increase since May 2022. These price increases are attributed to rising input costs for capital equipment, particularly computers and semiconductors, as chip costs accelerated.
EIA Crude Oil Report
The latest EIA crude oil report indicates a 3.0 million barrel increase in U.S. crude oil inventories, signaling oversupply and a potential downward pressure on prices. This report is crucial for understanding the balance between global supply and demand, as it provides real-time insights that monthly reports from OPEC or the International Energy Agency cannot capture with the same frequency.The month-long U.S.-Israeli war with Iran has sent global oil prices surging more than 50%. Retail gasoline prices have jumped $1 to an average of $3.98 per gallon, data from motorist advocacy group AAA showed, while the S&P 500 (.SPX), opens new tab index has dropped about 6.7%.
Hedging Gold
Gold prices extended their decline on Tuesday, weighed down by persistent Middle East tensions that fanned worries of inflation and expectations of higher interest rates globally. Spot gold fell 0.4% to $4,389.26 per ounce by 2:11 p.m. ET (1811 GMT) after hitting its lowest since November on Monday.
Jobless Initial Claims
New applications for U.S. unemployment benefits rose slightly last week, suggesting the labor market remains stable and likely giving the Federal Reserve scope to hold interest rates steady while monitoring inflation risks from the conflict in the Middle East. The report from the Labor Department on Thursday also showed the number of people collecting unemployment checks in mid-March was the lowest in nearly two years. Part of the decline, however, was probably due to people exhausting their eligibility for aid, which is limited to 26 weeks in most states.
Fed Balance Sheet
Federal Reserve Governor Stephen Miran on Thursday said reducing the financial system's demand for high levels of liquidity could allow the central bank to substantially cut the size of its still large balance sheet and facilitate an easier stance of monetary policy than would otherwise be the case. Miran said easing liquidity regulations, tweaking bank stress tests, together with destigmatizing the usage of Fed liquidity facilities like standing repo operations and the discount window, as well as the Fed engaging in more active interventions to manage market liquidity, could collectively allow the now $6.7 trillion balance sheet to be notably smaller over time.
Mortgage Rates
Average US long-term mortgage rate leaps to 6.38%, the highest level in more than 6 months. he average long-term U.S. mortgage rate climbed this week to its highest level in more than six months, driving up borrowing costs during what’s typically the busiest time of the year for prospective homebuyers. The benchmark 30-year fixed rate mortgage rate rose to 6.38% from 6.22% last week, mortgage buyer Freddie Mac said Thursday. One year ago, the rate averaged 6.65%.
US Trade in Goods
Report Delayed due to the government shut down,.
Consumer Sentiment
US consumer sentiment slides to three-month low as war fans inflation fears. U.S. consumer sentiment fell more than expected in March, touching a three-month low, as war in the Middle East stoked inflation worries and cast a shadow over the economic outlook.The decline, reported by the University of Michigan's Surveys of Consumers on Friday, occurred across political party affiliation and age groups, with large decreases among middle- and higher-income consumers as well as those owning stocks.Consumer sentiment index falls to 53.3 in March from 56.6 in February.The University of Michigan said its Consumer Sentiment Index dropped to a final reading of 53.3 this month, the lowest reading since December, from 55.5 earlier. Economists polled by Reuters had forecast the index would ease to 54.0.
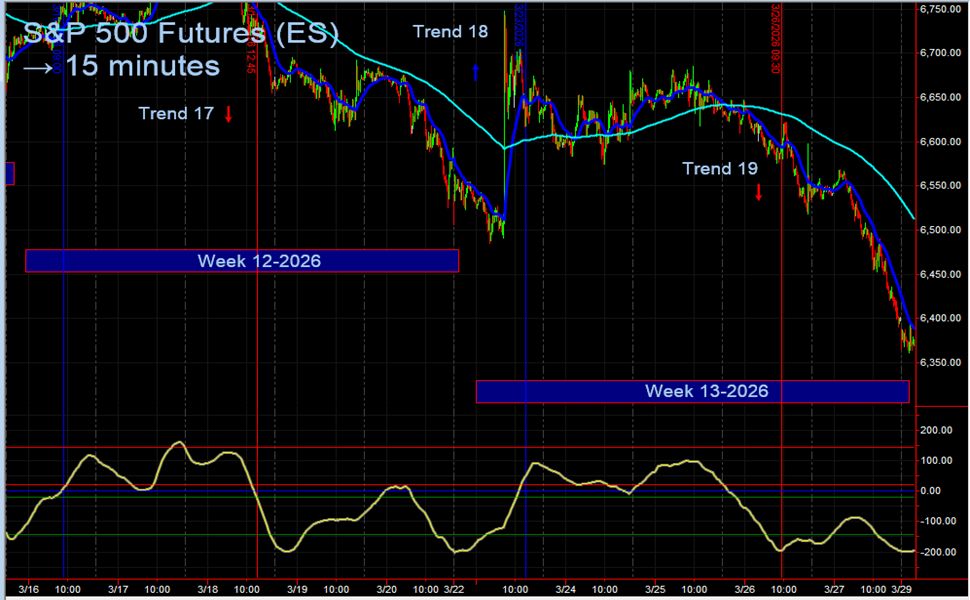
S&P 500 Index
U.S. stocks tumbled on Friday, with each of the three major U.S. indexes closing at their lowest levels in over seven months and the Dow confirming it was in correction territory as the month-long Middle East war continued to suppress risk appetite. The Dow, S&P 500 and Nasdaq each suffered their fifth straight weekly decline, the longest such streak in nearly four years. The Dow is now down more than 10% from its February 10 record close, becoming the latest major index to confirm a correction, commonly defined as a drop of 10% from its prior high. The Dow follows the Nasdaq in crossing the correction threshold while the Russell 2000 (.RUT), opens new tab, which was the first on the correction path, confirmed it last Friday.
VIX Volatility Index
The CBOE Volatility Index (.VIX), opens new tab, considered Wall Street's fear gauge, was up 3.61 points to close at 31.05, its highest close since April 21.
Geopolitical Risks
U.S. stocks tumbled on Friday, the 3 major U.S. indexes closing at their lowest levels in over 7 months Markets took little solace from U.S. President Donald Trump's announcement that he gave Iran another 10 days to reopen the Strait of Hormuz or face the destruction of its energy plants, after Iran rejected his proposals to end the war that began with U.S.-Israeli air strikes on Iran. |