 |
 |
|
 |
Productivity and Costs (ULC)| Inflation |
|
 |
|
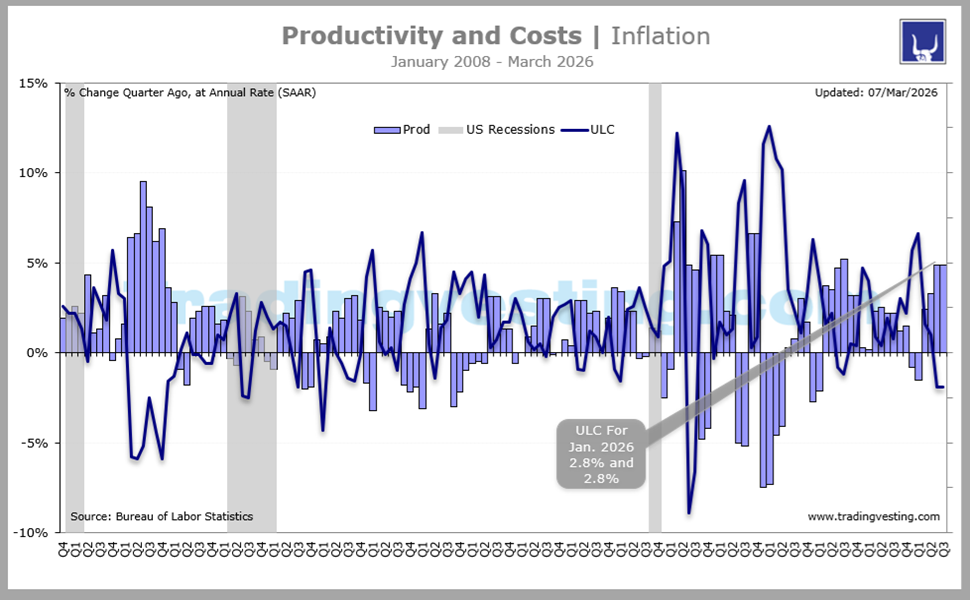
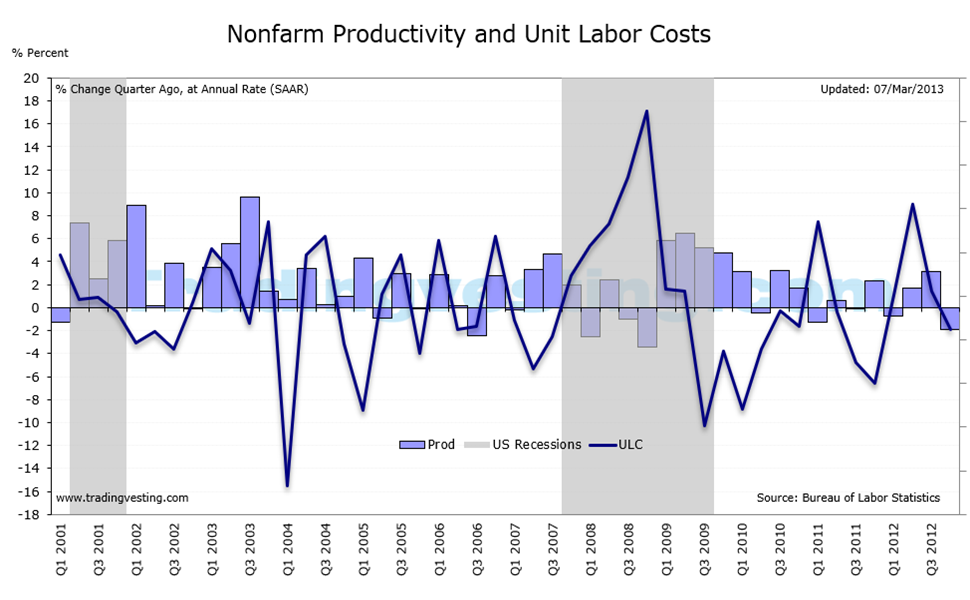
Productivity measures the goods and services generated by an economy while Unit-labor costs reflect how much it costs a business to produce one unit of output. In the long run, higher productivity usually results in higher profits. Read more...
|
|
|
|
|
|
|
| |
|
| |
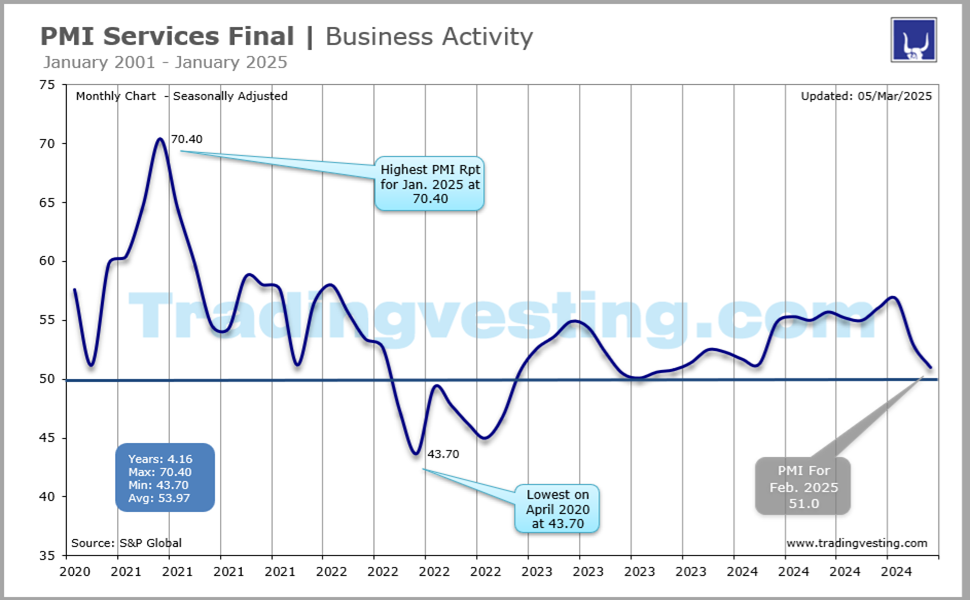
 1. Productivity and Costs ( 1 of 5 ) 1. Productivity and Costs ( 1 of 5 ) 2. ISM Services Index ( 2 of 5 ) 2. ISM Services Index ( 2 of 5 ) 3. Leading Indicators (3 of 5) 3. Leading Indicators (3 of 5) 4. Chicago Fed National Actvity Index (4 of 5) 4. Chicago Fed National Actvity Index (4 of 5)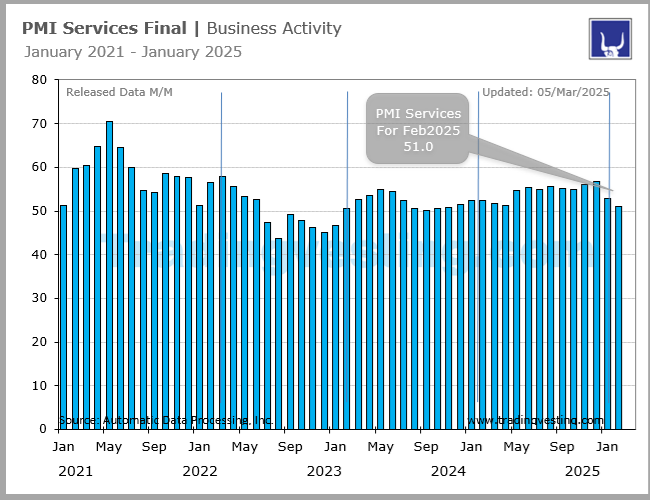 5. PMI Services Final ( 5 of 5 ) 5. PMI Services Final ( 5 of 5 )
|
 |
|
|
|
|
| |
|
→ Big Chart |
|
→ Release |
|
| |
|
|
|
|
|
|
|
|
|
|
|
|
|
|
|
|
|
|
|
 |
|
Big Chart | 2024 |
 |
|
Productivity and Costs | Inflation |
|
Today's Week |
 |
|
|
|
|
|
|
|
|
|
|
|
|
|
| |
|
|
|
|
|
|
|
|
|
|
|
|
|
|
|
|
|
|
|
|
|
Slides | Six 6 |
|
|
Productivity and Costs | Inflation |
|
Today's Week |
|
|
|
|
|
|
|
|
|
|
|
|
|
|
| |
|
|
|
|
|
|
|
|
|
|
|
|
|
|
|
|
|
|
|
|
|
Release Schedule | 2026 |
|
|
Productivity and Costs | Inflation |
|
Today's Week |
|
|
|
|
|
|
|
|
|
|
|
|
|
Nonfarm Productivity and Unit Labor Costs
(At 8:30 a.m ET)
| SCHEDULE 2026 |
No 1 |
No 2 |
No 3 |
No 4 |
No 5 |
No 6 |
No 7 |
No 8 |
| Release | Week |
|
|
|
|
|
|
|
|
| Release | Date |
|
|
|
|
|
|
|
|
| Release | Day |
|
|
|
|
|
|
|
|
 |
|
|
|
|
|
|
|
|
| NONFARM PRODUCTIVITY |
No 1 |
No 2 |
No 3 |
No 4 |
No 5 |
No 6 |
No 7 |
No 8 |
| Prior |
4.9% |
2.8% |
... |
... |
... |
... |
... |
... |
| Prior Revised |
5.2% |
|
... |
... |
... |
... |
... |
... |
| CONSENSUS |
1.9% |
2.4% |
... |
... |
... |
... |
... |
... |
| Consensus Low |
1.5% |
2.0% |
... |
... |
... |
... |
... |
... |
| Consensus High |
4.0% |
2.8% |
... |
... |
... |
... |
... |
... |
| PROD ANNUAL RATE |
2.8% |
1.8% |
... |
... |
... |
... |
... |
... |
|
|
|
|
|
|
|
|
|
| UNIT LABOR COSTS (ULC) |
No 1 |
No 2 |
No 3 |
No 4 |
No 5 |
No 6 |
No 7 |
No 8 |
| Prior |
-1.9% |
2.8% |
... |
... |
... |
... |
... |
... |
| Prior Revised |
-1.8% |
... |
... |
... |
... |
... |
... |
... |
| CONSENSUS |
2.1% |
3.0% |
... |
... |
... |
... |
... |
... |
| Consensus Range |
-0.7% |
2.2% |
... |
... |
... |
... |
... |
... |
| Consensus Range |
2.6% |
3.4% |
... |
... |
... |
... |
... |
... |
| ULC ANNUAL RATE |
2.8% |
4.4% |
... |
... |
... |
... |
... |
... |
|
|
|
|
|
|
|
|
|
| RATING |
|
|
|
|
|
|
|
|
| Released For: |
Q4(p)-2025 |
Q4(r)-2025 |
Q1(p)-2026 |
Q1(r)-2026 |
Q2(p)-2026 |
Q2(r)-2026 |
Q3(p)-2026 |
Q3(r)-2026 |
|
|
|
|
|
|
|
|
|
|
|
| |
|
| |
|
|
|
|
|
|
|
|
|
|
|
Release Schedule | 2025 |
|
|
Productivity and Costs | Inflation |
|
Today's Week |
|
|
|
|
|
|
|
|
|
|
|
|
|
Nonfarm Productivity and Unit Labor Costs
(At 8:30 a.m ET)
| SCHEDULE 2025 |
No 1 |
No 2 |
No 3 |
No 4 |
No 5 |
No 6 |
No 7 |
No 8 |
| Release | Week |
|
|
|
|
|
|
|
|
| Release | Date |
|
|
|
|
|
|
|
|
| Release | Day |
|
|
|
|
|
|
|
|
|
|
|
|
|
|
|
|
|
| NONFARM PRODUCTIVITY |
No 1 |
No 2 |
No 3 |
No 4 |
No 5 |
No 6 |
No 7 |
No 8 |
| Prior |
2.2% |
1.2% |
1.5% |
-0.8% |
-1.5% |
2.4% |
3.3% |
4.9% |
| Prior Revised |
2.3% |
... |
1.7% |
... |
-1.8% |
... |
4.1% |
... |
| CONSENSUS |
1.8% |
1.2% |
-0.5% |
-0.8% |
1.9% |
2.5% |
3.6% |
4.9% |
| Consensus Low |
1.0% |
1.2% |
-1.8% |
-0.8% |
-0.8% |
2.4% |
1.0% |
4.8% |
| Consensus High |
2.2% |
1.2% |
-0.4% |
-0.7% |
2.5% |
3.4% |
5.4% |
4.9% |
| PROD ANNUAL RATE |
1.2% |
1.5% |
-0.8% |
-1.5% |
2.4% |
3.3% |
4.9% |
4.9% |
|
|
|
|
|
|
|
|
|
| UNIT LABOR COSTS (ULC) |
No 1 |
No 2 |
No 3 |
No 4 |
No 5 |
No 6 |
No 7 |
No 8 |
| Prior |
0.8% |
3.0% |
2.2% |
5.7% |
6.6% |
1.6% |
1.0% |
-1.9% |
| Prior Revised |
0.5% |
... |
2.0% |
... |
6.9% |
... |
-2.9% |
... |
| CONSENSUS |
3.3% |
3.0% |
5.2% |
5.7% |
2.1% |
1.6% |
0.8% |
-1.9% |
| Consensus Range |
1.3% |
3.0% |
4.1% |
5.5% |
1.3% |
0.7% |
-1.4% |
-2.0% |
| Consensus Range |
3.9% |
3.0% |
6.2% |
5.7% |
5.0% |
1.6% |
2.0% |
-1.4% |
| ULC ANNUAL RATE |
3.0% |
2.2% |
5.7% |
6.6% |
1.6% |
1.0% |
-1.9% |
-1.9% |
|
|
|
|
|
|
|
|
|
| RATING |
|
|
|
|
|
|
|
|
| Released For: |
Q4(p)-2024 |
Q4(r)-2024 |
Q1(p)-2025 |
Q1(r)-2025 |
Q2(p)-2025 |
Q2(r)-2025 |
Q3(p)-2025 |
Q3(r)-2025 |
|
|
|
|
|
|
|
|
|
|
|
| |
|
| |
|
|
|
|
|
|
|
|
|
|
|
Release Schedule | 2024 |
|
|
Productivity and Costs | Inflation |
|
Today's Week |
|
|
|
|
|
|
|
|
|
|
|
|
|
Nonfarm Productivity and Unit Labor Costs
(At 8:30 a.m ET)
| SCHEDULE 2024 |
No 1 |
No 2 |
No 3 |
No 4 |
No 5 |
No 6 |
No 7 |
No 8 |
| Release | Week |
|
|
|
|
|
|
|
|
| Release | Date |
|
|
|
|
|
|
|
|
| Release | Day |
|
|
|
|
|
|
|
|
| Nonfarm Productivity - Annual Rate |
No 1 |
No 2 |
No 3 |
No 4 |
No 5 |
No 6 |
No 7 |
No 8 |
| Prior: |
5.2% |
3.2% |
3.2% |
0.3% |
0.2% |
2.3% |
2.5% |
2.2% |
| Prior Revised: |
4.9% |
... |
... |
... |
0.4% |
.. |
2.1% |
... |
| Consensus: |
2.3% |
3.1% |
0.9% |
0.2% |
1.6% |
2.4% |
2.45% |
2.20% |
| Consensus Low |
1.1% |
2.3% |
-1.0% |
-0.1% |
0.2% |
2.3% |
2.3% |
2.2% |
| Consensus High |
3.0% |
3.2% |
1.8% |
1.1% |
2.8% |
2.9% |
3.3% |
2.9% |
| Actual Q/Q: |
3.2% |
3.2% |
0.3% |
0.2% |
2.3% |
2.5% |
2.2% |
2.2% |
|
|
|
|
|
|
|
|
|
| Unit Labor Costs - Annual Rate |
No 1 |
No 2 |
No 3 |
No 4 |
No 5 |
No 6 |
No 7 |
No 8 |
| Prior: |
-1.2% |
0.5% |
0.4% |
4.7% |
4.0% |
0.9% |
0.4% |
1.9% |
| Prior Revised: |
-1.1% |
... |
... |
... |
3.8% |
... |
2.4% |
... |
| Consensus: |
2.1% |
0.7% |
3.3% |
4.7% |
1.9% |
0.8% |
1.0% |
1.9% |
| Consensus Range |
0.5% |
0.5% |
1.8% |
2.4% |
1.1% |
-0.3% |
0.5% |
0.7% |
| Consensus Range |
3.1% |
1.8% |
6.4% |
5.0% |
3.2% |
0.9% |
2.8% |
2.0% |
| Actual Q/Q: |
0.5% |
0.4% |
4.7% |
4.0% |
0.9% |
0.4% |
1.9% |
0.8% |
|
|
|
|
|
|
|
|
|
| Rating FOR BOTH: : |
|
|
|
|
|
|
|
|
| Released For: |
Q4(p)-2023 |
Q4(r)-2023 |
Q1(p)-2024 |
Q1(r)-2024 |
Q2(p)-2024 |
Q2(r)-2024 |
Q3(p)-2024 |
Q3(r)-2024 |
|
|
|
|
|
|
|
|
|
|
|
| |
|
| |
|
|
|
|
|
|
|
|
|
|
|
Release Schedule | 2023 |
|
|
Productivity and Costs | Inflation |
|
Today's Week |
|
|
|
|
|
|
|
|
|
|
|
|
|
Nonfarm Productivity and Unit Labor Costs
(At 8:30 a.m ET)
| RELEASE SCHEDULE 2023 |
No 1 |
No 2 |
No 3 |
No 4 |
No 5 |
No 6 |
No 7 |
No 8 |
| Release | Week |
|
|
|
|
|
|
|
|
| Release | Date |
|
|
|
|
|
|
|
|
| Release | Day |
|
|
|
|
|
|
|
|
| Nonfarm Productivity |
No 1 |
No 2 |
No 3 |
No 4 |
No 5 |
No 6 |
No 7 |
No 8 |
| Prior: |
0.8% |
3.0% |
1.7% |
-2.7% |
-2.1% |
3.7% |
3.5% |
4.7% |
| Prior Revised: |
1.4% |
No... |
1.6% |
... |
-1.2% |
... |
3.6% |
... |
| Consensus: |
2.4% |
2.5% |
0.0% |
-2.7% |
1.3% |
3.6% |
4.2% |
4.8% |
| Consensus Low |
0.5% |
1.6% |
-2.3% |
-2.8% |
0.8% |
2.0% |
2.8% |
1.2% |
| Consensus High |
2.7% |
3.0% |
0.8% |
-2.4% |
3.5% |
3.8% |
4.5% |
5.0% |
| Actual Q/Q: |
3.0% |
1.7% |
-2.7% |
-2.1% |
3.7% |
3.5% |
4.7% |
5.2% |
|
|
|
|
|
|
|
|
|
| Unit Labor Costs |
No 1 |
No 2 |
No 3 |
No 4 |
No 5 |
No 6 |
No 7 |
No 8 |
| Prior: |
2.4% |
1.1% |
3.2% |
6.3% |
4.2% |
1.6% |
2.2% |
-0.8% |
| Prior Revised: |
2.0% |
... |
3.3% |
... |
3.3% |
... |
3.2% |
... |
| Consensus: |
1.5% |
1.4% |
3.9% |
6.3% |
2.6% |
1.7% |
0.7% |
-0.9% |
| Consensus Range |
1.2% |
1.0% |
3.0% |
4.6% |
0.5% |
1.5% |
0.0% |
-1.0% |
| Consensus Range |
2.5% |
1.9% |
6.9% |
6.4% |
3.5% |
3.4% |
2.2% |
3.0% |
| Actual Q/Q: |
1.1% |
3.2% |
6.3% |
4.2% |
1.6% |
2.2% |
-0.8% |
-1.2% |
|
|
|
|
|
|
|
|
|
| Rating FOR BOTH: : |
|
|
|
|
|
|
|
|
| Released For: |
Q4(p)-2022 |
Q4(r)-2022 |
Q1(p)-2023 |
Q1(r)-2023 |
Q2(p)-2023 |
Q2(r)-2023 |
Q3(p)-2023 |
Q3(r)-2023 |
|
|
|
|
|
|
|
|
|
|
|
| |
|
| |
|
|
|
|
|
|
|
|
|
|
|
Release Schedule | 2022 |
|
|
Productivity and Costs | Inflation |
|
Today's Week |
|
|
|
|
|
|
|
|
|
|
|
|
|
Nonfarm Productivity and Unit Labor Costs
(At 8:30)
| RELEASE SCHEDULE 2022 |
No 1 |
No 2 |
No 3 |
No 4 |
No 5 |
No 6 |
No 7 |
No 8 |
| Release | Week |
|
|
|
|
|
|
|
|
| Release | Date |
|
|
|
|
|
|
|
|
| Release | Day |
|
|
|
|
|
|
|
|
| Nonfarm Productivity |
No 1 |
No 2 |
No 3 |
No 4 |
No 5 |
No 6 |
No 7 |
No 8 |
| Prior: |
-5.2% |
6.6% |
6.6% |
-7.5% |
-7.3% |
-4.6% |
-4.1% |
0.3% |
| Prior Revised: |
-5.0% |
... |
6.3% |
... |
-7.4% |
... |
... |
... |
| Consensus: |
2.7% |
6.7% |
-2.5% |
-7.5% |
-4.5% |
-4.4% |
0.5% |
0.4% |
| Consensus Low |
1.4% |
6.4% |
-7.4% |
-7.5% |
-5.1% |
-4.6% |
-3.2% |
0.3% |
| Consensus High |
6.1% |
6.7% |
-1.0% |
-7.5% |
-1.8% |
-3.5% |
1.9% |
0.8% |
| Actual Q/Q: |
6.6% |
6.6% |
-7.5% |
-7.3% |
-4.6% |
-4.1% |
0.3% |
0.8% |
|
|
|
|
|
|
|
|
|
| Unit Labor Costs |
No 1 |
No 2 |
No 3 |
No 4 |
No 5 |
No 6 |
No 7 |
No 8 |
| Prior: |
9.6% |
0.3% |
0.3% |
11.6% |
12.6% |
10.8% |
10.2% |
3.5% |
| Prior Revised: |
9.3% |
... |
1.0% |
... |
12.7% |
... |
8.9% |
... |
| Consensus: |
1.5% |
0.3% |
6.8% |
11.6% |
9.3% |
10.7% |
4.0% |
3.3% |
| Consensus Range |
1.0% |
0.3% |
3.8% |
11.6% |
6.7% |
9.5% |
2.4% |
3.0% |
| Consensus Range |
6.0% |
0.5% |
12.5% |
11.7% |
10.7% |
11.0% |
9.1% |
3.5% |
| Actual Q/Q: |
0.3% |
0.3% |
11.6% |
12.6% |
10.8% |
10.2% |
3.5% |
2.4% |
|
|
|
|
|
|
|
|
|
| Rating FOR BOTH: : |
|
|
|
|
|
|
|
|
| Released For: |
Q4(p)-2021 |
Q4(r)-2021 |
Q1(p)-2022 |
Q1(r)-2022 |
Q2(p)-2022 |
Q2(r)-2022 |
Q3(p)-2022 |
Q3(r)-2022 |
|
|
|
|
|
|
|
|
|
|
|
| |
|
| |
|
|
|
|
|
|
|
|
|
|
|
Release Schedule | 2021 |
|
|
Productivity and Costs | Inflation |
|
Today's Week |
|
|
|
|
|
|
|
|
|
|
|
|
|
Nonfarm Productivity and Unit Labor Costs
(At 8:30)
| RELEASE SCHEDULE 2021 |
No 1 |
No 2 |
No 3 |
No 4 |
No 5 |
No 6 |
No 7 |
No 8 |
| Release | Week |
|
|
|
|
|
|
|
|
| Release | Date |
|
|
|
|
|
|
|
|
| Release | Day |
|
|
|
|
|
|
|
|
| Nonfarm Productivity |
No 1 |
No 2 |
No 3 |
No 4 |
No 5 |
No 6 |
No 7 |
No 8 |
| Prior: |
2.9% |
-4.8% |
-4.2% |
5.4% |
5.4% |
2.3% |
2.1% |
-5.0% |
| Prior Revised: |
3.2% |
... |
... |
... |
... |
... |
2.4% |
... |
| Consensus: |
-1.3% |
-4.7% |
... |
5.5% |
... |
... |
-1.5% |
... |
| Consensus Range |
-3.5%/0.8% |
-4.8%/-4.6% |
.. |
5.4%/6.2% |
... |
... |
-3.2%/0.8% |
... |
| Actual Q/Q: |
-4.8% |
-4.2% |
5.4% |
5.4% |
2.3% |
2.1% |
-5.0% |
-5.2% |
|
|
|
|
|
|
|
|
|
| Unit Labor Costs |
No 1 |
No 2 |
No 3 |
No 4 |
No 5 |
No 6 |
No 7 |
No 8 |
| Prior: |
1.9% |
6.8% |
6.0% |
-0.3% |
1.7% |
7.9% |
1.3% |
8.3% |
| Prior Revised: |
-2.3% |
... |
... |
... |
... |
... |
1.1% |
... |
| Consensus: |
3.1% |
6.7% |
... |
-0.3% |
... |
... |
5.3% |
... |
| Consensus Range |
1.0%/5.8% |
3.8%/6.8% |
... |
-0.5%/2.1% |
... |
... |
2.8%/8.3% |
... |
| Actual Q/Q: |
6.8% |
6.0% |
-0.3% |
1.7% |
7.9% |
1.3% |
8.3% |
9.6% |
|
|
|
|
|
|
|
|
|
| Rating FOR BOTH: : |
|
|
|
|
|
|
|
|
| Released For: |
Q4(p)-2020 |
Q4(r)-2020 |
Q1(p)-2021 |
Q1(r)-2021 |
Q2(p)-2021 |
Q2(r)-2021 |
Q3(p)-2021 |
Q3(r)-2021 |
|
|
|
|
|
|
|
|
|
|
|
| |
|
| |
|
Legends: |
 |
Delayed |
 |
Positive View |
 |
Negative View |
 |
Neutral View |
 |
Non Available |
|
|
|
|
|
|
|
|
|
|
|
|
|
|
|
|
|
|
|
|
| |
|
|
|
|
|
|
|
|
|
|
|
|
|
|
|
|
|
|
|
|
|
Brief News | 2026 |
|
|
Productivity and Costs | Inflation |
|
Today's Week |
|
|
|
|
|
|
|
|
|
|
|
|
|
Nonfarm Productivity and Unit Labor Costs
(At 8:30 am ET)
| DATE/WEEK |
HIGHLIGHTS |
FOR |
PROD |
|
Productivity and Costs |
No 8 |
... |
|
Q3(r)2026 |
|
| |
|
|
|
Productivity and Costs |
No 7 |
... |
|
Q3(p)2026 |
|
| |
|
|
|
Productivity and Costs |
No 6 |
... |
|
Q2(r)2026 |
|
| |
|
|
|
Productivity and Costs |
No 5 |
... |
|
Q2(p)2026 |
|
| |
|
|
|
Productivity and Costs |
No 4 |
... |
|
Q1(r)2026 |
|
| |
|
|
|
Productivity and Costs |
No 3 |
... |
|
Q1(p)2026 |
|
| |
|
|
|
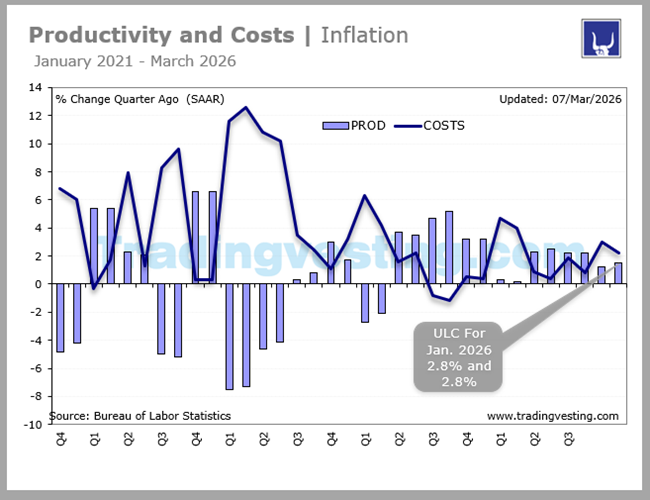
U.S. worker productivity growth slowed more than initially thought in the fourth quarter, but the trend remained solid and could get a boost from the rapid adoption of artificial intelligence by businesses.The sharp downgrade to productivity last quarter, which was reported by the Labor Department on Tuesday, pushed unit labor costs sharply higher amid strong rises in labor compensation.Though economists viewed the surge in costs as temporary, given labor market softness, they said the pace was incompatible with a return of inflation back down to the Federal Reserve's 2% target.Unit labor costs - the price of labor per single unit of output - increased at a 4.4% rate last quarter. That figure was revised up from the initially estimated 2.8% pace. |
No 2 |
4.4% |
|
Q4(r)2025 |
|
| |
|
|
|
US labor market holding steady; worker productivity still strong in Q4. Data from the Labor Department on Thursday showed worker productivity slowed in the fourth quarter, the trend remained strong, helping to curb growth in labor costs in 2025. Labor market stability. Worker productivity slows to a 2.8% rate in fourth quarter. |
No 1 |
2.8% |
|
Q4(p)2025 |
|
| |
|
|
|
In the third quarter of 2025, unit labor costs in the nonfarm business sector decreased by 1.9 percent, reflecting a 2.9-percent increase in hourly compensation and a 4.9-percent increase in productivity. This indicates a trend of rising productivity leading to a decrease in unit labor costs, which can be influenced by various factors such as changes in productivity and hourly compensation. |
No 8 |
-1.9% |
|
Q3(r)2025 |
|
| |
|
|
|
Labor Productivity: Increased at an annualized rate of 4.9% in the third quarter of 2025, driven by a 5.4% increase in output and a 0.5% rise in hours worked. This was a significant jump from the upwardly revised 4.1% growth in the second quarter. Unit Labor Costs: Decreased by 1.9% in the third quarter. This decline, following a drop in the previous quarter, marks the first back-to-back decline in unit labor costs since 2019. and Costs |
No 7 |
-1.9% |
|
Q3(p)2025 |
|
| |
|
|
|
|
|
|
|
|
| Labor productivy: important |
|
Productivity: a measure of worker output |
|
|
|
| |
|
|
|
|
|
|
|
|
|
|
|
|
|
|
|
Brief News | 2026 |
|
|
Productivity and Costs | Inflation |
|
Today's Week |
|
|
|
|
|
|
|
|
|
|
|
|
|
Nonfarm Productivity and Unit Labor Costs
(At 8:30 am ET)
| DATE/WEEK |
HIGHLIGHTS |
FOR |
PROD |
|
ULC for Q3 Delayed due to the government shut down,. |
No 8 |
... |
|
Q3(r)2025 |
|
| |
|
|
|
ULC for Q3 Delayed due to the government shut down,. |
No 7 |
... |
|
Q3(p)2025 |
|
| |
|
|
|
U.S. worker productivity grew faster than initially thought in the second quarter, curbing the rise in labor costs. Nonfarm productivity, which measures hourly output per worker, increased at a 3.3% annualized rate last quarter, the Labor Department's Bureau of Labor Statistics said on Thursday.That figure was revised up from the previously reported 2.4% pace of increase. Economists polled by Reuters had forecast productivity growth would be upgraded to a 2.7% rate. Unit labor costs - the price of labor per single unit of output - increased at a 1.0% rate last quarter. They were revised down from the previously reported 1.6% growth pace. Labor costs increased at a 2.5% rate from a year ago, down from the previously reported 2.6% pace.
|
No 6 |
1.0% |
|
Q2(r)2025 |
|
| |
|
|
|
The Labor Department also said worker productivity rebounded more than expected in the second quarter, easing a surge in labor costs at the start of the year. Nonfarm business sector productivity increased 2.4% in the April-June period after declining by 1.8% in the first three months of the year, BLS reported. Economists polled by Reuters had expected productivity to rise by 2.0%. Worker output increased by 3.7%, the largest improvement since the third quarter of 2023, while unit labor cost growth moderated to 1.6% from an upwardly revised 6.9% in the first quarter. The data may be indicative of ongoing investments by businesses in labor-saving technologies like artificial intelligence, economists said. |
No 5 |
1.6% |
|
Q2(p)2025 |
|
| |
|
|
|
Nonfarm business sector labor productivity decreased 1.5 percent in the first quarter of 2025, the U.S. Bureau of Labor Statistics reported today, as output decreased 0.2 percent and hours worked increased 1.3 percent. Unit labor costs in the nonfarm business sector increased 6.6 percent in the first quarter of 2025, reflecting a 5.0-percent increase in hourly compensation and a 1.5-percent decrease in productivity. Unit labor costs increased 1.9 percent over the last four quarters. U.S. nonfarm business sector labor productivity decreased by 1.5% in the first quarter of 2025, marking the first decline since the second quarter of 2022, primarily due to a decrease in output (-0.2%) and an increase in hours worked (+1.3%). |
No 4 |
6.6% |
|
Q1(r)2025 |
|
| |
|
|
|
U.S. worker productivity dropped in the first quarter for the first time in nearly three years, resulting in a surge in labor costs that could squeeze margins for businesses at a time when they are facing rising costs from tariffs. Nonfarm productivity, which measures hourly output per worker, fell at a 0.8% annualized rate last quarter, the Labor Department's Bureau of Labor Statistics said on Thursday. That was the first decline since the second quarter of 2022 and followed an upwardly revised 1.7% growth pace in the October-December quarter. The drop in productivity was flagged by the government's advanced gross domestic product report for the first quarter published last week, which showed the economy contracting at a 0.3% annualized rate, the first decline in three years. |
No 3 |
5.7% |
|
Q1(p)2025 |
|
| |
|
|
|
U.S. worker productivity grew a bit faster than initially thought in the fourth quarter, helping to curb labor costs and providing a boost in the fight against inflation. Nonfarm productivity, which measures hourly output per worker, increased at a 1.5% annualized rate last quarter, the Labor Department's Bureau of Labor Statistics said on Thursday. That was revised higher from the previously estimated 1.2% pace. Economists polled by Reuters had expected productivity would be unrevised at a 1.2% pace. Productivity increased at a 2.0% rate from a year ago, up from the previously estimated 1.6% pace. It grew 2.7% in 2024, revised up by 0.4 percentage point. Productivity increased 1.8% in 2023, an upward revision to the previously reported 1.6%. Unit labor costs - the price of labor per single unit of output - increased at a 2.2% rate in the October-December quarter, revised down from the previously estimated 3.0% pace. That followed a 1.5% pace of decline in the third qu |
No 2 |
2.2% |
|
Q4(r)2024 |
|
| |
|
|
|
Nonfarm productivity, which measures hourly output per worker, increased at a 1.2% annualized rate in the fourth quarter after growing at an upwardly revised 2.3% pace in the July-September quarter. Economists had forecast productivity would advance at a 1.4% rate after increasing at a previously reported 2.2% pace in the third quarter. Productivity increased at a 1.6% rate from a year ago. It grew 2.3% in 2024, accelerating from 1.6% in 2023. Productivity has expanded at a 1.8% rate since the fourth quarter of 2019, higher than the 1.5% pace in the prior business cycle that ran from the fourth quarter of 2007 through the fourth quarter of 2019. It is, however, below the long-term rate of 2.1%. |
No 1 |
3.0% |
|
Q4(p)2024 |
|
| |
|
|
|
|
|
|
|
|
| Labosr productivy es lo importante |
|
Productivity, a measure of worker output |
|
|
|
| |
|
|
|
|
|
|
|
|
|
|
|
|
|
|
|
Brief News | 2024 |
|
|
Productivity and Costs | Inflation |
|
Today's Week |
|
|
|
|
|
|
|
|
|
|
|
|
|
Nonfarm Productivity and Unit Labor Costs
(At 8:30 am ET)
| DATE/WEEK |
HIGHLIGHTS |
FOR |
PROD |
|
While the Labor Department released a report on Tuesday showing the jump by U.S. labor productivity in the third quarter was unrevised from the previous estimate, the report also showed a downward revision to the increase by U.S. unit labor costs. The report said labor productivity shot up by 2.2 percent in the third quarter, unrevised from the initial estimate and in line with economist estimates. Nonfarm business sector labor productivity increased 2.2 percent in the third quarter of 2024, the U.S. Bureau of Labor Statistics reported today, reflecting no revision from the preliminary estimate. Output and hours worked were also unrevised, increasing 3.5 percent and 1.2 percent respectively. (All quarterly percent changes in this release are seasonally adjusted annualized rates.) From the same quarter a year ago, nonfarm business sector labor productivity increased 2.0 percent in the third quarter of 2024, as previously reported. |
No 8 |
2.2% |
|
Q3(r)2024 |
|
| |
|
|
|
US worker productivity rises moderately in third quarter; labor costs elevated. U.S. worker productivity increased moderately in the third quarter, resulting in only a gradual slowdown in labor costs that could cast a cloud over the inflation outlook.Nonfarm productivity, which measures hourly output per worker, increased at a 2.2% annualized rate last quarter, the Labor Department's Bureau of Labor Statistics said on Thursday. Data for the second quarter was revised lower to show productivity rising at a 2.1% pace instead of the previously reported 2.5% rate. Economists polled by Reuters had forecast productivity advancing at a 2.3% rate. Productivity increased at a 2.0% pace from a year ago. The moderate pace of productivity does not bode well for the inflation and interest rate outlook. Unit labor costs - the price of labor per single unit of output - rose at a 1.9% rate in the July-September quarter. That followed a 2.4% pace of expansion in the second quarter. Labor costs increased at a 3.4% rate from a year ago. |
No 7 |
2.2% |
|
Q3(p)2024 |
|
| |
|
|
|
The productivity of American workers rose by a revised 2.5% annual rate in the second quarter, the government said Thursday. The increase was originally put at 2.3% in the preliminary report last month. U.S. productivity in the second quarter was better than initial estimates Output per hour up 2.5%. The estimate for Nonfarm productivity wS 2.4% and the Unit Labor Costs was 0.85%. |
No 6 |
2.5% |
|
Q2(r)2024 |
|
| |
|
|
|
Productivity increased 2.3 percent in the nonfarm business sector in the second quarter of 2024; unit labor costs increased 0.9 percent (seasonally adjusted annual rates). In manufacturing, productivity increased 1.8 percent and unit labor costs increased 3.2 percent. |
No 5 |
2.3% |
|
Q2(p)2024 |
|
| |
|
|
|
US productivity growth slowed in early 2024. Nonfarm productivity, which measures hourly output per worker, increased at a 0.2 per cent annualised rate in the first quarter, revised down from an initial estimate of 0.3 per cent one month ago. Economists polled by Reuters had estimated a revision down to 0.1 per cent. US worker productivity grew slightly less than previously estimated in the first quarter but exceeded market expectations, and unit labour costs rose by less than first thought, data from the Labor Department showed on Thursday (Jun 6), although the revision seems unlikely to allay Federal Reserve officials’ hesitance to turn to rate cuts in the near term. |
No 4 |
0.2% |
|
Q1(r)2024 |
|
| |
|
|
|
US Labor Costs Rise by Most in a Year as Productivity Cools. Unit labor costs jump 4.7% after muted second half of 2023.Sustained productivity slowdown could limit inflation progress. US labor costs increased in the first quarter by the most in a year as productivity gains slowed, potentially adding to risks inflation will remain elevated. Unit labor costs, or what a business pays employees to produce one unit of output after taking into account changes in productivity, climbed at a 4.7% annual rate. That marked a notable jump after muted gains in the second half of 2023. |
No 3 |
0.3% |
|
Q1(p)2024 |
|
| |
|
|
|
Q4 2023: U.S. Nonfarm Productivity Soars, Fed Eyes Moderate Costs for Rate Strategy. In the fourth quarter of 2023, Nonfarm Business Sector Labor Productivity saw an impressive increase of 3.2%, with output rising by 3.5% and hours worked by a modest 0.3%. This improvement in productivity, particularly over a year-on-year basis where a 2.6% increase was recorded, demonstrates a resilient and efficient labor market. |
No 2 |
3.2% |
|
Q4(r)2023 |
|
| |
|
|
|
Economic reports Thursday brought good news for productivity and inflation, though initial jobless claims ticked higher than anticipated. Productivity, a measure of worker output, increased 3.2% in the fourth quarter, better than the 2.5% estimate from Dow Jones, the Labor Department’s Bureau of Labor Statistics reported. At the same time, unit labor costs, or the difference between hourly pay and productivity, rose just 0.5%, below the 1.1% estimate. |
No 1 |
3.2% |
|
Q4(p)2023 |
|
| |
|
|
|
|
|
|
|
|
| |
|
|
|
|
|
| |
|
|
|
|
|
|
|
|
|
|
|
|
|
|
|
Brief News | 2023 |
|
|
Productivity and Costs | Inflation |
|
Today's Week |
|
|
|
|
|
|
|
|
|
|
|
|
|
Nonfarm Productivity and Unit Labor Costs
(At 8:30)
| DATE/WEEK |
HIGHLIGHTS |
FOR |
PROD |
|
Weak US third-quarter unit labor costs point to slowing inflation. U.S. unit labor costs were much weaker than initially thought in the third quarter amid robust worker productivity, providing a boost to the Federal Reserve's fight against inflation. The inflation outlook was further brightened by other data on Wednesday showing a moderation in wage growth in November. The reports followed news on Tuesday that job openings dropped to a more than 2-1/2-year low in October. |
No 8 |
5.2% |
|
Q3(r)2023 |
|
| |
|
|
|
US Productivity Rises, Unit Labor Costs Decrease. Productivity, or nonfarm business employee output per hour, rose at a 4.7% annualized rate in the third quarter after climbing 3.6% in the prior period.US labor productivity advanced by the most in three years, helping to alleviate the inflationary impact of recent wage growth. Productivity, or nonfarm business employee output per hour, rose at a 4.7% annualized rate in the third quarter after climbing 3.6% in the prior period, data from the Bureau of Labor Statistics showed Thursday. |
No 7 |
4.7% |
|
Q3(p)2023 |
|
| |
|
|
|
The US Bureau of Labor Statistics reported that Unit Labor Cost (ULC) rose 2.2% during the second quarter, a revision from the previous estimate of 1.6%. ULC rose 3.3% during the first quarter (revised from 4.2%). Nonfarm Productivity increased 3.5%, below the 3.8% of market consensus, and revised from the 3.7% of the preliminary estimate. |
No 6 |
3.5% |
|
Q2(r)2023 |
|
| |
|
|
|
US productivity surges in second quarter; labor costs growth slows. U.S. worker productivity rebounded sharply in the second quarter, helping to curb growth in labor costs and offering another boost to the improving inflation outlook. Nonfarm productivity, which measures hourly output per worker, increased at a 3.7% annualized rate last quarter, the Labor Department said on Thursday. Data for the first quarter was revised higher to show productivity declining at a 1.2% pace instead of the previously reported 2.1% rate. |
No 5 |
3.7% |
|
Q2(p)2023 |
|
| |
|
|
|
US: Unit Labor Costs rise by 4.2% in Q1 vs. 6% expected. Nonfarm business sector labor productivity decreased 2.1% in the first quarter of 2023. Labor productivity was revised up 0.6%, the combined effect of a 0.3-percentage point upward revision to output and a 0.4-percentage point downward revision to hours worked. Usually, the ULC report has a muted reaction but the sharp revision shows less inflationary pressures than initially reported. |
No 4 |
-2.1% |
|
Q1(r)2023 |
|
| |
|
|
|
Productivity and Costs in Q1 p 2023. Productivity growth underperforms (-2.7% vs. -1.8% Bloomberg consensus, q/q AR), while unit labor costs surprises on the upside (+6.3% vs. +5.5% consensus, 3.3% previous). Hours rose as output fell. Seemingly pretty bad news, but I think it’s useful to put these recent growth rates in context by looking at the levels. |
No 3 |
-2.7% |
|
Q1(p)2023 |
|
| |
|
|
|
US fourth-quarter labor costs revised higher; productivity growth lowered. U.S. labor costs grew faster than initially thought in the fourth quarter, though the pace has slowed from the prior quarters. Unit labor costs – the price of labor per single unit of output – accelerated at a 3.2% annualized rate last quarter, the Labor Department said on Thursday. That was revised up from the 1.1% pace reported last month. With labor costs revised higher, growth in nonfarm productivity, which measures hourly output per worker, was downgraded to a 1.7% rate from the previously reported 3.0% pace in the fourth quarter. Economists forecast productivity growth being lowered to a 2.6% rate. |
No 2 |
1.7% |
|
Q4(r)2022 |
|
| |
|
|
|
U.S. worker productivity increased faster than expected in the fourth quarter, resulting in a moderation in labor costs growth. Nonfarm productivity, which measures hourly output per worker, rose at a 3.0% annualized rate last quarter, the Labor Department said on Thursday. Data for the third quarter was revised higher to show productivity growing at a 1.4% rate instead of the previously reported 0.8% pace. Economists polled by Reuters had forecast productivity rising at a 2.4% rate. Productivity fell at a 1.5% rate from a year ago and dropped 1.3% in 2022. Large shifts in the composition of the workforce in the wake of the COVID-19 pandemic have made it harder to get a clear read of productivity. Unit labor costs - the price of labor per single unit of output - increased at a 1.1% rate after rising at a 2.0% pace in the third quarter. Unit labor costs rose at a 4.5% rate from a year ago. They surged 5.7% in 2022, too fast to be consistent with the Federal Reserve's 2% inflation target. |
No 1 |
3.0% |
|
Q4(p)2022 |
|
| |
|
|
|
|
|
|
|
|
| |
|
|
|
|
|
| |
|
|
|
|
|
|
|
|
|
|
|
|
|
|
|
Brief News | 2022 |
|
|
Productivity and Costs | Inflation |
|
Today's Week |
|
|
|
|
|
|
|
|
|
|
|
|
|
Nonfarm Productivity and Unit Labor Costs
(At 8:30)
| DATE/WEEK |
HIGHLIGHTS |
FOR |
PROD |
|
Nonfarm business sector labor productivity increased 0.8 percent in the third quarter of 2022 rather than the preliminary estimate of 0.3 percent, the U.S. Bureau of Labor Statistics reported today, as output increased 3.3 percent and hours worked increased 2.5 percent. (All quarterly percent changes in this release are seasonally adjusted annual rates.) From the same quarter a year ago, nonfarm business sector labor productivity decreased 1.3 percent, reflecting a 2.1-percent increase in output and a 3.4- percent increase in hours worked. Labor productivity, or output per hour, is calculated by dividing an index of real output by an index of hours worked by all persons, including employees, proprietors, and unpaid family workers. Unit labor costs in the nonfarm business sector increased 2.4 percent in the third quarter of 2022, reflecting a 3.2-percent increase in hourly compensation and a 0.8-percent increase in productivity. Unit labor costs increased 5.3 percent over the last four quarters. |
No 8 |
0.8% |
|
Q3(r)2022 |
|
| |
|
|
|
Labor productivity increases in third quarter. The U.S. Bureau of Labor Statistics said Thursday that labor productivity increased 0.3% in the third quarter of 2022. In its preliminary report on productivity and costs for the third quarter, the Bureau of Labor Statistics said output increased 2.8% and hours worked increased 2.4% year-over-year. Labor productivity is calculated by dividing an index on output by the hours worked for all employees and proprietors. |
No 7 |
0.3% |
|
Q3(p)2022 |
|
| |
|
|
|
Unit labor costs increased 9.3% over the past four quarters, the highest level since the first quarter of 1982. Separate data the BLS released Thursday showed that the productivity decline in the second quarter wasn’t as sharp as initially reported. The revised productivity level showed a drop of 4.1%, an upward revision of half a percentage point from the initial reading. Economists had been expecting a reading of minus-4.3%. Unit labor costs, or the amount of compensation compared to output, rose 10.2% for the quarter, 0.4 percentage point less than the estimate. However, the four-quarter increase of 9.3% is the highest level since the first quarter of 1982. |
No 6 |
-4.1% |
|
Q2(r)2022 |
|
| |
|
|
|
U.S. Productivity Falls for Second Straight Quarter. Rapidly rising labor costs add to inflation pressures as the Federal Reserve attempts to slow price increases. U.S. labor productivity declined for the second consecutive quarter as overall economic output contracted and employers spent more on labor as they added workers. U.S. nonfarm labor productivity—a measure of goods and services produced in the U.S. per hour worked—fell at a seasonally adjusted annual rate of 4.6% in the second quarter from the prior quarter, the Labor Department said Tuesday. Economists surveyed by The Wall Street Journal had estimated a drop of 5%. |
No 5 |
-4.6% |
|
Q2(p)2022 |
|
| |
|
|
|
Also, first-quarter productivity was revised slightly higher but still reflected a decline of 7.3%, the biggest tumble since 1947. Unit labor costs jumped by 12.6%, the biggest increase since the third quarter of 1982, according to the Bureau of Labor Statistics. Nonfarm business sector labor productivity decreased 7.3 percent in the first quarter of 2022, the U.S. Bureau of Labor Statistics reported today, as output decreased 2.3 percent and hours worked increased 5.4 percent. This is the largest decline in quarterly productivity since the third quarter of 1947, when the measure decreased 11.7 percent. Unit labor costs in the nonfarm business sector increased 12.6 percent in the first quarter of 2022, reflecting a 4.4-percent increase in hourly compensation and a 7.3-percent decrease in productivity. Unit labor costs increased 8.2 percent over the last four quarters. |
No 4 |
-7.3% |
|
Q1(r)2022 |
|
| |
|
|
|
U.S. Productivity Drops Most Since 1947, Driving Up Labor Costs. Output per hour slumped an annualized 7.5% in first quarter. Unit labor costs post largest annual increase since 1982. U.S. productivity dropped in the first quarter by the most since 1947 as the economy shrank, while labor costs surged and illustrated an extremely tight job market. Productivity, or nonfarm business employee output per hour, decreased at a 7.5% annual rate from the previous three months, according to Labor Department figures Thursday. That compared to a 6.3% gain in the fourth quarter and the 5.3% projected decline in a Bloomberg survey of economists. |
No 3 |
-7.5% |
|
Q1(p)2022 |
|
| |
|
|
|
A separate report from the Bureau of Labor Statistics showed that nonfarm productivity rose 6.6% in the fourth quarter, slightly less than the estimate for 6.7%. However, unit labor costs rose 0.9%, well ahead of the expected 0.3%. Unit labor costs continued to increase in the last three months of 2021, though at a lower pace than the previous quarter due in large part to the jump in productivity. A 7.5% rise in hourly compensation was largely offset by the 6.6% productivity rise. For the full year, unit labor costs were up 3.6%, down from the 4.3% gain in 2020. |
No 2 |
6.6% |
|
Q4(r)2021 |
|
| |
|
|
|
Nonfarm productivity is expected to rise at a 2.7 percent annual rate in the fourth quarter versus a drop of 5.2 percent rate in the third quarter. It was 6.6%. Unit labor costs, which soared 9.6 percent in the third quarter, are expected to rise at a 1.5 percent rate in the fourth quarter It was 0.3%. Productivity measures the growth of labor efficiency in producing the economy's goods and services. Unit labor costs reflect the labor costs of producing each unit of output. Both are followed as indicators of future inflationary trends. |
No 1 |
6.6% |
|
Q4(p)2021 |
|
| |
|
|
|
|
|
|
|
|
| |
|
|
|
|
|
| |
|
|
|
|
|
|
|
|
|
|
|
|
|
|
|
Brief News | 2021 |
|
|
Productivity and Costs | Inflation |
|
Today's Week |
|
|
|
|
|
|
|
|
|
|
|
|
|
Nonfarm Productivity and Unit Labor Costs
| DATE/WEEK |
HIGHLIGHTS |
FOR |
PROD |
|
Nonfarm business productivity down 5.2 percent, unit labor costs up 9.6 percent, third quarter 2021. Nonfarm business sector labor productivity decreased at an annual rate of 5.2 percent in the third quarter of 2021. That was the largest decline in quarterly productivity since the second quarter of 1960, when productivity decreased 6.1 percent. In the third quarter of 2021, output increased 1.8 percent and hours worked increased 7.4 percent. Unit labor costs in the nonfarm business sector increased at an annual rate of 9.6 percent in the third quarter of 2021, reflecting a 3.9-percent increase in hourly compensation and a 5.2-percent decrease in productivity. |
No 8 |
-5.2% |
|
Q3(r)2021 |
|
| |
|
|
|
Thursday, U.S. productivity growth was worse than even the expected decline of 3.2%, falling 5% for the biggest quarterly drop since the second quarter of 1981, the Bureau of Labor Statistics reported. At the same time, unit labor costs soared 8.3%, which is a combination of the productivity decline plus a 2.9% increase in hourly compensation. That increase was more than the 7.4% Dow Jones estimate... |
No 7 |
-5.0% |
|
Q3(p)2021 |
|
| |
|
|
|
U.S. worker productivity grew a bit more slowly than initially thought in the second quarter, the Labor Department said on Thursday. Nonfarm productivity, which measures hourly output per worker, increased at a downwardly revised 2.1% annualized rate last quarter. It was previously reported to have advanced at a 2.3% pace. Economists polled by Reuters had expected productivity would be raised to a 2.4% rate. Productivity grew at a 4.3% rate in the January-March quarter. It surged early in the pandemic before slumping in the final three months of 2020. Economists attributed the jump to the hollowing out of lower-wage industries, like leisure and hospitality, which they said tended to be less productive. |
No 6 |
2.1% |
|
Q2(r)2021 |
|
| |
|
|
|
U.S. worker productivity growth slowed in the second quarter and labor costs were far weaker than previously estimated in the first quarter, the Labor Department said on Tuesday. Nonfarm productivity, which measures hourly output per worker, increased at a 2.3% annualized rate last quarter. Data for the first quarter was revised lower to show productivity rising at a 4.3% rate instead of the previously reported 5.4% pace. Economists polled by Reuters had expected productivity to rise at a 3.5% rate. Productivity jumped early in the pandemic before slumping in the final three months of 2020, and has since rebounded. |
No 5 |
2.3% |
|
Q2(p)2021 |
|
| |
|
|
|
U.S. productivity growth was unrevised at a 5.4% rate in the first three months of the year while labor costs rose at an even faster rate. The first-quarter gain in productivity was unchanged from the initial estimate a month ago, the Labor Department reported Thursday. The 5.4% gain at a seasonally adjusted annual rate followed a steep plunge at a 3.8% rate in the fourth quarter. Labor costs rose at a 1.7% rate in the first quarter, up from the initial estimate of a 1.6% increase. Productivity, the amount of output per hour of work, showed turned in weak gains over the record-long economic expansion that ended with the pandemic-triggered recession last year. Economists are hoping that some of the efficiencies businesses have implemented to cope with the pandemic may lead to stronger productivity gains in the coming years. |
No 4 |
5.4% |
|
Q1(r)2021 |
|
| |
|
|
|
U.S. worker productivity rebounded in the first quarter, depressing labor costs growth, but the data has been severely distorted by the COVID-19 pandemic to provide a clear trend. The Labor Department said on Thursday that nonfarm productivity, which measures hourly output per worker, increased at a 5.4% annualized rate last quarter. Data for the fourth quarter was revised higher to show productivity falling at a 3.8% rate instead of the previously reported 4.2% pace. Economists polled by Reuters had expected productivity would rebound at a 4.3% rate. Productivity shot up early in the pandemic before slumping in the final three months of 2020. Economists attributed the surge to the hollowing out of lower-wage industries, like leisure and hospitality, which they said tended to be less productive. Compared to the first quarter of 2020, productivity rose at a 4.1% pace. Hours worked increased at a 2.9% rate last quarter, slowing from a 10.0% growth pace in the October-December period. Unit labor costs - the price of labor per single unit of output - fell at a 0.3% rate. They grew at a 5.6% pace in the fourth quarter. Unit labor costs increased at a 1.6% rate from a year ago. They have also been distorted by the pandemic's disproportionate impact on lower-wage industries. |
No 3 |
5.4% |
|
Q1(p)2021 |
|
| |
|
|
|
Hourly compensation climbed 1.5 percent (vs 1.7 percent previously reported) and productivity fell 4.2 percent (vs -4.8 percent previously reported). Year-on-year, unit labor costs in the nonfarm business sector rose 4.2 percent. Nonfarm Productivity down -4.2% and the estimate was -4.7%. Unit labor costs at 6.0% and the estimate was 6.7%. |
No 2 |
-4.2% |
|
Q4(r)2020 |
|
| |
|
|
|
In the fourth quarter 2020, productivity slumped -4.8%. Productivity rates can be extremely volatile. Unit labor Costs increase 6.8% and the estimate was 3.1%. |
No 1 |
-4.8% |
|
Q4(p)2020 |
|
| |
|
|
|
|
|
|
|
|
| |
|
|
|
|
|
| |
|
Legends: |
|
Delayed |
|
Positive View |
|
Negative View |
|
Neutral View |
|
Non Available |
|
|
|
|
|
|
|
|
|
|
|
|
|
|
|
|
|
|
|
|
| |
|
|
|
|
|
|
|
|
|
|
|
|
|
|
|
|
|
|
|
|
|
Definitions | Explain |
|
|
Productivity and Costs | Inflation |
|
Today's Week |
|
|
|
|
|
|
|
|
|
|
|
|
| |
|
|
|
|
| |
|
| PRODUCTIVITY AND COSTS |
Productivity
Productivity measures the goods and services generated by an economy. In the long run, higher productivity usually results in higher profits for businesses and bigger paychecks for workers.
Lower productivity is bad for a country in the long run, a sign of poor or declining economic health. Yet in the short term, declining productivity can be a signal that companies need to hire more workers to keep up with rising demand while maintaining strong profit margins.
US worker productivity. Sustained productivity slowdown could limit inflation progress. Productivity, a measure of worker output. Nonfarm productivity, which measures hourly output per worker. Productivity measures the growth of labor efficiency in producing the economy's goods and services. Unit labor costs reflect the labor costs of producing each unit of output. Both are followed as indicators of future inflationary trends.
Productivity is determined by dividing the amount of goods and services businesses generate by how much time their employees work.
After the 2007-09 recession, productivity surged as companies fired workers and required their remaining employees to do more with less. Yet productivity has slowed over the past year and a half, suggesting the easy gains that often arise after a recession have mostly run their course. Productivity rose just 0.7% in 2011 after revised gains of 3.1% in 2010 and 2.9% in 2009.
Sometimes a slowdown in productivity is a prelude to an increase in hiring, especially as an economy gathers steam. Companies have to add workers to keep up with rising demand.
Revisions
Figures for productivity are revised twice after the initial report is released. The data are subject to large revisions, and economists caution that it can take several quarters to establish a trend.
Unit Labor Costs
Unit-labor costs reflect how much it costs a business to produce one unit of output, such as a ton of coal. Unit labor costs are calculated as a ration of hourly compensation to labor productivity and the Bureau of Labor Statistics noted that increases in hourly compensation tend to increase unit labor costs while increases in productivity tend to reduce them.
Unit labor costs - the price of labor per single unit of output. Unit labor costs, or what a business pays employees to produce one unit of output after taking into account changes in productivity.Weak US third-quarter unit labor costs point to slowing inflation. Unit labor costs reflect the labor costs of producing each unit of output. Both are followed as indicators of future inflationary trends.
Productivity Growth
Productivity growth is critical because it allows for higher wages and faster economic growth without inflationary consequences. In periods of robust economic growth, productivity ensures that inflation will remain well behaved despite tight labor markets. Productivity growth is also a key factor in helping to increase the overall wealth of an economy since real wage gains can be made when workers are more productive per hour.
Productivity and labor cost trends have varied over the decades. In the late 1990s, some economists asserted that dramatic productivity advances (based on new technologies) were then allowing the economy to sustain a much faster pace of growth than previously thought possible. Initially, some Fed officials expressed skepticism but later decided that productivity gains had helped boost economic growth and potential GDP growth during the 1990s. That is, the economy could grow faster than previously believed without igniting inflation.
Determining the source of productivity gains has become trickier over the last decade as new technology continues to be incorporated into production - not just in the U.S. but overseas also. Similarly, retraining U.S. workers has been sporadic. Not just low skill jobs are outsourced but now many highly skilled jobs such as programming and accounting are as well. Nonetheless, highly skilled professional jobs have been increasingly difficult to fill during times of high demand. Despite the cross currents in labor market trends, long-term productivity gains are important for maintaining growth in labor income and keeping inflation low.
But in the short-term, output and hours worked can shift sharply just due to cyclical swings in the economy. During the onset of recession, output typically falls before hours worked. This can result in a temporary drop in productivity and a spike in unit labor costs. So, while long-term productivity determines the "speed limit" for long-term growth, one should not be misled by short-term cyclical gyrations in productivity numbers as reflecting the true, underlying trend.
Calculation
Labor productivity, or output per hour, is calculated by dividing an index of real output by an index of hours worked of all persons, including employees, proprietors, and unpaid family workers.
BLS defines unit labor costs as the ratio of hourly compensation to labor productivity; increases in hourly compensation tend to increase unit labor costs and increases in output per hour tend to reduce them.
|
|
|
| |
|
|
|
|
|
|
|
|
|
|
|
|
|
|
|
|
|
|
|
|
|
Data | Source |
|
|
Productivity and Costs | Inflation |
|
Today's Week |
|
|
|
|
|
|
|
|
|
|
|
|
| |
|
|
|
|
|
|
| DATA INFORMATION |
PRODUCTIVITY AND COSTS |
| SOURCE |
The Conference Board |
| WEB |
http://www.conference-board.org |
| FREQUENCY |
Monthly |
| AVAILABILITY |
Third week of the month. |
| COVERAGE |
Data are for the previous month. Data for June are released in July. |
| REVISIONS |
Yes |
| IMPORTANCE |
Business Activity - Low Importance |
|
| |
|
|
|
|
|
|
|
|
|
|
|
|