|
 |
|
 |
Import and Export Prices | Inflation |
|
 |
|
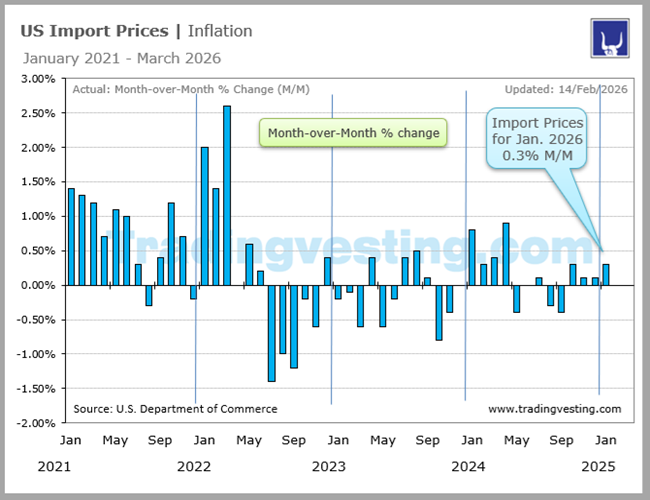
Import price indexes are compiled for the prices of goods that are bought in the United States but produced abroad and export price indexes are compiled for the prices of goods sold abroad but produced domestically. . Read More...
|
|
|
|
|
|
|
| |
|
| |
 4. Import and Exports Prices (4 of 5) 4. Import and Exports Prices (4 of 5) 4. Import and Exports Prices (4 of 5) 4. Import and Exports Prices (4 of 5) 5. Employment Cost Index ECI (5 of 5) 5. Employment Cost Index ECI (5 of 5) 1. Consumer Price Index CPI (1 of 5) 1. Consumer Price Index CPI (1 of 5) 2. Core PCE (2 of 5) 2. Core PCE (2 of 5) 3. Producer Price Index PPI (3 of 5) 3. Producer Price Index PPI (3 of 5)
|
 |
|
|
|
|
| |
|
→ Big Chart |
|
→ Release |
|
| |
|
|
|
|
|
|
|
|
|
|
|
|
|
|
|
|
|
|
|
 |
|
Big Chart | Large Data |
 |
|
Import and Export Prices | Inflation |
|
Today's Week |
 |
|
|
|
|
|
|
|
|
|
|
|
|
|
| |
|
|
|
|
|
|
|
|
|
|
|
|
|
|
|
|
|
|
|
|
|
Slides | Five 5 |
|
|
Import and Export Prices | Inflation |
|
Today's Week |
|
|
|
|
|
|
|
|
|
|
|
|
|
|
| |
|
|
|
|
|
|
|
|
|
|
|
|
|
|
|
|
|
|
|
|
|
Release Schedule | 2026 |
|
|
Import and Export Prices | Inflation |
|
Today's Week |
|
|
|
|
|
|
|
|
|
|
|
|
|
Import and Export Prices (At 8:30 a.m ET)
| IMPORTS 2026 |
No 1 |
No 2 |
No 3 |
No 4 |
No 5 |
No 6 |
No 7 |
No 8 |
No 9 |
No 10 |
No 11 |
No 12 |
| Release | Week |
|
|
|
|
|
|
|
|
|
|
|
|
| Release | Date |
|
|
|
|
|
|
|
|
|
|
|
|
| Release | Day |
|
|
|
|
|
|
|
|
|
|
|
|
 |
|
|
|
|
|
|
|
|
|
|
|
|
| Prior |
... |
0.1% |
0.2% |
... |
... |
... |
... |
... |
... |
... |
... |
... |
| Prior Revised |
... |
0.2% |
0.5% |
... |
... |
... |
... |
... |
... |
... |
... |
... |
| Consensus |
0.1% |
0.1% |
... |
... |
... |
... |
... |
... |
... |
... |
... |
... |
| Consensus Low |
0.1% |
-0.1% |
... |
... |
... |
... |
... |
... |
... |
... |
... |
... |
| Consensus High |
0.2% |
0.2% |
... |
... |
... |
... |
... |
... |
... |
... |
... |
... |
| IMPORT M/M |
0.1% |
0.2% |
1.3% |
... |
... |
... |
... |
... |
... |
... |
... |
... |
|
|
|
|
|
|
|
|
|
|
|
|
|
| Prior YY |
0.1% |
0.0% |
-0.1% |
... |
... |
... |
... |
... |
... |
... |
... |
... |
| Prior Revised YY |
... |
... |
... |
... |
... |
... |
... |
... |
... |
... |
... |
... |
| Consensus Y/Y |
... |
... |
... |
... |
... |
... |
... |
... |
... |
... |
... |
... |
|
|
|
|
|
|
|
|
|
|
|
|
|
| IMPORT Y/Y |
0.0% |
-0.1% |
1.3% |
... |
... |
... |
... |
... |
... |
... |
... |
... |
| RATING |
|
|
|
|
|
|
|
|
|
|
|
|
| Month For |
Dec-25 |
Jan-26 |
Feb-26 |
Mar-26 |
Apr-26 |
May-26 |
Jun-26 |
Jul-26 |
Aug-26 |
Sep-26 |
Oct-26 |
Nov-26 |
|
| EXPORTS 2026 |
No 1 |
No 2 |
No 3 |
No 4 |
No 5 |
No 6 |
No 7 |
No 8 |
No 9 |
No 10 |
No 11 |
No 12 |
| Prior |
... |
0.3% |
0.6% |
... |
... |
... |
... |
... |
... |
... |
... |
... |
| Prior Revised |
... |
0.6% |
... |
... |
... |
... |
... |
... |
... |
... |
... |
... |
| CONSENSUS |
0.1% |
0.2% |
... |
... |
... |
... |
... |
... |
... |
... |
... |
... |
| Consensus Low |
0.0% |
0.0% |
... |
... |
... |
... |
... |
... |
... |
... |
... |
... |
| Consensus High |
0.1% |
0.4% |
... |
... |
... |
... |
... |
... |
... |
... |
... |
... |
| EXPORTS M/M |
0.3% |
0.6% |
1.5% |
... |
... |
... |
... |
... |
... |
... |
... |
... |
|
|
|
|
|
|
|
|
|
|
|
|
|
| Exp Prior Y/Y |
3.3% |
3.1% |
2.6% |
... |
... |
... |
... |
... |
... |
... |
... |
... |
| Exp Rev Y/Y |
... |
... |
... |
... |
... |
... |
... |
... |
... |
... |
... |
... |
| CONSENSUS Y/Y |
... |
... |
... |
... |
... |
... |
... |
... |
... |
... |
... |
... |
|
|
|
|
|
|
|
|
|
|
|
|
|
| EXPORTS Y/Y |
3.1% |
2.6% |
3.5% |
... |
... |
... |
... |
... |
... |
... |
... |
... |
| Month For |
Dec-25 |
Jan-26 |
Feb-26 |
Mar-26 |
Apr-26 |
May-26 |
Jun-26 |
Jul-26 |
Aug-26 |
Sep-26 |
Oct-26 |
Nov-26 |
|
|
|
|
|
|
|
|
|
|
|
|
|
|
|
| Note: We take IMPORT Prices into main consideration. On the other hand. If rises then is negative. |
|
| |
|
|
|
|
|
|
|
|
|
|
|
Release Schedule | 2025 |
|
|
Import and Export Prices | Inflation |
|
Today's Week |
|
|
|
|
|
|
|
|
|
|
|
|
|
Import and Export Prices (At 8:30 a.m ET)
| IMPORTS 2025 |
No 1 |
No 2 |
No 3 |
No 4 |
No 5 |
No 6 |
No 7 |
No 8 |
No 9 |
No 10 |
No 11 |
No 12 |
| Release | Week |
|
|
|
|
|
|
|
|
|
|
|
|
| Release | Date |
|
|
|
|
|
|
|
|
|
|
|
|
| Release | Day |
|
|
|
|
|
|
|
|
|
|
|
|
|
|
|
|
|
|
|
|
|
|
|
|
|
| Prior: |
0.1% |
0.1% |
0.3% |
0.4% |
-0.1% |
0.1% |
0.0% |
0.1% |
0.4% |
0.0% |
... |
... |
| Prior Revised: |
... |
0.2% |
0.4% |
0.2% |
-0.4% |
... |
-0.4% |
-0.1% |
... |
0.1% |
... |
... |
| Consensus: |
-0.1% |
0.4% |
-0.1% |
0.0% |
-0.3% |
-0.3% |
0.2% |
0.1% |
-0.2% |
-0.2% |
... |
... |
| Consensus Low: |
-0.3% |
0.3% |
-0.3% |
-0.2% |
-0.5% |
-0.4% |
-0.1% |
0.0% |
0.3% |
-0.3% |
... |
... |
| Consensus High: |
0.2% |
0.6% |
-0.1% |
1.9% |
0.3% |
0.2% |
0.5% |
0.3% |
0.2% |
0.3% |
... |
... |
| IMPORT M/M: |
0.1% |
0.3% |
0.4% |
-0.1% |
0.1% |
0.0% |
0.1% |
0.4% |
0.3% |
0.0% |
... |
0.4% |
|
|
|
|
|
|
|
|
|
|
|
|
|
| Prior YY |
1.3% |
2.2% |
1.9% |
2.0% |
0.9% |
0.1% |
0.2% |
-0.2% |
-0.2% |
-0.1% |
... |
... |
| Prior Revised YY: |
... |
... |
... |
1.6% |
... |
... |
... |
... |
... |
-0.1% |
... |
... |
| Consensus Y/Y: |
... |
... |
... |
... |
... |
... |
0.2% |
-0.2% |
0.0% |
0.0% |
... |
... |
|
|
|
|
|
|
|
|
|
|
|
|
|
| IMPORT Y/Y: |
2.2% |
1.9% |
2.0% |
0.9% |
0.1% |
0.2% |
-0.2% |
-0.2% |
0.0% |
0.3% |
... |
0.1% |
| RATING |
|
|
|
|
|
|
|
|
|
|
|
|
| Month For: |
Dec-24 |
Jan-25 |
Feb-25 |
Mar-25 |
Apr-25 |
May-25 |
Jun-25 |
Jul-25 |
Aug-25 |
Sep-25 |
Oct-25 |
Nov-25 |
|
| EXPORTS 2025 |
No 1 |
No 2 |
No 3 |
No 4 |
No 5 |
No 6 |
No 7 |
No 8 |
No 9 |
No 10 |
No 11 |
No 12 |
| Prior: |
0.0% |
0.3% |
1.3% |
0.1% |
0.0% |
0.1% |
-0.9% |
0.5% |
0.1% |
-0.2% |
... |
... |
| Prior Revised: |
... |
0.5% |
... |
0.5% |
0.1% |
... |
-0.6% |
... |
... |
0.1% |
... |
... |
| CONSENSUS |
0.1% |
0.3% |
-0.2% |
0.1% |
-0.3% |
-0.1% |
-0.1% |
0.1% |
-0.2% |
0.0% |
... |
... |
| Consensus Low: |
-0.4% |
0.1% |
-0.4% |
-0.1% |
-0.6% |
-0.4% |
-0.1% |
0.0% |
-0.3% |
-0.3% |
... |
... |
| Consensus High: |
0.5% |
0.4% |
0.4% |
1.1% |
0.2% |
0.2% |
0.2% |
0.6% |
0.2% |
0.2% |
... |
... |
| EXPORTS M/M: |
0.3% |
1.3% |
0.1% |
0.0% |
0.1% |
-0.9% |
0.5% |
0.1% |
0.3% |
0.0% |
... |
... |
|
|
|
|
|
|
|
|
|
|
|
|
|
| Exp Prior Y/Y: |
0.8% |
1.8% |
2.7% |
2.1% |
2.4% |
2.0% |
1.7% |
2.8% |
2.2% |
3.4% |
... |
... |
| Exp Rev Y/Y: |
... |
... |
... |
2.6% |
... |
... |
... |
... |
... |
3.2% |
... |
... |
| CONSENSUS Y/Y: |
... |
... |
... |
... |
... |
... |
... |
... |
... |
... |
... |
... |
|
|
|
|
|
|
|
|
|
|
|
|
|
| EXPORTS Y/Y: |
1.8% |
2.7% |
2.1% |
2.4% |
2.0% |
1.7% |
2.8% |
2.2% |
3.4% |
3.8% |
... |
... |
| Month For: |
Dec-24 |
Jan-25 |
Feb-25 |
Mar-25 |
Apr-25 |
May-25 |
Jun-25 |
Jul-25 |
Aug-25 |
Sep-25 |
Oct-25 |
Nov-25 |
|
|
| Note: We take IMPORT Prices into main consideration. On the other hand. If rises then is negative. |
|
| |
|
|
|
|
|
|
|
|
|
|
|
Release Schedule | 2024 |
|
|
Import and Export Prices | Inflation |
|
Today's Week |
|
|
|
|
|
|
|
|
|
|
|
|
|
Import and Export Prices (At 8:30)
| IMPORTS 2024 |
No 1 |
No 2 |
No 3 |
No 4 |
No 5 |
No 6 |
No 7 |
No 8 |
No 9 |
No 10 |
No 11 |
No 12 |
| Released Week: |
|
|
|
|
|
|
|
|
|
|
|
|
| Released Date: |
|
|
|
|
|
|
|
|
|
|
|
|
| Released Day: |
|
|
|
|
|
|
|
|
|
|
|
|
| Prior: |
-0.4% |
0.0% |
0.8% |
0.3% |
0.4% |
0.9% |
-0.4% |
0.0% |
0.1% |
-0.3% |
-0.4% |
0.3% |
| Prior Revised: |
-0.5% |
-0.7% |
... |
... |
0.6% |
... |
-0.2% |
... |
... |
-0.2% |
... |
0.1% |
| Consensus: |
-0.6% |
-0.1% |
0.2% |
0.3% |
0.2% |
0.0% |
-0.1% |
-0.1% |
-0.2% |
-0.3% |
-0.1% |
-0.3% |
| Consensus Low: |
-0.7% |
-0.2% |
0.1% |
0.1% |
0.0% |
-0.6% |
-0.3% |
-0.1% |
-0.3% |
-0.6% |
-0.2% |
-0.3% |
| Consensus High: |
-0.4% |
0.0% |
0.3% |
0.6% |
0.4% |
0.7% |
0.2% |
0.1% |
0.2% |
0.3% |
0.1% |
0.3% |
| IMPORT M/M: |
0.0% |
0.8% |
0.3% |
0.4% |
0.9% |
-0.4% |
0.0% |
0.1% |
-0.3% |
-0.4% |
0.3% |
0.1% |
|
|
|
|
|
|
|
|
|
|
|
|
|
| Prior YY |
-1.4% |
-1.6% |
-1.3% |
-0.8% |
0.4% |
1.1% |
1.1% |
1.6% |
1.6% |
0.8% |
-0.1% |
0.8% |
| Prior Revised YY: |
-1.5% |
-2.4% |
... |
-0.9% |
... |
1.1% |
1.4% |
1.5% |
... |
... |
... |
... |
| Consensus Y/Y: |
-2.0% |
... |
-0.7% |
... |
... |
1.5% |
1.2% |
... |
0.9% |
... |
... |
1.0% |
|
|
|
|
|
|
|
|
|
|
|
|
|
| IMPORT Y/Y: |
-1.6% |
-1.3% |
-0.8% |
0.4% |
1.1% |
1.1% |
1.5% |
1.6% |
0.8% |
-0.1% |
0.8% |
1.3% |
| RATING |
|
|
|
|
|
|
|
|
|
|
|
|
| Month For: |
Dec-23 |
Jan-24 |
Feb-24 |
Mar-24 |
Apr-24 |
May-24 |
Jun-24 |
Jul-24 |
Aug-24 |
Sep-24 |
Oct-24 |
Nov-24 |
|
| EXPORTS 2024 |
No 1 |
No 2 |
No 3 |
No 4 |
No 5 |
No 6 |
No 7 |
No 8 |
No 9 |
No 10 |
No 11 |
No 12 |
| Prior: |
-0.9% |
-0.9% |
0.8% |
0.8% |
0.3% |
0.5% |
-0.6% |
-0.5% |
0.7% |
-0.7% |
-0.7% |
0.8% |
| Prior Revised: |
... |
-0.7% |
0.9% |
0.7% |
0.1% |
0.6% |
-0.7% |
-0.3% |
0.5% |
-0.9% |
... |
1.0% |
| Consensus: |
-0.6% |
-0.2% |
0.1% |
0.3% |
0.2% |
0.0% |
-0.1% |
-0.1% |
-0.1% |
-0.4% |
-0.1% |
-0.1% |
| Consensus Low: |
-1.0% |
-0.5% |
0.1% |
0.1% |
0.2% |
-0.9% |
-0.3% |
-0.1% |
-0.2% |
-0.7% |
-0.2% |
-0.5% |
| Consensus High: |
-0.5% |
0.0% |
0.6% |
1.4% |
0.4% |
0.3% |
0.1% |
-0.1% |
0.5% |
-0.1% |
0.1% |
0.9% |
| EXPORTS M/M: |
-0.9% |
0.8% |
0.8% |
0.3% |
0.5% |
-0.6% |
-0.5% |
0.7% |
-0.7% |
-0.7% |
0.8% |
0.0% |
|
|
|
|
|
|
|
|
|
|
|
|
|
| Exp Prior Y/Y: |
-5.2% |
-3.2% |
-2.4% |
-1.8% |
-1.4% |
-1.0% |
0.6% |
0.7% |
1.4% |
-0.7% |
-2.1% |
-0.1% |
| Exp Rev Y/Y: |
... |
-2.9% |
-2.2% |
-2.0% |
-1.6% |
-0.9% |
0.5% |
1.0% |
... |
-0.9% |
... |
... |
| Consensus Y/Y: |
... |
... |
... |
... |
... |
... |
... |
... |
... |
... |
... |
... |
|
|
|
|
|
|
|
|
|
|
|
|
|
| EXPORTS Y/Y: |
-3.2% |
-2.4% |
-1.8% |
-1.4% |
-1.0% |
0.6% |
0.7% |
1.4% |
-0.7% |
-2.1% |
-0.1% |
0.8% |
| Month For: |
Dec-23 |
Jan-24 |
Feb-24 |
Mar-24 |
Apr-24 |
May-24 |
Jun-24 |
Jul-24 |
Aug-24 |
Sep-24 |
Oct-24 |
Nov-24 |
|
|
| |
|
| |
|
|
|
|
|
|
|
|
|
|
|
Release Schedule | 2023 |
|
|
Import and Export Prices | Inflation |
|
Today's Week |
|
|
|
|
|
|
|
|
|
|
|
|
|
Import/Export Price Indexes
| IMPORTS 2023 |
No 1 |
No 2 |
No 3 |
No 4 |
No 5 |
No 6 |
No 7 |
No 8 |
No 9 |
No 10 |
No 11 |
No 12 |
| Released Week: |
|
|
|
|
|
|
|
|
|
|
|
|
| Released Date: |
|
|
|
|
|
|
|
|
|
|
|
|
| Released Day: |
|
|
|
|
|
|
|
|
|
|
|
|
| Prior: |
-0.6% |
0.4% |
-0.2% |
-0.1% |
-0.6% |
0.4% |
-0.6% |
-0.2% |
0.4% |
0.5% |
0.1% |
-0.8% |
| Prior Revised: |
-0.7% |
-0.1% |
-0.4% |
-0.2% |
-0.8% |
0.3% |
-0.4% |
-0.1% |
0.1% |
0.6% |
0.4% |
-0.6% |
| Consensus: |
-0.9% |
-0.1% |
-0.2% |
-0.2% |
0.3% |
-0.5% |
-0.3% |
0.2% |
0.3% |
0.5% |
-0.3% |
-0.7% |
| Consensus Low: |
-1.2% |
-0.2% |
-0.5% |
-0.2% |
0.2% |
-0.6% |
-0.6% |
0.1% |
0.2% |
0.4% |
-0.5% |
-1.2% |
| Consensus High: |
-0.4% |
0.3% |
0.5% |
0.4% |
0.3% |
-0.5% |
0.2% |
0.4% |
0.5% |
0.6% |
0.1% |
1.0% |
| IMPORT M/M: |
0.4% |
-0.2% |
-0.1% |
-0.6% |
0.4% |
-0.6% |
-0.2% |
0.4% |
0.5% |
0.1% |
-0.8% |
-0.4% |
|
|
|
|
|
|
|
|
|
|
|
|
|
| Prior YY |
2.7% |
3.5% |
0.8% |
1.1% |
-4.6% |
-4.8% |
-5.9% |
-6.1% |
-4.4% |
-3.0% |
-1.7% |
-2.0% |
| Prior Revised YY: |
... |
-0.1% |
0.9% |
... |
-4.8% |
-4.9% |
-5.7% |
... |
-4.5% |
-2.9% |
-1.5% |
-1.8% |
| Consensus Y/Y: |
... |
... |
0.2% |
... |
... |
... |
-5.9% |
-4.6% |
... |
... |
-1.7% |
... |
|
|
|
|
|
|
|
|
|
|
|
|
|
| IMPORT Y/Y: |
3.5% |
0.8% |
-1.1% |
-4.6% |
-4.8% |
-5.9% |
-6.1% |
-4.4% |
-3.0% |
-1.7% |
-2.0% |
-1.4% |
| RATING |
|
|
|
|
|
|
|
|
|
|
|
|
| Month For: |
Dec 22 |
Jan-23 |
Feb-23 |
Mar-23 |
Apr-23 |
May-23 |
Jun-23 |
Jul-23 |
Aug-23 |
Sep-23 |
Oct-23 |
Nov-23 |
|
| EXPORTS 2023 |
No 1 |
No 2 |
No 3 |
No 4 |
No 5 |
No 6 |
No 7 |
No 8 |
No 9 |
No 10 |
No 11 |
No 12 |
| Prior: |
-0.3% |
-2.6% |
0.8% |
0.2% |
-0.3% |
0.2% |
-1.9% |
-0.9% |
0.7% |
1.3% |
0.7% |
-1.1% |
| Prior Revised: |
-0.4% |
-3.2% |
0.5% |
0.4% |
-0.6% |
-0.1% |
... |
-0.7% |
0.5% |
1.1% |
0.5% |
-0.9% |
| Consensus: |
-0.7% |
-0.2% |
-0.3% |
-0.2% |
0.2% |
-0.3% |
-0.3% |
0.1% |
0.4% |
0.6% |
-0.2% |
-1.0% |
| Consensus Low: |
-0.9% |
-1.2% |
-0.5% |
-0.4% |
0.1% |
-0.6% |
-1.2% |
-1.2% |
0.2% |
0.3% |
-0.6% |
-1.0% |
| Consensus High: |
-0.2% |
0.0% |
0.2% |
0.1% |
0.3% |
-0.2% |
0.1% |
0.2% |
0.8% |
1.0% |
0.5% |
-0.2% |
| EXPORTS M/M: |
-2.6% |
0.8% |
0.2% |
-0.3% |
0.2% |
-1.9% |
-0.9% |
0.7% |
1.3% |
0.7% |
-1.1% |
-0.9% |
|
|
|
|
|
|
|
|
|
|
|
|
|
| Exp Prior Y/Y: |
6.3% |
5.0% |
2.3% |
-0.8% |
-4.8% |
-5.9% |
-10.1% |
-12.0% |
-7.9% |
-5.5% |
-4.1% |
-4.9% |
| Exp Rev Y/Y: |
6.1% |
-1.2% |
2.2% |
... |
-5.2% |
-6.0% |
-10.5% |
-11.9% |
-8.0% |
-5.7% |
-4.3% |
-4.7% |
| Consensus Y/Y: |
... |
... |
... |
... |
... |
... |
... |
... |
... |
... |
... |
... |
|
|
|
|
|
|
|
|
|
|
|
|
|
| EXPORTS Y/Y: |
5.0% |
2.3% |
-0.8% |
-4.8% |
-5.9% |
-10.1% |
-12.0% |
-7.9% |
-5.5% |
-4.1% |
-4.9% |
-5.2% |
| Month For: |
Dec 22 |
Jan-23 |
Feb-23 |
Mar-23 |
Apr-23 |
May-23 |
Jun-23 |
Jul-23 |
Aug-23 |
Sep-23 |
Oct-23 |
Nov-23 |
|
|
| |
|
| |
|
|
|
|
|
|
|
|
|
|
|
Release Schedule | 2022 |
|
|
Import and Export Prices | Inflation |
|
Today's Week |
|
|
|
|
|
|
|
|
|
|
|
|
|
Import/Export Price Indexes
| IMPORTS 2022 |
No 1 |
No 2 |
No 3 |
No 4 |
No 5 |
No 6 |
No 7 |
No 8 |
No 9 |
No 10 |
No 11 |
No 12 |
| Released Week: |
|
|
|
|
|
|
|
|
|
|
|
|
| Released Date: |
|
|
|
|
|
|
|
|
|
|
|
|
| Released Day: |
|
|
|
|
|
|
|
|
|
|
|
|
| Prior: |
0.7% |
-0.2% |
2.0% |
1.4% |
2.6% |
0.0% |
0.6% |
0.2% |
-1.4% |
-1.0% |
-1.2% |
-0.2% |
| Prior Revised: |
... |
... |
... |
1.6% |
2.9% |
0.4% |
0.5% |
0.3% |
-1.5% |
... |
-1.1% |
-0.4% |
| Consensus: |
0.3% |
1.3% |
1.5% |
2.2% |
0.6% |
1.2% |
0.7% |
-0.9% |
-1.3% |
... |
-0.4% |
-0.5% |
| Consensus Low: |
0.1% |
0.5% |
0.4% |
0.7% |
0.3% |
0.4% |
0.4% |
-1.3% |
-1.3% |
... |
-0.5% |
-0.9% |
| Consensus High: |
0.7% |
1.5% |
2.1% |
3.2% |
1.9% |
1.5% |
0.7% |
0.3% |
-1.0% |
... |
-0.1% |
0.0% |
| IMPORT M/M: |
-0.2% |
2.0% |
1.4% |
2.6% |
0.0% |
0.6% |
0.2% |
-1.4% |
-1.0% |
-1.2% |
-0.2% |
-0.6% |
|
|
|
|
|
|
|
|
|
|
|
|
|
| Consensus Y/Y: |
10.9% |
10.2% |
11.3% |
11.2% |
12.9% |
... |
... |
9.4% |
7.8% |
... |
4.0% |
... |
|
|
|
|
|
|
|
|
|
|
|
|
|
| IMPORT Y/Y: |
10.4% |
10.8% |
10.9% |
12.5% |
12.0% |
11.7% |
10.7% |
8.8% |
7.8% |
4.2% |
4.2% |
2.7% |
| RATING |
|
|
|
|
|
|
|
|
|
|
|
|
|
| EXPORTS 2022 |
No 1 |
No 2 |
No 3 |
No 4 |
No 5 |
No 6 |
No 7 |
No 8 |
No 9 |
No 10 |
No 11 |
No 12 |
| Prior: |
1.0% |
-1.8% |
2.9% |
3.0% |
4.5% |
0.6% |
2.8% |
0.7% |
-3.3% |
-1.6% |
-0.8% |
-0.3% |
| Prior Revised: |
0.8% |
-1.6% |
2.8% |
... |
4.1% |
0.8% |
2.9% |
... |
-3.7% |
... |
-1.5% |
-0.4% |
| Consensus: |
0.2% |
0.7% |
1.3% |
2.2% |
1.0% |
1.3% |
1.0% |
0.1% |
-1.2% |
... |
-0.2% |
-0.6% |
| Consensus Low: |
0.2% |
0.4% |
0.6% |
1.5% |
0.6% |
0.6% |
0.7% |
-1.4% |
-1.3% |
... |
-1.0% |
-0.9% |
| Consensus High: |
0.9% |
1.4% |
2.0% |
3.1% |
1.5% |
1.5% |
2.0% |
0.5% |
-0.4% |
... |
-0.4% |
0.0% |
| EXPORTS M/M: |
-1.8% |
2.9% |
3.0% |
4.5% |
0.6% |
2.8% |
0.7% |
-3.3% |
-1.6% |
-0.8% |
-0.3% |
-0.6% |
|
|
|
|
|
|
|
|
|
|
|
|
|
| Consensus Y/Y: |
18.2% |
14.6% |
15.0% |
13.1% |
19.2% |
... |
... |
18.1% |
... |
... |
... |
... |
|
|
|
|
|
|
|
|
|
|
|
|
|
| EXPORTS Y/Y: |
14.7% |
15.1% |
16.6% |
18.8% |
18.0% |
18.9% |
18.2% |
13.1% |
10.8% |
9.5% |
6.9% |
6.3% |
| Month For: |
Dec 21 |
Jan-22 |
Feb-22 |
Mar-22 |
Apr-22 |
May-22 |
Jun-22 |
Jul-22 |
Aug-22 |
Sep-22 |
Oct-22 |
Nov-22 |
|
|
| |
|
| |
|
|
|
|
|
|
|
|
|
|
|
Release Schedule | 2021 |
|
|
Import and Export Prices | Inflation |
|
Today's Week |
|
|
|
|
|
|
|
|
|
|
|
|
|
Import/Export Price Indexes
| IMPORTS 2021 |
No 1 |
No 2 |
No 3 |
No 4 |
No 5 |
No 6 |
No 7 |
No 8 |
No 9 |
No 10 |
No 11 |
No 12 |
| Released Week: |
|
|
|
|
|
|
|
|
|
|
|
|
| Released Date: |
|
|
|
|
|
|
|
|
|
|
|
|
| Released Day: |
|
|
|
|
|
|
|
|
|
|
|
|
| Prior: |
-0.9% |
0.9% |
1.4% |
1.3% |
1.2% |
0.7% |
1.1% |
1.0% |
0.3% |
-0.3% |
0.4% |
1.2% |
| Prior Revised: |
-0.8% |
... |
... |
... |
1.4% |
... |
1.4% |
... |
... |
... |
... |
1.5 |
| Consensus: |
0.1% |
1.0% |
1.0% |
0.9% |
0.6% |
0.8% |
1.2% |
... |
... |
0.6% |
0.9% |
0.7% |
| Consensus Low: |
-0.5% |
0.5% |
0.6% |
0.4% |
0.2% |
... |
0.6% |
... |
... |
0.3% |
0.5% |
0.3% |
| Consensus High: |
0.3% |
1.1% |
1.2% |
1.4% |
0.7% |
... |
1.3% |
... |
... |
0.7% |
1.0% |
0.9% |
| IMPORT M/M: |
0.9% |
1.4% |
1.3% |
1.2% |
0.7% |
1.1% |
1.0% |
0.3% |
-0.3% |
0.4% |
1.2% |
0.7% |
|
|
|
|
|
|
|
|
|
|
|
|
|
| IMPORT Y/Y: |
-0.3% |
0.9% |
3.0% |
6.9% |
10.6% |
11.6% |
11.2% |
10.2% |
9.0% |
9.2% |
10.7% |
11.7% |
| RATING |
|
|
|
|
|
|
|
|
|
|
|
|
| Month For: |
Dec 20 |
Jan-21 |
Feb-21 |
Mar-21 |
Apr-21 |
May-21 |
Jun-21 |
Jul-21 |
Aug-21 |
Sep-21 |
Oct-21 |
Nov-21 |
|
|
|
|
|
|
|
|
|
|
|
|
|
| EXPORTS 2021 |
No 1 |
No 2 |
No 3 |
No 4 |
No 5 |
No 6 |
No 7 |
No 8 |
No 9 |
No 10 |
No 11 |
No 12 |
| Prior: |
-0.7% |
1.1% |
2.5% |
1.6% |
2.1% |
0.8% |
2.2% |
1.2% |
1.3% |
0.4% |
0.1% |
1.5% |
| Prior Revised: |
-0.7% |
... |
... |
... |
2.4% |
... |
... |
... |
... |
... |
0.4% |
1.4% |
| Consensus: |
-0.1% |
1.0% |
1.0% |
0.9% |
0.8% |
... |
1.3% |
... |
... |
0.5% |
0.7% |
0.7% |
| Consensus Low: |
-0.5% |
0.5% |
0.4% |
0.5% |
0.1% |
... |
0.6% |
... |
... |
0.5% |
0.4% |
0.3% |
| Consensus High: |
0.4% |
1.1% |
1.1% |
1.0% |
1.9% |
... |
2.3% |
... |
... |
0.6% |
1.0% |
0.9% |
| EXPORT M/M: |
1.1% |
2.5% |
1.6% |
2.1% |
0.8% |
2.2% |
1.2% |
1.3% |
0.4% |
0.1% |
1.5% |
1.0% |
| EXPORT Y/Y: |
0.2% |
2.3% |
5.2% |
9.1% |
14.4% |
17.4% |
16.8% |
17.2% |
16.8% |
16.3% |
18.0% |
18.2% |
|
|
| |
|
| |
|
Legends: |
 |
Delayed |
 |
Positive View |
 |
Negative View |
 |
Neutral View |
 |
Non Available |
|
|
|
|
|
|
|
|
|
|
|
|
|
|
|
|
|
|
|
|
| |
|
|
|
|
|
|
|
|
|
|
|
|
|
|
|
|
|
|
|
|
|
Brief News | 2026 |
|
|
Import and Export Prices | Inflation |
|
Today's Week |
|
|
|
|
|
|
|
|
|
|
|
|
|
Import and Export Price Index (8:30)
| DATE/WEEK |
HIGHLIGHTS |
FOR |
I/E |
|
Import and Export Prices |
No 12 |
... |
|
Nov-2026 |
|
| |
|
|
|
Import and Export Prices |
No 11 |
... |
|
Oct-2026 |
|
| |
|
|
|
Import and Export Prices |
No 10 |
... |
|
Sep-2026 |
|
| |
|
|
|
Import and Export Prices |
No 9 |
... |
|
Aug-2026 |
|
| |
|
|
|
Import and Export Prices |
No 8 |
... |
|
Jul-2026 |
|
| |
|
|
|
Import and Export Prices |
No 7 |
... |
|
Jun-2026 |
|
| |
|
|
|
Import and Export Prices |
No 6 |
... |
|
May-2026 |
|
| |
|
|
|
Import and Export Prices |
No 5 |
... |
|
Apr-2023 |
|
| |
|
|
|
Import and Export Prices |
No 4 |
... |
|
Mar-2023 |
|
| |
|
|
|
Import and Export Prices |
No 3 |
... |
|
Feb-2026 |
|
| |
|
|
|
Import and Export Prices |
No 2 |
... |
|
Jan-2026 |
|
| |
|
|
|
Dec 2025 at 01% Import Prices and 0.3% Export Prices.The BLS also reported that import prices rose 0.1% in December, against a forecast decrease of 0.1%, and were unchanged from a year ago. Export prices increased 0.3% and were up 3.1% annually. |
No 1 |
0.1% |
|
Dec-2025 |
|
| |
|
|
|
|
|
|
|
|
|
| |
|
|
|
|
|
| |
|
|
|
|
|
|
|
|
|
|
|
|
|
|
|
Brief News | 2025 |
|
|
Import and Export Prices | Inflation |
|
Today's Week |
|
|
|
|
|
|
|
|
|
|
|
|
|
Import and Export Price Index (8:30)
| DATE/WEEK |
HIGHLIGHTS |
FOR |
I/E |
|
U.S. import prices increased 0.4% over the two months ending November 2025, with a 0.1% year-over-year rise, driven by higher nonfuel industrial supplies, while fuel import prices dropped 6.6% over the same 12 months. Nonfuel import prices rose 0.7% annually, and 2-month import prices (Sep-Nov) showed a 0.4% increase. Import prices increased 0.1% for the year ended November 2025 and 0.4% over the 2-month period.Overall: Export prices increased 0.5% over the 2 months ended November 2025. U.S. export prices increased 3.3 percent over the 12-month period ended in November
|
No 12 |
... |
|
Nov-2025 |
|
| |
|
|
|
Data for many specific import/export price indexes for October 2025 are unavailable due to a survey lapse during a government shutdown, though some non-survey data shows nonfuel import prices continued to reflect higher costs in industrial supplies and capital goods over the broader 2025 period. |
No 12 |
... |
|
Oct-2025 |
|
| |
|
|
|
Sept 2025 was issued on dec 3 of 2025, week 49. U.S. import and export prices remained unchanged in September 2025. Import prices saw a 0.3% increase over the year, the first annual rise since March 2025, driven by higher nonfuel costs offsetting lower fuel prices. Export prices showed a 3.8% annual increase, the largest since late 2022. Overall Export Prices: Unchanged (0.0%) in September following a 0.1% increase in August. |
No 12 |
... |
|
Sep-2025 |
|
| |
|
|
|
Impoit and Export Prices Index for Oct. 2025: Delayed due to the government shut down, |
No 11 |
... |
|
Oct-2025 |
|
| |
|
|
|
Impoit and Export Prices Index for Sep. 2025: Delayed due to the government shut down, |
No 10 |
... |
|
Sep-2025 |
|
| |
|
|
|
U.S. import, export prices both unexpectedly rise in August. U.S. import prices rose 0.3% M/M in August, exceeding the 0.2% decrease expected and the 0.2% increase in July, which was revised down. US import prices rose by 0.3 per cent month on month (MoM) in August following a 0.2-per cent MoM increase in July and a decrease of 0.2 per cent in June, according to the Bureau of Labour Statistics (BLS). Higher prices for non-fuel imports more than offset lower prices for fuel imports in the month. Such prices were unchanged year on year (YoY) in the month. |
No 9 |
0.0% |
|
Aug-2025 |
|
| |
|
|
|
In July 2025, the U.S. import price index increased by 0.4%, driven by higher fuel and nonfuel import prices, while export prices rose by 0.1%. Over the previous 12 months, import prices fell by 0.2%, Year-over-Year: -0.2% decrease (July 2024 to July 2025), and export prices advanced by 2.2%. The U.S. international trade deficit in goods for July 2025 was -$103.9 billion, with goods exports at $179.4 billion and goods imports at $283.3 billion. |
No 8 |
-0.2% |
|
Jul-2025 |
|
| |
|
|
|
In June 2025, the US saw a 0.1% monthly advance in import prices, driven by higher nonfuel import prices, while export prices increased 0.5%, rebounding from a prior monthly decline. For goods, import prices rose 0.1% and export prices increased 0.5% in June. Over the past year, US import prices fell 0.2%, while export prices rose 2.8%. |
No 7 |
-0.2% |
|
Jun-2025 |
|
| |
|
|
|
In May 2025, U.S. import prices were unchanged from April, while export prices declined by 0.9%. This was largely driven by lower prices for fuel imports and a significant drop in export prices, despite a rise in nonfuel import prices and some nonfuel export categories. The overall U.S. trade deficit widened to $71.52 billion in May, reflecting a larger goods deficit and a smaller services surplus compared to April. Unchanged from the previous month, with higher nonfuel import prices offsetting lower fuel import prices. Specifically, nonfuel import prices increased by 0.3%, while fuel prices fell. Over the past 12 months, U.S. import prices rose by 0.2%. |
No 6 |
0.2% |
|
May-2025 |
|
| |
|
|
|
In April 2025, U.S. import prices increased by 0.1%, with nonfuel imports driving this gain despite a drop in fuel prices, while export prices rose by 2.0% year-over-year, largely influenced by higher air freight fares. The overall goods and services deficit decreased by $179.3 billion compared to the same period in 2024, reflecting both an increase in the services surplus and a decrease in the goods deficit. |
No 5 |
0.1% |
|
Apr-2023 |
|
| |
|
|
|
In March 2025, US import prices slipped 0.1% from the previous month, while US export prices remained unchanged. On a year-over-year basis, import prices rose 0.9% and export prices climbed 2.4% through March 2025. The 0.1% monthly decline in import prices was largely driven by a 2.3% drop in fuel prices. Nonfuel import prices, however, rose 0.1% for the second consecutive month, with gains in capital goods, nonfuel industrial supplies and materials, and foods outweighing declines in consumer goods and automotive vehicles. |
No 4 |
0.9% |
|
Mar-2023 |
|
| |
|
|
|
In February 2025, U.S. import prices increased by 0.4% and export prices increased by 0.1% compared to the previous month, with the 12-month change for import prices at 2.0% and export prices at 2.1%. The U.S. goods and services deficit decreased in February 2025 due to a decrease in the goods deficit and a decrease in the services surplus. |
No 3 |
2.0% |
|
Feb-2025 |
|
| |
|
|
|
In January 2025, US import prices increased by 1.9% and export prices rose by 2.7% compared to January 2024. This marked the largest 12-month increase in export prices since December 2022. The US goods and services deficit also widened by 96.5% year-over-year in January 2025, driven by an increase in the goods deficit. |
No 2 |
1.9% |
|
Jan-2025 |
|
| |
|
|
|
Import prices in the U.S. crept up in line with estimates in the month of December. The Labor Department said import prices inched up by 0.1 percent in December, matching the upticks seen in November and October as well as expectations. Meanwhile, the report said the annual rate of import price growth accelerated to 2.2 percent in December from 1.4 percent in November, reaching the fastest pace of growth since a 3.2 percent spike in December 2022. The modest monthly increase by import prices partly reflected a jump by prices for fuel imports, which shot up by 1.4 percent in December after climbing by 0.9 percent in November. U.S. import prices increase 0.1% in December; export prices advance 0.3%. Prices for U.S. imports increased 0.1 percent in December, after rising 0.1 percent in November. U.S. export prices advanced 0.3 percent in December following no change the previous month. Over the past year, import prices increased 2.2 percent and export prices rose 1.8 percent. |
No 1 |
2.2% |
|
Dec-2024 |
|
| |
|
|
|
|
|
|
|
|
|
| |
|
|
|
|
|
| |
|
|
|
|
|
|
|
|
|
|
|
|
|
|
|
Brief News | 2024 |
|
|
Import and Export Prices | Inflation |
|
Today's Week |
|
|
|
|
|
|
|
|
|
|
|
|
|
Import and Export Price Index (8:30)
| DATE/WEEK |
HIGHLIGHTS |
FOR |
I/E |
|
Import inflation is low now, but Trump tariffs pose fresh threat. The cost of imported goods aren’t adding much to inflation now, but rising prices could become a bigger threat next year if President-elect Donald Trump goes ahead with the stiffest U.S. tariffs in decades. The import price index rose a a scant 0.1% in November, the government said Friday. Inflation Risks Loom as U.S. Import Prices Edge Higher on Fuel Costs. Import prices rose 0.1% in November, defying forecasts of a 0.2% drop, with fuel costs driving the increase. Export prices held steady in November, with agricultural exports falling 0.4% on lower soybean and fruit prices. Annual U.S. import prices rose 1.3%, their strongest 12-month gain since mid-2024, despite fuel declines. Traders anticipated a -0.2% decline in monthly U.S. import prices for November 2024, but the actual increase of 0.1% exceeded expectations, driven by higher fuel costs. Meanwhile, export prices remained flat following a 1.0% rise in October. These trends highlight continued cost pressures in the international trade sector. The unexpected rise in import prices adds to inflationary pressures, complicating the Federal Reserve’s policy outlook. Higher import costs, particularly for energy, could sustain upward pressure on Treasury yields as the Fed remains vigilant against inflation. |
No 12 |
1.3% |
|
Nov-2024 |
|
| |
|
|
|
U.S. import prices increased 0.3 percent M/M in October following a 0.4-percent decline in September, the U.S. Bureau of Labor Statistics reported today. Higher nonfuel and fuel prices contributed to the October advance. The price index for U.S. exports rose 0.8 percent in October, after decreasing 0.6 percent the previous month. Prices for U.S. imports rose 0.3 percent in October, the largest 1-month advance since a 0.9-percent increase in April 2024. |
No 11 |
0.8% |
|
Oct-2024 |
|
| |
|
|
|
Import prices drop 0.4% in September; dip 0.1% year/year. Energy products account for much of the drop in prices. Export prices fall 0.7%; decrease 2.1% year-on-year. U.S. import prices fell by the most in nine months in September amid a sharp decrease in the cost of energy products, pointing to a benign inflation outlook that keeps the Federal Reserve on course to continue cutting interest rates.The report followed data last week showing slightly firmer consumer prices in September. While producer prices were unchanged last month, some components showed strength, which was expected to translate into a higher monthly readings in the key inflation measures tracked by the U.S. central bank for its 2% target. Import prices do not feed through directly to producer and consumer prices but are a signal inflationary pressures remain muted and adds some support to another rate cut in factory gates, import price gains will be modest. Import prices slipped 0.4% last month, the biggest drop since December 2023, after a revised 0.2% decrease in August, the Labor Department's Bureau of Labor Statistics said. Import prices were previously reported to have declined 0.3% in August. Import prices are not an obstacle in returning inflation back to the Fed's 2% target. The report also showed export prices fell 0.7% last month after sliding 0.9% in August.In the 12 months through September, export prices dropped 2.1%. That was the biggest decline since January and followed a 0.9% decrease in Augu. |
No 10 |
-0.4/-0.7 |
|
Sep-2024 |
|
| |
|
|
|
US import prices post largest drop in eight months. U.S. import prices dropped by the most in eight months in August amid lower costs for a broad range of goods, suggesting that domestic inflation will continue to subside in the months ahead. The report showing mild increases in producer and consumer prices in August, though some stickiness remained in underlying inflation. With price pressures ebbing, the Federal Reserve is now focused on the labor market, which has slowed considerably from last year's robust job growth. The inflation flare-up early in the year is no longer evident in the prices of imported goods coming into the country and this is another reason to believe that the balance of risks have shifted for Fed officials back to downside risks for the economy and labor market from the inflation risks earlier this year. Import prices fell 0.3% last month, the largest decline since December 2023, after an unrevised 0.1% gain in July, the Labor Department's Bureau of Labor Statistics said. Economists polled by Reuters had expected import prices, which exclude tariffs, would fall 0.2%. The report also showed export prices falling 0.7% last month after rising 0.5% in July. |
No 9 |
-0.3/-0.7 |
|
Aug-2024 |
|
| |
|
|
|
U.S. import prices barely rose in July, extending the flow of tame inflation readings that have bolstered financial market expectations for an interest rate cut next month. Import prices edged up 0.1% last month amid a modest rebound in the cost of energy products after being unchanged in June, the Labor Department's Bureau of Labor Statistics said on Thursday. Economists polled by Reuters had expected import prices, which exclude tariffs, to slip 0.1%. In the 12 months through July, import prices increased 1.6% after rising 1.5% in June. The report followed news this week of mild increases in consumer and producer prices in July, which strengthened expectations for a September 25 basis point interest rate cut from the Federal Reserve. |
No 8 |
0.1/0.7 |
|
Jul-2024 |
|
| |
|
|
|
U.S. import prices were unchanged in June as lower prices for energy products offset a rebound in the cost of food, the Bureau of Labor Statistics said on Tuesday. The flat reading in import prices followed a 0.2% drop in May. Economists polled by Reuters had expected import prices, which exclude tariffs, to dip 0.1%. In the 12 months through June, import prices increased 1.6%. That followed a 1.4% advance in May. Moderate import prices supported views that inflation was on a downward path and could provide the Federal Reserve room to cut interest rates in September. Excluding fuels and food, import prices were unchanged. These so-called core import prices dipped 0.1% in May. The report also showed that export prices fell 0.5% in June after declining 0.7% in May. In the 12 months through June, export prices rose 0.7% after gaining 0.5% in June. |
No 7 |
0.0/-0.5 |
|
Jun-2024 |
|
| |
|
|
|
U.S. import prices fell for the first time in five months in May amid lower prices for energy products, providing another boost to the domestic inflation outlook. The unexpectedly benign report from the Labor Department on Friday combined with data this week showing tame inflation readings last month to keep a September interest rate cut from the Federal Reserve on the table. Import prices dropped 0.4% last month after an unrevised 0.9% surge in April, the Labor Department's Bureau of Labor Statistics said. That was the first decline in import prices since December. Economists polled by Reuters had expected import prices, which exclude tariffs, to edge up 0.1%. |
No 6 |
3.3% |
|
May-2024 |
|
| |
|
|
|
The dollar rose on Thursday after data showed U.S. import prices increased 0.9% last month, a jump that raised concerns the Federal Reserve's fight to tame inflation is not yet done and could delay plans for policymakers to cut interest rates. The jump in the price index for U.S. imports in April was the largest one-month increase since it rose 2.9% in March 2022, the Bureau of Labor Statistics said. Prices for U.S. imports last declined on a monthly basis in December, the BLS said. The dollar index , which tracks the U.S. currency against six peers, rose 0.27% to 104.47 after a 0.75% slide on Wednesday. |
No 5 |
3.4% |
|
Apr-2023 |
|
| |
|
|
|
U.S. import prices rose by the most in two years in April amid rising costs for energy products and other goods, suggesting that domestic inflation could remain elevated for a while. Import prices surged 0.9% last month, the largest increase since March 2022, after an upwardly revised 0.6% rise in March, the Labor Department's Bureau of Labor Statistics said on Thursday. Economists polled by Reuters had expected import prices, which exclude tariffs, to advance 0.3% following a previously reported 0.4% gain in March. The dollar rose on Thursday after data showed U.S. import prices increased 0.9% last month, a jump that raised concerns the Federal Reserve's fight to tame inflation is not yet done and could delay plans for policymakers to cut interest rates. The jump in the price index for U.S. imports in April was the largest one-month increase since it rose 2.9% in March 2022, the Bureau of Labor Statistics said. Prices for U.S. imports last declined on a monthly basis in December, the BLS said. The dollar index , which tracks the U.S. currency against six peers, rose 0.27% to 104.47 after a 0.75% slide on Wednesday. |
No 4 |
3.5% |
|
Mar-2023 |
|
| |
|
|
|
Import prices increase 0.3% in February. News on the inflation front was mixed. Import prices rose moderately in February after surging in January, but the overall disinflationary trend is slowing. Declining goods prices accounted for much of the cooling in inflation last year. Import prices were up 0.3% last month after a 0.8% jump in January, the Labor Department's Bureau of Labor Statistics reported. The increase in import prices, which exclude tariffs, was in line with economists' expectations. In the 12 months through February, import prices dropped 0.8% after declining 1.3% in January. Though annual import prices decreased for the 13th straight month, the pace has slowed since prices slumped 2.4% in December. Government data this week showed both consumer and producer prices increased strongly for a second consecutive month in February. Data on Friday showed U.S. import prices increased marginally in February as a surge in the cost of petroleum products was partially offset by modest gains elsewhere, suggesting an improving inflation picture.. In March the year-over-year change in the import price index was 0.4%. The change in the export price index was -1.4%. |
No 3 |
3.2% |
|
Feb-2024 |
|
| |
|
|
|
US import prices post largest gain in nearly two years in January 2024. U.S. import prices increased by the most in nearly two years in January amid rising costs for petroleum and other goods, a trend that if sustained, would be bad news in the fight against inflation. Import prices jumped 0.8% last month, the largest gain since March 2022, after a revised 0.7% decline in December, the Labor Department's Bureau of Labor Statistics said on Thursday. Import prices were previously reported to have been unchanged in December. Economists polled by Reuters had forecast import prices, which exclude tariffs, would be unchanged in January. Imported fuel prices rebounded 1.2% in January. That followed a 7.7% plunge in December. The cost of imported food surged 1.5% after dipping 0.1% in the prior month. The report also showed export prices rebounded 0.8% after declining 0.7% in December. Export prices fell 2.4% on a year-on-year basis in January after decreasing 2.9% in December. |
No 2 |
3.1% |
|
Jan-2024 |
|
| |
|
|
|
U.S. import prices were unexpectedly unchanged in December after two straight monthly decreases, but the trend in imported inflation remained subdued. The unchanged reading in import prices last month followed a revised 0.5% decline in November, the Labor Department's Bureau of Labor Statistics said on Wednesday. Import prices were previously reported to have fallen 0.4% in November. Economists polled by Reuters had forecast import prices, which exclude tariffs, would drop 0.5% in December. The report also showed export prices fell 0.9% for the third month in a row in December. Export prices for agricultural commodities dropped 0.6% amid lower prices for soybeans and other oilseeds, corn, meat and nuts, which more than offset higher fruit prices. |
No 1 |
3.4% |
|
Dec-2023 |
|
| |
|
|
|
|
|
|
|
|
|
| |
|
|
|
|
|
| |
|
|
|
|
|
|
|
|
|
|
|
|
|
|
|
Brief News | 2023 |
|
|
Import and Export Prices | Inflation |
|
Today's Week |
|
|
|
|
|
|
|
|
|
|
|
|
|
Import and Export Price Index
| DATE/WEEK |
HIGHLIGHTS |
FOR |
Y/Y |
|
U.S. import prices fell for a second straight month in November amid decreases in the costs of energy products and motor vehicles, suggesting that import deflation could help to lower domestic inflation next year. Import prices dropped 0.4% last month, the Labor Department's Bureau of Labor Statistics said on Thursday. Data for October was revised to show prices declining 0.6% instead of 0.8% as previously reported. Economists polled by Reuters had forecast import prices, which exclude tariffs, falling 0.8%. The report also showed export prices declined 0.9% in November, matching October's drop. Export prices for agricultural commodities rose 0.2%, lifted by fruit and soybeans. But prices for corn, meat and other foods and food preparations fell. |
No 12 |
3.1% |
|
Nov-2023 |
|
| |
|
|
|
U.S. import prices fell more than expected in October amid a broad decline in the costs of goods, the latest indication that inflation was retreating. Import prices dropped 0.8% last month, the biggest drop since March, the Labor Department's Bureau of Labor Statistics said on Thursday. Data for September was revised higher to show prices increasing 0.4% instead of edging up 0.1% as previously reported. Economists polled by Reuters had forecast import prices, which exclude tariffs, falling 0.3%. The report also showed export prices fell 1.1% in October as prices for both agricultural and nonagricultural exports dropped. Export prices increased 0.5% in September. They tumbled 4.9% year-on-year in October after declining 4.3% in September. |
No 11 |
3.2% |
|
Oct-2023 |
|
| |
|
|
|
Import prices increase 0.1% in September. Core import prices fall 0.1%. U.S. consumer sentiment deteriorated in October, with households expecting higher inflation over the next year, but labor market strength was likely to continue supporting consumer spending. Import prices edged up 0.1% last month after climbing 0.6% in August. Economists had forecast import prices, which exclude tariffs, would gain 0.5%. "The stronger U.S. dollar on the back of higher bond yields may be in danger of pricing American exports out of world markets, but it is doing one good thing, which is tamping down the prices of imported goods coming into the country and aiding the Fed's inflation fight," said Christopher Rupkey, chief economist at FWDBONDS in New York. In the 12 months through September, import prices dropped 1.7% after falling 2.9% in August. Annual import prices have now declined for eight straight months. |
No 10 |
3.7% |
|
Sep-2023 |
|
| |
|
|
|
Manufacturing production rises 0.1% in August. Import prices increase 0.5%; down 3.0% year-on-year. Export prices jump 1.3%; decline 5.5% year-on-year. U.S. manufacturing output barely rose in August amid a decline in motor vehicle production, and activity could contract in the months ahead after the United Auto Workers (UAW) union embarked on strikes at three factories on Friday. The strikes, which for now only involve 12,700 of the affected 146,000 UAW members, were launched at a time when manufacturing is already struggling under the weight of the Federal Reserve's hefty interest rate increases, which have reduced demand for goods, typically bought on credit. |
No 9 |
3.7% |
|
Aug-2023 |
|
| |
|
|
|
U.S. import prices rebounded more than expected in July amid higher costs for petroleum products and food, but underlying imported inflation pressures remained muted. Import prices increased 0.4% last month, the Labor Department said on Tuesday. Data for June was revised to show prices falling 0.1% instead of the previously reported 0.2%. Economists polled by Reuters had forecast import prices, which exclude tariffs, rising 0.2%. The report also showed export prices increased 0.7% in July, reversing the prior month's 0.7% decline. Prices for agricultural exports rebounded 0.9% after decreasing in June and May. Higher prices for soybeans, meat and wheat in July more |
No 8 |
3.2% |
|
Jul-2023 |
|
| |
|
|
|
Import prices fall 0.2% in June; down 6.1% year-on-year. Export prices drop 0.9%; decline 12.0% year-on-year. Consumer sentiment index jumps 12.7% to 72.6 in July. U.S. import prices fell for a second straight month in June as an increase in the cost of fuels was more than offset by declines elsewhere, the latest indication that inflationary pressures in the economy are abating. With the inflation environment improving considerably, Americans are growing more optimistic about the economic outlook. Consumer sentiment vaulted to the highest level in nearly two years in July, other data showed on Friday. Annual change in U.S. import and export prices. In June the year-over-year change in the import price index was -6.1%. The change in the export price index was -12.0%. |
No 7 |
3.0% |
|
Jun-2023 |
|
| |
ver |
|
|
U.S. import prices fell in May and the annual decrease in prices was the sharpest in three years, providing another boost for the Federal Reserve in the fight against inflation. Import prices dropped 0.6% last month as the costs of energy products and food declined after increasing 0.3% in April, the Labor Department said on Thursday. Economists polled by Reuters had forecast import prices, which exclude tariffs, dropping 0.5%. In the 12 months through May, import prices plunged 5.9%. That was the biggest year-on-year decline since May 2020 and followed a 4.9% fall in April. Annual import prices have now decreased for four straight months. The report also showed export prices declined 1.9% in May after slipping 0.1% in April. Prices for agricultural exports dropped 2.1% weighed down by corn, soybeans and wheat. |
No 6 |
4.0% |
|
May-2023 |
|
| |
|
|
|
U.S. import prices increased in April for the first time since late 2022 amid higher fuel costs, but imported inflation pressures remained subdued. Import prices rose 0.4% last month after dropping 0.8% in March, the Labor Department said on Friday. Last month's increase was the first since December 2022, Reuters reported. Economists polled by Reuters had forecast import prices, which exclude tariffs, would increase 0.3%. Import prices in the 12 months through April fell 4.8%, matching the decline in March. Import prices have now dropped for three straight months on a year-on-year basis. The government reported this week that the annual increases in consumer and producer prices in April were the smallest in more than two years, bolstering expectations the Federal Reserve would pause its interest rate increases at a meeting next month. |
No 5 |
4.9% |
|
Apr-2023 |
|
| |
|
|
|
U.S. import prices fell more than expected in March, leading to the biggest year-on-year decline since mid-2020, further evidence that inflation pressures were subsiding. Import prices dropped 0.6% last month after slipping 0.2% in February, the Labor Department said on Friday. Economists polled by Reuters had forecast import prices, which exclude tariffs, falling 0.1%. In the 12 months through March, import prices decreased 4.6%. That was the largest year-on-year drop since May 2020 and followed a 1.1% decline in February. It offered more hope in the Federal Reserve's fight against inflation. The government reported this week that consumer prices barely rose in March, while producer prices fell by the most in nearly three years. The report also showed export prices fell 0.3% in March after rising 0.4% in February. Prices for agricultural exports decreased 1.5% as lower prices for corn, soybeans, wheat and fruit offset higher meat prices. |
No 4 |
5.0% |
|
Mar-2023 |
|
| |
|
|
|
US import prices fall in February, post first annual drop since 2020. U.S. import prices fell in February as a decline in the cost of fuels offset increases in food, capital and consumer goods, resulting in the first annual decline since 2020. Import prices slipped 0.1% last month after decreasing 0.4% in January, the Labor Department said on Thursday. Economists polled by Reuters had forecast import prices, which exclude tariffs, falling 0.2%. In the 12 months through February, import prices dropped 1.1%. That was the first decline since December 2020. Imported fuel prices fell 4.9%, matching January's drop. Petroleum prices rose 1.5%, while natural gas prices plunged 55.6%. |
No 3 |
6.0% |
|
Feb-2023 |
|
| |
|
|
|
U.S. import prices dropped for a seventh straight month in January amid declining costs for energy products, leading to the smallest annual increase in imported inflation in two years. The report from the Labor Department on Friday, however, did little to assuage financial market fears the Federal Reserve could maintain its interest hiking campaign through the summer after data this week showed a jump in monthly consumer and producer prices in January, suggesting a slow disinflation journey. Import prices fell 0.2% last month after slipping 0.1% in December. The drop in import prices, which exclude tariffs, was in line with economists' expectations. |
No 2 |
6.4% |
|
Jan-2023 |
|
| |
|
|
|
Import prices rise 0.4% in December; core prices up 0.4%. U.S. consumers are becoming more confident that price pressures will ease considerably over the next 12 months, with a survey on Friday showing their one-year inflation expectations falling in January to the lowest level since the spring of 2021. But the road to low inflation will be bumpy as other data on Friday showed import prices unexpectedly increasing in December after five straight monthly decreases, boosted by higher costs for natural gas and food. Overall inflation is retreating as the Federal Reserve's aggressive interest rate increases cool demand, and bottlenecks in the supply chain ease. Despite the encouraging signs, the battle against inflation if far from being won. In a separate report on Friday, the Labor Department said import prices rebounded 0.4% last month after declining 0.7% in November. Economists had forecast import prices, which exclude tariffs, falling 0.9%. In the 12 months through December, import prices increased 3.5% after rising 2.7% in November. |
No 1 |
6.5% |
|
Dec-2022 |
|
| |
|
|
|
|
|
|
|
|
|
| |
|
|
|
|
|
| |
|
|
|
|
|
|
|
|
|
|
|
|
|
|
|
Brief News | 2022 |
|
|
Import and Export Prices | Inflation |
|
Today's Week |
|
|
|
|
|
|
|
|
|
|
|
|
|
Import and Export Prices
| DATE/WEEK |
HIGHLIGHTS |
IMPORT |
EXPORT |
|
Import prices fall 0.6% in November; up 2.7% year-on-year. Core import prices drop 0.6%; rise 1.7% from year ago. Export prices slip 0.3%; increase 6.3% year-on-year. U.S. import prices fell for a fifth straight month in November, pulled down by declining costs for petroleum products and a strong dollar, supporting the view that inflation could continue to moderate in the months ahead.Import prices dropped 0.6% last month after declining 0.4% in October. Prices have now decreased for five months in a row, the longest such stretch since 2015.Economists polled by Reuters had forecast import prices, which exclude tariffs, would fall 0.5%. In the 12 months through November, import prices increased 2.7%, the smallest gain since January 2021, after rising 4.1% in October. Imported fuel prices fell 2.8% last month after dropping 2.7% in October. Petroleum prices decreased 3.3%, while the cost of imported food rebounded 1.8%. |
2.0% |
2.9% |
|
|
|
| |
|
|
|
U.S. import prices dropped for a fourth straight month in October, weighed down by declining costs for petroleum products and a strong dollar, the latest indication that inflation had probably peaked. Import prices fell 0.2% last month after decreasing 1.1% in September, the Labor Department said on Wednesday. In the 12 months through October, import prices increased 4.2%, the smallest rise since February 2021, after climbing 6.0% in September. Economists polled by Reuters had forecast import prices, which exclude tariffs, falling 0.4% month-on-month. Falling import prices also pointed to an easing of snarled global supply chains, which was reflected in weak readings in underlying consumer and producer goods prices in October. The report also showed export prices slipped 0.3% in October after dropping 1.5% in September. |
Jan |
-89.7B |
|
2022 |
|
| |
|
|
|
A separate report Thursday showed that import prices fell 1.2% in September, slightly more than the 1.1% estimate. Exports declined 0.8%. U.S. import prices decreased 1.2 percent in September, after declining 1.1 percent the previous month, the U.S. Bureau of Labor Statistics reported today. Lower fuel and nonfuel prices in September contributed to the drop in U.S. import prices. Prices for U.S. exports fell 0.8 percent in September following a 1.7-percent decline in August. |
2.0% |
2.9% |
|
|
|
| |
|
|
|
U.S. import prices fell for a second straight month in August, weighed down by declining costs for petroleum products and a strong dollar, which overtime could help to lower inflation. Import prices dropped 1.0% last month after declining 1.5% in July, the Labor Department said on Thursday. In the 12 months through August, import prices increased 7.8% after climbing 8.7% in July. Economists polled by Reuters had forecast import prices, which exclude tariffs, falling 1.2% month-on-month. The drop in import prices also suggests an easing of bottlenecks in the global supply chain. The report also showed export prices dropped 1.6% in August after decreasing 3.7% in July. Prices for agricultural exports fell 0.4% as lower prices for corn, fruit, meat and wheat offset higher prices for soybeans and vegetables. Nonagricultural export prices decreased 1.8%. Export prices increased 10.8% year-on-year in August after advancing 12.9% in July. |
Jan |
-89.7B |
|
2022 |
|
| |
|
|
|
U.S. import prices fell for the first time in seven months in July, helped by a strong dollar and lower fuel and nonfuel costs, while consumers' one-year inflation outlook ebbed in August, the latest signs that price pressures may have peaked. Import prices, which exclude tariffs, fell 1.4% last month after rising 0.3% in June, the Labor Department said on Friday. That was the largest monthly drop since April 2020 and exceeded the 1.0% decline expected by economists in a Reuters poll. In the 12 months through July, import prices gained 8.8% after a 10.7% rise in June, marking the annual rate's fourth straight monthly decline. The report followed other tentative indications earlier this week that inflation was finally coming off the boil. U.S. consumer prices were unchanged in July due to a sharp drop in the cost of gasoline, after advancing 1.3% in June, although underlying price pressures remained elevated. Producer prices also declined last month on the back of lower energy costs. |
2.0% |
2.9% |
|
|
|
| |
|
|
|
U.S. import prices increased less than expected in June, likely as a strong dollar helped to curb gains in the costs of goods excluding petroleum products, offering some hopeful sign for an economy struggling with soaring inflation. Import prices rose 0.2% last month after climbing 0.5% in May, the Labor Department said on Friday. In the 12 months through June, import prices increased 10.7% after advancing 11.6% in May. Economists polled by Reuters had forecast import prices, which exclude tariffs, gaining 0.7% month-on-month. The report followed on the heels of data this week showing annual consumer prices shot up 9.1% in June, the largest increase since November 1981, as the cost of gasoline soared to record highs. Producer prices also accelerated last month. |
Jan |
-89.7B |
|
2022 |
|
| |
|
|
|
U.S. import prices rose 0.6 percent in May, after advancing 0.4 percent in April, the U.S. Bureau of Labor Statistics reported today. Higher fuel prices in May offset lower nonfuel prices. The price index for U.S. exports increased 2.8 percent in May following a 0.8-percent rise the previous month. Imports : Prices for U.S. imports advanced 0.6 percent in May following a 0.4-percent increase in April and a 3.0- percent rise in March. The last monthly decline for import prices was a 0.4-percent decrease in December 2021. U.S. import prices increased 11.7 percent for the year ended in May. Exports : U.S. export prices increased 2.8 percent in May, after advancing 0.8 percent in April and 4.2 percent in March. Higher prices for both nonagricultural and agricultural exports contributed to the U.S. export price rise in May. The export price index increased 18.9 percent from May 2021 to May 2022, the largest over-the-year rise since 12-month percent changes were first published in September 1984. |
2.0% |
2.9% |
|
|
|
| |
|
|
|
Import prices unchanged in April, up 12.0% year-on-year. A separate report from the Labor Department showed import prices were unexpectedly flat in April as a decline in the cost of petroleum offset gains in food and other products. Import prices had surged 2.9% in March. Economists had forecast import prices, which exclude tariffs, would climb 0.6%. In the 12 months through April, import prices rose 12.0% after accelerating 13.0% in the year through March. |
Jan |
-89.7B |
|
2022 |
|
| |
|
|
|
Import prices increased 2.6% in MArch 2022, the biggest one-month jump since 2011. Also, inflation continued to hit imports, with prices rising by 2.6%, the largest month increase since April 2011, the Bureau of Labor Statistics reported. That was higher even than the 2.2% estimate. On a 12-month basis, import prices jumped 12.5%, the largest such gain since September 2011. |
2.0% |
2.9% |
|
|
|
| |
|
|
|
U.S. import prices rose 1.4 percent in February 2022, after advancing 1.9 percent in January 2022, the U.S. Bureau of Labor Statistics reported today. Higher fuel and nonfuel prices drove the increases in both months. Prices for U.S. exports advanced 3.0 percent in February 2022 following a 2.8-percent rise the previous month. Imports : The price index for U.S. imports increased 1.4 percent in February following a 1.9-percent advance in January and a 0.4-percent decline in December. U.S. import prices rose 10.9 percent over the past 12 months. Exports : U.S. export prices rose 3.0 percent in February, after a 2.8-percent advance the previous month. The February increase was the largest monthly rise since 1-month percent changes were first published in January 1989. Higher prices for both agricultural and nonagricultural exports in February contributed to the overall advance in U.S. export prices. Prices for U.S. exports increased 16.6 percent for the year ended in February. |
Jan |
-89.7B |
|
2022 |
|
| |
|
|
|
U.S. import prices increased by the most in nearly 11 years in January 2022 amid a jump in the cost of energy products and strained supply chains, the latest indication that high inflation could persist for a while. Import prices increased 2.0% last month, the largest rise since April 2011, after declining 0.4% in December, the Labor Department said on Wednesday. In the 12 months through January, prices accelerated 10.8% after rising 10.2% in December. Economists polled by Reuters had forecast import prices, which exclude tariffs, advancing 1.3%. The report followed news on Tuesday that producer prices increased by the most in eight months in January. Consumer prices also rose solidly last month, with the annual inflation rate posting its largest increase in 40 years. |
2.0% |
2.9% |
|
|
|
| |
|
|
|
U.S. import prices rose 1.4 percent in February 2022, after advancing 1.9 percent in January 2022, the U.S. Bureau of Labor Statistics reported today. Higher fuel and nonfuel prices drove the increases in both months. Prices for U.S. exports advanced 3.0 percent in February 2022 following a 2.8-percent rise the previous month. Imports : The price index for U.S. imports increased 1.4 percent in February following a 1.9-percent advance in January and a 0.4-percent decline in December. U.S. import prices rose 10.9 percent over the past 12 months. Exports : U.S. export prices rose 3.0 percent in February, after a 2.8-percent advance the previous month. The February increase was the largest monthly rise since 1-month percent changes were first published in January 1989. Higher prices for both agricultural and nonagricultural exports in February contributed to the overall advance in U.S. export prices. Prices for U.S. exports increased 16.6 percent for the year ended in February. |
Jan |
-89.7B |
|
2022 |
|
| |
|
|
|
U.S. import prices increased by the most in nearly 11 years in January 2022 amid a jump in the cost of energy products and strained supply chains, the latest indication that high inflation could persist for a while. Import prices increased 2.0% last month, the largest rise since April 2011, after declining 0.4% in December 2021, the Labor Department said on Wednesday. In the 12 months through January, prices accelerated 10.8% after rising 10.2% in December. Economists polled by Reuters had forecast import prices, which exclude tariffs, advancing 1.3%. |
2.0% |
2.9% |
|
|
|
|
|
|
| |
|
Prices for U.S. exports fell 1.8 percent in December 2021 following a 0.8-percent advance in November 2021. The price index for U.S. imports declined 0.2 percent in December, the first monthly decrease since the index fell 0.2 percent in August 2021 |
-0.2% |
-1.8% |
|
|
|
|
|
|
| |
|
|
|
|
|
|
| |
|
|
|
|
|
| |
|
|
|
|
|
|
|
|
|
|
|
|
|
|
|
Brief News | 2021 |
|
|
Import and Export Prices | Inflation |
|
Today's Week |
|
|
|
|
|
|
|
|
|
|
|
|
|
Import and Export Prices
| DATE/WEEK |
HIGHLIGHTS |
IMPORT |
EXPORT |
|
Prices for U.S. imports rose 0.7 percent in November 2021 following a 1.5-percent increase in October, the U.S. Bureau of Labor Statistics reported today. In November, both higher fuel and nonfuel prices contributed to the advance. U.S. export prices rose 1.0 percent in November, after increasing 1.6 percent in October and 0.3 percent in September.
|
0.7% |
1.0% |
|
|
|
|
|
|
| |
|
U.S. import prices rose 1.2 percent in October 2021 following a 0.4-percent advance in September, the U.S. Bureau of Labor Statistics reported today. Higher fuel and nonfuel prices contributed to the October increase. Prices for U.S. exports advanced 1.5 percent in October 2021, after rising 0.4 percent in September and 0.3 percent in August. |
1.2% |
1.5% |
|
|
|
|
|
|
| |
|
Food, fuels lift U.S. import prices in September.2021. U.S. import prices rebounded in September, lifted by higher food and energy costs, but underlying imported inflation showed signs of moderating. Import prices rose 0.4% last month after falling 0.3% in August, the Labor Department said on Friday. In the 12 months through September, prices shot up 9.2% after advancing 8.9% in August. Economists polled by Reuters had forecast import prices, which exclude tariffs, increasing 0.6%. |
0.4% |
0.1% |
|
|
|
|
|
|
| |
|
U.S. import prices post first decline in 10 months. U.S. import prices fell for the first time in 10 months in August 2021 amid a decline in the costs of petroleum products, further evidence that inflation had probably peaked. Import prices dropped 0.3% last month after increasing 0.4% in July, the Labor Department said on Wednesday. The first decrease since October 2020 lowered the year-on-year increase to 9.0% from 10.3% in July. The report also showed export prices climbed 0.4% in August, the smallest gain since October 2020, after shooting up 1.1% in July. |
-0.3% |
0.4 |
|
|
|
|
|
|
| |
|
Prices for U.S. imports increased 0.3 percent in July 2021, after advancing 1.1 percent the previous month, the U.S. Bureau of Labor Statistics reported today. The July increase was driven by higher fuel prices. U.S. export prices rose 1.3 percent in July following a 1.2-percent advance in June. U.S. import prices increased 0.3 percent in July, after advances of 1.1 percent in June and 1.3 percent in May. The July rise is the smallest monthly increase since the index ticked up 0.1 percent in November. Prices for U.S. imports advanced 10.2 percent from July 2020 to July 2021, led by higher prices for both nonfuel and fuel products. |
0.3% |
1.3% |
|
|
|
|
|
|
| |
|
U.S. import prices rise solidly in June 2021. U.S. import prices increased solidly in June as bottlenecks in the global supply chain persisted, the latest indication that inflation could remain elevated for a while amid strong domestic demand fueled by the economy's reopening and fiscal stimulus. Still, prices appeared to have peaked. Import prices rose 1.0% last month after surging a 1.4% in May, the Labor Department said on Thursday. The eighth straight monthly gain left the year-on-year increase at 11.2% compared with 11.6% in May. Economists polled by Reuters had forecast import prices, which exclude tariffs, increasing 1.2%. The report also showed export prices increased 1.2% in June after rising 2.2% in May. Prices for agricultural exports advanced 1.5%. Nonagricultural export prices gained 1.1%. Export prices increased 16.8% year-on-year in June after surging a 17.5% in May. |
1.0% |
1.2% |
|
|
|
| |
|
|
| |
|
U.S. import prices accelerate in May 2021; export prices surge. U.S. import prices increased more than expected in May 2021 as the cost of petroleum products rose and supply chain bottlenecks boosted prices of other goods, adding to signs that inflation was heating up amid a reopening economy. Import prices rose 1.1% last month after gaining a 0.8% in April, the Labor Department said on Wednesday. The seventh straight monthly gain lifted the year-on-year increase to 11.3%, the largest rise since September 2011. Import prices surged 10.8% on a year-on-year basis in April. Economists polled by Reuters had forecast import prices, which exclude tariffs, rising 0.8%. Part of the acceleration in the year-on-year prices reflected the dropping of last spring's weak readings from the calculation. |
1.1% |
2.2% |
|
|
|
| |
|
|
|
Import prices surge again in April 2021 and help fuel rising U.S. inflation Over the past year import prices minus fuel have climbed a milder 5%. U.S. export prices advanced 0.8% last month. U.S. import prices increased solidly in April, the latest sign of inflation ramping up as the economy reopens. Import prices rose 0.7% last month after surging 1.4% in March, the Labor Department said on Friday. The sixth straight monthly gain lifted the year-on-year increase to 10.6%, the largest rise since October 2011. Import prices advanced 7.0% on a year-on-year basis in March. Part of the jump in the year-on-year prices reflected the dropping of last spring’s weak readings from the calculation. Economists polled by Reuters had forecast import prices, which exclude tariffs, increasing 0.6%. |
0.7% |
0.8% |
|
|
|
| |
|
|
|
Import and Export Prices Surge in the Covid-19 Recovery. Import and export prices continue to surge as the recovery strengthens. U.S. import prices advanced 1.2 percent in March 2021, 1.3 percent in February, and 1.4 percent in January. The 4.1-percent increase from December to March was the largest 3-month rise for import prices since the index advanced 5.8 percent in May 2011. The price index for U.S. imports increased 6.9 percent from March 2020 to March 2021, the largest over-the-year advance in the index since a 6.9-percent rise for the year ended January 2012. Prices for U.S. exports increased 2.1 percent in March, after rising 1.6 percent in February and 2.6 percent in January. The 6.5-percent advance from December to March was the largest 3-month increase since the index was first published in September 1983. In March, higher prices for agricultural and nonagricultural exports both contributed to the advance in export prices. The price index for U.S. exports rose 9.1 percent from March 2020 to March 2021, the largest over-the-year increase since a 9.4-percent advance in September 2011. |
1.2% |
2.1% |
|
|
|
|
|
|
| |
|
U.S. import prices increased strongly in February 2021, boosted by higher costs for crude oil and commodities, strengthening expectations for an acceleration in inflation this year. The Labor Department said on Tuesday import prices rose 1.3% last month after surging 1.4% in January. Economists polled by Reuters had forecast import prices, which exclude tariffs, advancing 1.2% in February.In the 12 months through February, import prices accelerated 3.0%. That was the largest gain since March 2012 and followed a 1.0% rise in January.Import price index MoM 1.3% versus 1.0% estimate. Last month prices rose 1.4%. Import price index YoY 3.0% versus 2.6% estimate Export price index MoM 1.6% versus 1.0% estimate. Export price index YoY 5.2% versus 4.4% estimate. U.S export prices advanced 1.6 percent in February, after a 2.5-percent rise in January which was the largest 1-month increase since the index was first published monthly in December 1988. |
1.3% |
1.6% |
|
|
|
|
|
|
| |
|
U.S. import prices increased by the most in nearly nine years in January 2021, lifted by higher prices for energy products and a weak dollar, supporting expectations for an acceleration in inflation in the coming months.
The Labor Department said on Thursday import prices jumped 1.4% last month, the biggest gain since March 2012, after increasing 1.0% in December.
Export prices increased 2.3% on a year-on-year basis in January, after rising 0.4% in December. The report also showed export prices surged 2.5% in January, the largest rise since the index was first published on a monthly basis in December 1988, after increasing 1.3% in December. Prices for agricultural exports rose 6.0%, while nonagricultural exports increased 2.2%. Export prices increased 2.3% on a year-on-year basis in January, after rising 0.4% in December. |
1.4% |
|
|
|
|
|
|
|
| |
|
U.S. import prices advanced 0.9 percent in December 2020, the U.S. Bureau of Labor Statistics reported today, following a 0.2-percent increase the previous month. Higher fuel and nonfuel prices both contributed to the December rise in import prices. The price index for U.S. imports rose 0.9 percent in December, after advancing 0.2 percent from August to November. The December increase was the largest monthly advance since August. Import prices declined 0.3 percent for the year ended in December. The last time the index rose on a 12-month basis was a 0.5- percent increase in January 2020. Prices for U.S. exports also rose in December, advancing 1.1 percent, after increasing 0.7 percent in November 2020. U.S. export prices increased 1.1 percent in December, the largest 1-month advance since a 1.8-percent rise in June 2020. In December, higher agricultural and nonagricultural prices contributed to the increase in export prices. Prices for U.S. exports rose 0.2 percent from December 2019 to December 2020, the first 12- month advance since January 2020 |
0.9% |
1.1% |
|
|
|
|
|
|
| |
|
|
|
|
|
|
| |
|
|
|
|
|
| |
|
Legends: |
|
Delayed |
|
Positive View |
|
Negative View |
|
Neutral View |
|
Non Available |
|
|
|
|
|
|
|
|
|
|
|
|
|
|
|
|
|
|
|
|
| |
|
|
|
|
|
|
|
|
|
|
|
|
|
|
|
|
|
|
|
|
|
Definitions | Explain |
|
|
Import and Export Prices | Inflation |
|
Today's Week |
|
|
|
|
|
|
|
|
|
|
|
|
| |
|
|
|
|
| |
|
| Import/Export Price Indexes |
Import price indexes are compiled for the prices of goods that are bought in the United States but produced abroad and export price indexes are compiled for the prices of goods sold abroad but produced domestically. These prices, which exclude tariffs and taxes, measure underlying inflationary trends in internationally traded products.
The International Price Program (IPP) produces Import/Export Price Indexes (MXP) containing data on changes in the prices of nonmilitary goods and services traded between the U.S. and the rest of the world.
What is U.S. Imports?
Imports under balance of payments: The cost of goods and materials that the world’s largest economy, as now the US, purchases from abroad. For example:
- Commodities like Oil: fuel cost is what influences the most because inflation.
- Food cost
- Import vehicles
Import prices falling means that countries abroad are not able to push prices up because there is no demand, or soft demand.
Inflation
Import prices indicate inflationary trends in internationally traded products. Thus, this report could raise any inflationary alarms for the CPI and PPI.
Price Gauges
The import-price index is the first of three monthly price gauges from the Labor Department:
1. Import Price Index, Import price indexes are compiled for the prices of goods that are bought in the United States but produced abroad.
2. Producer Price Index (PPI), one of three monthly inflation gauges reported by the Labor Department, are calculated based on costs on the Tuesday of the week containing the 13th of the month, which may influence month-to-month changes.
3. Consumer Price Index (CPI), the broadest of the three measures, is due tomorrow. Economists in the Bloomberg survey predict the cost of living rose 0.3%, the smallest gain in three months, according to the median.
Export Prices
Export price indexes are developed for the prices of goods sold abroad but produced domestically. On the export side, the price of U.S. exports may fall for potential lower demand overseas.
What moves Import Prices?
The drop or fall in fuel prices together with strength in the dollar and a general easing in global demand can pull prices of imported goods lower. |
|
|
| |
|
|
|
|
|
|
|
|
|
|
|
|
|
|
|
|
|
|
|
|
|
Data | Source |
|
|
Import and Export Prices | Inflation |
|
Today's Week |
|
|
|
|
|
|
|
|
|
|
|
|
| |
|
|
|
|
|
|
| DATA INFORMATION |
IMPORT AND EXPORT PRICES |
| SOURCE |
Bureau of Labor Statistics (BLS), U.S. Department of Labor
|
| WEB |
www.bls.gov |
| FREQUENCY |
Monthly |
| AVAILABILITY |
Mid-month |
| COVERAGE |
Data are for the previous month. Data for June are released in July. |
| REVISIONS |
No |
| IMPORTANCE |
Inflation - Very Important |
|
| |
|
|
|
|
|
|
|
|
|
|
|
|