Tradingvesting..com
US Trade in Goods
US Trade in Goods (Adv) | Growth
Trade Balance or International Trade is the difference between a country's imports and its exports. A Trade Deficit is a measure of a negative balance of trade in which a country's Imports exceeds its Exports...→ Read more
Big Chart
Release Dates
Brief News
Explain
ECONOMIC REPORTS
1


MARKET CORRELATION
1


5
EXTERNAL FACTORS
1
2
3
 
GDP - TradeBalance - InGoods - ConsSpend - CorpProft - CurrAcct - Compare
 
 
US Trade in Goods3. US Trade in Goods (3 of 6)
Construction Spending 4. Construction Spending (4 of 6)
Corporate Profits5. Corporate Profit (5 of 6)
Current Account6. Current Account (6 of 6)
Real GDP1. Real GDP (1 of 6)
US Trade Balance2. US Trade Balance (2 of 6)
Prev Category Prev Real GDP US Trade Balance US Trade in Goods Construction Spending Corporate Profits Current Account Next Next Category
    → Big Chart   → Release
GROWTH
 
2
Description
Frequency
Day
Hour
Importance
Rev
 
 
1
Monthly
Thu 26
8:30
 
 
2
Monthly
Tue 05
8:30
 
 
3
Monthly
Thu 27
8:30
 
 
4
Monthly
Mon 02
10:00
 
 
5
7 Times
Thu 25
8:30
 
 
6
4 Times
Thu 20
8:30
 
 
Definitions Definitions Big View Big Data Small View Small Data Reports Reports   Snapshot I Snapshot i Snapshot II Snapshot II Slides Slides Economics Reports Global
 
         
Top of Page
       
  Big Chart | Large Data USA US Trade in Goods (Adv) | Growth   Today's Week Today's Week
US TRADE BALANCE IN GOODS
US Trade in Goods
 
Previous Large Set Data Small Set Data Definitions Today Next
         
Top of Page
       
  Slides | Six 6 USA US Trade in Goods (Adv) | Growth   Today's Week Today's Week
GROWTH - SLIDES
www.tradingvesting.com www.tradingvesting.com www.tradingvesting.com www.tradingvesting.com www.tradingvesting.com www.tradingvesting.com
 
Global Real GDP US Trade Balance US Trade in Goods Construction Spending Corporate Profits Current Account Reports
         
Top of Page
       
Tradingvesting.com   Release Schedule | 2026 USA US Trade in Goods (Adv) | Growth   Today's Week Today's Week
US Trade in Goods Advance (At 8:30a.m ET)
RELEASE 2026
No 1
No 2
No 3
No 4
No 5
No 6
No 7
No 8
No 9
No 10
No 11
No 12
Release | Week
Week 44
Release | Date
Release | Day
Prior:
...
...
...
...
...
...
...
...
...
...
...
...
Prior Revised:
$-83.6B
...
...
...
...
...
...
...
...
...
...
...
Consensus:
...
...
...
...
...
...
...
...
...
...
...
...
Consensus Low:
...
...
...
...
...
...
...
...
...
...
...
...
Consensus High:
...
...
...
...
...
...
...
...
...
...
...
...
Balance:
-99.3B
...
...
...
...
...
...
...
...
...
...
...
Release For:
Dec-25
Jan-26
Feb-26
Mar-26
Apr-26
May-26
Jun-26
Jul-26
Aug-26
Sep-26
Oct-26
Nov-26
IMPORTS 2026
No 1
No 2
No 3
No 4
No 5
No 6
No 7
No 8
No 9
No 10
No 11
No 12
Imports Prior:
...
...
...
...
...
...
...
...
...
...
...
...
Imports Rev:
5.9%
...
...
...
...
...
...
...
...
...
...
...
Imports M/M:
3.8%
...
...
...
...
...
...
...
...
...
...
...
Release For:
Dec-25
Jan-26
Feb-26
Mar-26
Apr-26
May-26
Jun-26
Jul-26
Aug-26
Sep-26
Oct-26
Nov-26
EXPORTS 2026
No 1
No 2
No 3
No 4
No 5
No 6
No 7
No 8
No 9
No 10
No 11
No 12
Exports Prior:
...
...
...
...
...
...
...
...
...
...
...
...
Exports Rev:
-5.25
...
...
...
...
...
...
...
...
...
...
...
Exports M/M:
-2.9%
...
...
...
...
...
...
...
...
...
...
...
RATING:
Negative View
Negative View
Negative View
N/A
N/A
N/A
N/A
N/A
N/A
N/A
N/A
N/A
Release For:
Dec-25
Jan-26
Feb-26
Mar-26
Apr-26
May-26
Jun-26
Jul-26
Aug-26
Sep-26
Oct-26
Nov-26
 
 
Tradingvesting.com   Release Schedule | 2025 USA US Trade in Goods (Adv) | Growth   Today's Week Today's Week
US Trade in Goods Advance (At 8:30a.m ET)
RELEASE 2025
No 1
No 2
No 3
No 4
No 5
No 6
No 7
No 8
No 9
No 10
No 11
No 12
Release | Week
Release | Date
Release | Day
Prior:
$-102.9B
$-122.1B
$-153.3B
$-147.9B
$-162.0B
$-87.6B
$-96.6B
$-86.0B
$-103.6B
...
...
...
Prior Revised:
$-103.5B
$-122.0B
$-155.6B
$-147.8B
$-162.3B
$-87.0B
$-96.4B
$-84.9B
$-102.8B
....
....
....
Consensus:
-102.5B
-116.0B
-135.5B
-145.0B
-143.0B
-90.7B
-99.0B
-87.7B
-94.4B
...
...
...
Consensus Low:
$-115.1B
$-122.1B
$-145.0B
$-160.0B
$-167.3B
$-93.0B
$-130.0B
$-99.8B
$-96.0B
...
...
...
Consensus High:
$-101.0B
$-110.1B
$-131.1B
$-124.3B
$-110.0B
$-70.0B
$-90.0B
$-87.0B
$-93.0B
...
...
...
Balance:
-122.1B
-153.3B
-147.9B
-162.0B
-87.6B
-96.6B
-86.0B
-103.6B
-103.6B
-...
-...
-...
Release For:
Dec-24
Jan-25
Feb-25
Mar-25
Apr-25
May-25
Jun-25
Jul-25
Aug-25
Sep-25
Oct-25
Nov-25
IMPORTS 2025
No 1
No 2
No 3
No 4
No 5
No 6
No 7
No 8
No 9
No 10
No 11
No 12
Imports Prior:
4.5%
3.9%
11.9%
-0.2%
5.0%
-19.8%
0.0%
-4.2%
7.1%
...
...
...
Imports Rev:
4.4%
4.30%
12.5%
...
5.7%
-19.9%
-0.1%
-4.6%
7.0%
...
...
...
Imports M/M:
3.9%
11.9%
-0.2%
5.0%
-19.8%
0.0%
-4.2%
7.1%
-7.0%
...
...
...
Release For:
Dec-24
Jan-25
Feb-25
Mar-25
Apr-25
May-25
Jun-25
Jul-25
Aug-25
Sep-25
Oct-25
Nov-25
EXPORTS 2025
No 1
No 2
No 3
No 4
No 5
No 6
No 7
No 8
No 9
No 10
No 11
No 12
Exports Prior:
4.4%
4.5%
2.0%
4.1%
1.2%
3.4%
-5.2%
-0.6%
-0.1%
...
...
...
Exports Rev:
3.3%
-3.8%
1.6%
3.6%
2.3%
3.5%
-5.7%
-0.7%
0.0%
...
...
...
Exports M/M:
-4.5%
2.0%
4.1%
1.2%
3.4%
-5.2%
-0.6%
-0.1%
-1.3%
...
...
...
RATING:
Negative View
Positive View
Positive View
Positive View
Positive View
Negative View
Negative View
Negative View
Negative View
Negative View
Negative View
Negative View
Release For:
Dec-24
Jan-25
Feb-25
Mar-25
Apr-25
May-25
Jun-25
Jul-25
Aug-25
Sep-25
Oct-25
Nov-25
 
 
Tradingvesting.com   Release Schedule | 2024 USA US Trade in Goods (Adv) | Growth   Today's Week Today's Week
US Trade in Goods Advance (At 8:30a.m ET)
RELEASE 2024
No 1
No 2
No 3
No 4
No 5
No 6
No 7
No 8
No 9
No 10
No 11
No 12
Release | Week
Release | Date
Release | Day
Prior:
$-90.3B
$-88.5B
$-90.2B
$-91.8B
$-91.8B
$-99.4B
$-100.6B
$-96.8B
$-102.7B
...
...
...
Prior Revised:
$-89.3B
$-87.9B
$-90.5B
$-90.3B
$-92.3B
$-98.0B
$-99.4B
$-96.6B
$-102.8B
...
...
...
Consensus:
-88.5B
-88.1B
-90.6B
-91.0B
-92.5B
-95.6B
-98.0B
-98.0B
-100.0B
...
...
...
Consensus Low:
$-92.8B
$-90.0B
$-92.0B
$-92.2B
$-93.9B
$-100.4B
$-102.0B
$-101.0B
...
...
...
...
Consensus High:
$-88.0B
$-86.0B
$-89.7B
$-89.0B
$-90.0B
$-95.0B
$-97.0B
$-95.0B
...
...
...
...
Balance:
-88.5B
-90.2B
-91.8B
-91.8B
-99.4B
-100.6B
-96.8B
-102.7B
-94.3B
...
...
-102.9B
Release For:
Dec-23
Jan-24
Feb-24
Mar-24
Apr-24
May-24
Jun-24
Jul-24
Aug-24
Sep-24
Oct-24
Nov-24
IMPORTS 2024
No 1
No 2
No 3
No 4
No 5
No 6
No 7
No 8
No 9
No 10
No 11
No 12
Imports Prior:
-2.1%
1.3%
1.1%
2.3%
-1.7%
3.1%
-0.7%
0.7%
2.3%
...
...
...
Imports Rev:
-2.3%
1.5%
1.2%
1.8%
-1.7%
...
...
0.8%
...
...
...
...
Imports M/M:
1.3%
1.1%
2.3%
-1.7%
3.1%
-0.7%
0.7%
2.3%
-1.6%
...
...
4.5%
Release For:
Dec-23
Jan-24
Feb-24
Mar-24
Apr-24
May-24
Jun-24
Jul-24
Aug-24
Sep-24
Oct-24
Nov-24
EXPORTS 2024
No 1
No 2
No 3
No 4
No 5
No 6
No 7
No 8
No 9
No 10
No 11
No 12
Exports Prior:
-3.6%
2.5%
0.2%
2.8%
-3.5%
0.5%
-2.7%
2.5%
0.0%
...
...
...
Exports Rev:
-3.2%
...
0.1%
2.9%
-2.9%
1.3%
-1.8%
2.7%
...
...
...
...
Exports M/M:
2.5%
0.2%
2.8%
-3.5%
0.5%
-2.7%
2.5%
0.0%
2.4%
...
...
4.4%
RATING:
Negative View
Negative View
Positive View
Negative View
Negative View
Negative View
Positive View
Negative View
Negative View
Negative View
Negative View
Negative View
Release For:
Dec-23
Jan-24
Feb-24
Mar-24
Apr-24
May-24
Jun-24
Jul-24
Aug-24
Sep-24
Oct-24
Nov-24
 
 
Tradingvesting.com   Release Schedule | 2023 USA US Trade in Goods (Adv) | Growth   Today's Week Today's Week
US Trade in Goods Advance (At 8:30a.m ET)
RELEASE 2023
No 1
No 2
No 3
No 4
No 5
No 6
No 7
No 8
No 9
No 10
No 11
No 12
Release | Week
Release | Date
Release | Day
Prior:
$-83.3B
$-90.3B
$-91.5B
$-91.6B
$-84.6B
$-96.8B
$-91.1B
$-87.8B
$-91.2B
$-84.3B
$-85.8B
$-89.8B
Prior Revised:
$-82.9B
$-89.7B
$-91.1B
$-92.0B
$-82.7B
$-97.1B
$-91.9B
$-88.8B
$-90.9B
$-84.6B
$-86.8B
$89.6B
Consensus:
-88.5B
-91.0B
-90.0B
-90.0B
-85.6B
-92.5B
-91.8B
-90.8B
-90.1B
-85.4B
-86.7B
-89.6B
Consensus Low:
$-96.1B
$-94.0B
$-94.0B
$-93.5B
$-88.0B
$-95.3B
$-93.1B
$-95.0B
$-95.0B
$-93.0B
$-92.0B
$-92.6B
Consensus High:
$-82.5B
$-87.0B
$-88.0B
$-89.0B
$-83.0B
$-86.0B
$-90.0B
$-89.1B
$-89.2B
$-84.0B
$-84.1B
$-88.3B
Balance:
-90.3B
-91.5B
-91.6B
-84.6B
-96.8B
-91.1B
-87.8B
-91.2B
-84.3B
-85.8B
-89.8B
-90.3B
IMPORTS 2023
No 1
No 2
No 3
No 4
No 5
No 6
No 7
No 8
No 9
No 10
No 11
No 12
Imports Prior:
-7.6%
1.9%
3.4%
-2.3%
-1.0%
1.8%
-2.7%
-1.4%
1.9%
-1.2%
2.4%
0.0%
Imports Rev:
...
...
3.7%
-2.2%
-1.9%
2.1%
...
-1.1%
2.1%
-1.0%
2.7%
0.1%
Imports M/M:
1.9%
3.4%
-2.3%
-1.0%
1.8%
-2.7%
-1.4%
1.9%
-1.2%
2.4%
0.0%
-2.1%
EXPORTS 2023
No 1
No 2
No 3
No 4
No 5
No 6
No 7
No 8
No 9
No 10
No 11
No 12
Exports Prior:
-3.1%
-1.6%
4.2%
3.8%
2.9%
-5.5%
-0.6%
0.2%
1.5%
2.2%
2.9%
-1.7%
Exports Rev:
-2.8%
-1.7%
5.0%
...
2.1%
-5.3%
-0.9%
-0.1%
1.7%
2.3%
...
-1.4%
Exports M/M:
-1.6%
4.2%
-3.8%
2.9%
-5.5%
-0.6%
0.2%
1.5%
2.2%
2.9%
-1.7%
-3.6%
RATING:
Negative View
Positive View
Negative View
Positive View
Negative View
Negative View
Positive View
Negative View
Positive View
Positive View
Negative View
Negative View
Release For:
Dec-22
Jan-23
Feb-23
Mar-23
Apr-23
May-23
Jun-23
Jul-23
Aug-23
Sep-23
Oct-23
Nov-23
 
 
Tradingvesting.com   Release Schedule | 2022 USA US Trade in Goods (Adv) | Growth   Today's Week Today's Week
US Trade in Goods Advance (At 8:30a.m ET)
RELEASE 2022
No 1
No 2
No 3
No 4
No 5
No 6
No 7
No 8
No 9
No 10
No 11
No 12
Release | Week
Release | Date
Release | Day
Prior:
$-97.8B
$-101.0B
$-107.6B
$-106.6B
$-125.3B
$105.9B
$-104.3B
$-98.2B
$-89.1B
$-87.3B
$-92.2B
$-99.0B
Prior Revised:
$-97.0B
$-102.1B
...
$-106.3B
$-125.9B
$-106.7B
$-104.0B
$-98.6B
$-90.2B
...
$-91.9B
$-98.8B
Consensus:
-95.1B
-98.5B
-106.0B
-105.0B
-118.0B
-102.0B
-103.2B
-97.5B
-88.7B
-87.8B
-90.8B
-97.0B
Consensus Low:
$-99.5B
$-103.2B
$-108.3B
$-106.6B
$-128.1B
$-122.0B
$-110.0B
$-101.3B
$-92.0B
$-89.0B
$-94.0B
$-102.0B
Consensus High:
$-93.0B
$-96.0B
$-99.3B
$-103.7B
$-108.0B
$-100.1B
$-101.4B
$-96.0B
$-85.0B
$-85.3B
$-88.3B
$-95.5B
ACTUAL LEVEL:
-101.0B
-107.6B
-106.6B
-125.3B
-105.9B
-104.3B
-98.2B
-89.1B
-87.3B
-92.2B
-99.0B
-83.3B
Imports:
2.0%
1.7%
0.3%
11.5%
-5.0%
-0.1%
-0.5%
-3.5%
-1.7%
0.8%
0.9%
-7.6%
Exports:
1.4%
-1.8%
1.2%
7.2%
3.1%
1.2%
2.5%
-0.2%
-0.9%
-1.5%
-2.6%
-3.1%
RATING:
Negative View
Negative View
Positive View
Negative View
Positive View
Positive View
Positive View
Negative View
Positive View
Negative View
Negative View
Negative View
Release For:
Dec-21
Jan-22
Feb-22
Mar-22
Apr-22
May-22
Jun-22
Jul-22
Aug-22
Sep-22
Oct-22
Nov-22
 
 
Tradingvesting.com   Release Schedule | 2021 USA US Trade in Goods (Adv) | Growth   Today's Week Today's Week
US Trade in Goods Advance (At 8:30a.m ET)
RELEASE 2021
No 1
No 2
No 3
No 4
No 5
No 6
No 7
No 8
No 9
No 10
No 11
No 12
Release | Week
Release | Date
Release | Day
Prior:
85.5B
-82.5B
-83.7B
...
...
...
...
...
...
...
...
100B
Prior Revised:
No
-83.2B
-84.6B
...
...
...
...
...
...
...
...
...
Consensus:
100B
-83.0B
-86.0B
...
...
...
...
...
...
...
...
100B
Consensus Low:
100B
100B
...
...
...
...
...
...
...
...
...
100B
Consensus High:
100B
100B
...
...
...
...
...
...
...
...
...
100B
ACTUAL LEVEL:
-82.5B
-83.7B
-86.7B
...
...
...
...
...
...
...
...
-97.8B
Month For:
Negative View
Negative View
Negative View
Negative View
Negative View
Negative View
Negative View
Negative View
Negative View
Negative View
Negative View
Negative View
RATING
Dec 20
Jan-21
Feb-21
Mar-21
Apr-21
May-21
Jun-21
Jul-21
Aug-21
Sep-21
Oct-21
Nov-21
 
  Tradingvesting.com Legends: Delayed Delayed Positive View Positive View Negative View Negative View Neutral View Neutral View N/A Non Available Today's Week
         
Top of Page
       
Tradingvesting.com   Brief News | 2026 USA US Trade in Goods (Adv) | Growth   Today's Week Today's Week
US Trade in Goods (At 8:30 a.m ET)
DATE/WEEK HIGHLIGHTS FOR GDP
US Traded In Goods
Q3-FINAL
...
Week 52
2026
N/A
     
US Traded In Goods
Q3-Pre
...
Week 48
2026
N/A
     
US Traded In Goods
Q3-Adv
...
Week 43
2026
N/A
     
US Traded In Goods
Q2-FINAL
...
Week 39
2026
N/A
     
US Traded In Goods
Q2-Pre
...
Week 35
2026
N/A
     
US Traded In Goods
Q2-Adv
...
Week 31
2026
N/A
     
US Traded In Goods
Q1-FINAL
...
Week 26
2026
N/A
     
US Traded In Goods
Q1-Pre
...
Week 22
2026
N/A
     
US Traded In Goods
Q1-Adv
...
Week 18
2026
N/A
     
US Traded In Goods
Q4-FINAL
...
Week 13
2025
N/A
     
US Traded In Goods
Q4-Pre
...
Week 09
2025
N/A
     
US Traded In Goods
Q4-Adv
...
Week 05
2025
N/A
     
         
Top of Page
         
Tradingvesting.com   Brief News | 2025 USA US Trade in Goods (Adv) | Growth   Today's Week Today's Week
US Trade in Goods Advance (At 8:30a.m ET)
DATE/WEEK HIGHLIGHTS For Actual
Trade in Goods
No 12
...
Nov-2024
Negative View
     
Trade in Goods
No 11
...
Oct-2024
Negative View
     
Trade in Goods
No 10
...
Sep-2024
Negative View
     
Trade in Goods
No 9
...
Aug-2024
Negative View
     
Trade in Goods
No 8
...
Jul-2024
Negative View
     
Trade in Goods
No 7
...
Jun-2024
Negative View
     
Trade in Goods
No 6
...
May-2024
Negative View
     
Trade in Goods
No 5
...
Apr-2024
Negative View
     
Trade in Goods
No 4
...
Mar-2024
Negative View
     
Trade in Goods
No 3
...
Feb-2024
Negative View
     
Trade in Goods
No 2
...
Jan-2024
Negative View
     
Trade in Goods
No 1
...
Dec-2023
Negative View
     
         
Top of Page
         
Tradingvesting.com   Brief News | 2024 USA US Trade in Goods (Adv) | Growth   Today's Week Today's Week
US Trade in Goods Advance (At 8:30a.m ET)
DATE/WEEK HIGHLIGHTS FOR Y/Y
Trade in Goods
No 12
...
Nov-2024
N/A
     
Trade in Goods
No 11
...
Oct-2024
N/A
     
Trade in Goods
No 10
Sep-2024
N/A
     
Goods trade deficit narrows 8.3% to $94.3 billion. A report from the Commerce Department's Census Bureau on Friday showed the goods trade deficit contracted $8.6 billion, or 8.3%, in August to $94.3 billion. The dollar amount drop was the largest since November 2022. The decline in the deficit reflected a 1.6% fall in imports, mostly industrial supplies and motor vehicles. Goods exports increased 2.4%, boosted by consumer goods, other goods and motor vehicles. Wholesale inventories rose 0.2%, while stocks at retailers advanced 0.5%. Inventories are expected to erase the anticipated small dent on GDP from trade.
No 9
-94.3B
Aug-2024
Negative View
     
Trade deficit in goods widens sharply to highest level in more than two years. U.S. July trade imbalance up 6.3% to $102.7 billion. The U.S. trade deficit in goods widened 6.3% to $102.7 billion in July, according to the Commerce Department’s advanced estimate released Thursday. That’s the largest deficit since May 2022. Economists polled by Econoday were looking for the deficit to widen to a $98 billion deficit from last month’s $96.6 billion gap.
No 8
-102.7B
Jul-2024
Negative View
     
The goods trade gap contracted 2.5% to $96.8 billion, the Commerce Department's Census Bureau said on Wednesday. The goods trade deficit had widened since January. The U.S. trade deficit in goods narrowed in June 2024 for the first time this year amid a broad rebound in exports, but that probably was insufficient to prevent trade from remaining a drag on economic growth in the second quarter. The impact on gross domestic product from the trade gap is, however, likely to be offset by a rise in inventories at wholesalers and retailers in June. The government is scheduled on Thursday to publish its advance estimate of second-quarter GDP growth, which is expected to show a pick-up in activity, thanks to a spurt in consumer spending in June.
No 7
-96.8B
Jun-2024
Negative View
     
Trade deficit in goods widens in May to highest level in a year. Trade gap up 2.7% to $100.6 billion. The U.S. trade deficit in goods widened 2.7% to $100.6 billion in May, according to the Commerce Department’s advanced estimate released Thursday. This is the largest deficit since last May. Economists polled by Econoday were looking for the deficit to narrow to a $95.6 billion deficit from last month’s $98 billion deficit.
No 6
-100.6B
May-2024
Negative View
     
U.S. April trade gap in goods widens to largest deficit in almost two years. Trade gap widens to $99.4 billion vs forecast of $92.5 billion. The U.S. trade deficit in goods widened 7.7% to $99.4 billion in April, according to the Commerce Department’s advanced estimate released Thursday. That’s the widest deficit since May 2022. Economists polled by Econoday were looking for the deficit to widen to a $92.5 billion deficit.
No 5
-99.4B
Apr-2024
Negative View
     
U.S. trade deficit in goods widens in March to highest level in almost a year. Deficit widens 1.7% to $91.8 billion. The numbers: The U.S. trade deficit in goods widened 1.7% to $91.8 billion in March, according to the Commerce Department’s advanced estimate released Thursday. That’s the largest deficit since last April. The wider deficit was in line with a forecast of economists polled by Econoday.
No 4
-91.8B
Mar-2024
Positive View
     
US February advance goods trade balance -91.84B vs -90.51B prior. Exports of goods for February were $175.1 billion, $4.8 billion more than January exports. Imports of goods for February were $266.9 billion, $6.1 billion more than January imports. Rising trade in general is a good sign for the US economy.
No 3
-91.8B
Feb-2024
Positive View
     
US trade deficit for goods rise 2.6% in January. Deficit rises $2.3 billion from $87.9 billion in December. The US trade deficit for goods increased 2.6% to $90.2 billion in January, according to data released Wednesday. The trade deficit, the difference between imported and exported goods, rose $2.3 billion from $87.9 billion in December, the Commerce Department’s Census Bureau said in a report. The expectation was for the figure was to come in at $88.4 billion. Exports in January totaled $170.4 billion, which were $0.4 billion more than in December. Last month, imports were $260.6 billion -- $2.7 billion more than the previous month.
No 2
-90.2B
Jan-2024
Negative View
     
U.S. trade deficit in goods narrows to $88.5 billion in December from $89.3 in prior month. The U.S. trade deficit in goods narrowed 1% to $88.5 billion in December, according to the Commerce Department’s advanced estimate released Thursday. This was in line with forecasts of economists polled by Econoday.
No 1
-88.5B
Dec-2023
Positive View
     
         
Top of Page
         
Tradingvesting.com   Brief News | 2023 USA US Trade in Goods (Adv) | Growth   Today's Week Today's Week
US Trade in Goods Advance (At 8:30a.m ET)
DATE/WEEK HIGHLIGHTS FOR ACTUAL
U.S. trade deficit in goods widens in November for third straight month. Trade gap hits $90.3 billion, highest since July. The numbers: The U.S. trade deficit in goods widened 0.8% to $90.3 billion in November, according to the Commerce Department’s advance estimate, released Thursday. Economists polled by Econoday were looking for the deficit to widen to $89.6 billion.
No 12
-90.3B
Nov-2023
Negative View
     
U.S. trade deficit in goods widens 3.4% in October 2023. The nation’s trade deficit in goods widened 3.4% in October to $89.8 billion, the Commerce Department said Wednesday. An advanced estimate of wholesale inventories, meanwhile, showed a 0.2% drop in October. Retail inventories were flat, the department said.
No 11
-89.8B
Oct-2023
Negative View
     
The U.S. trade deficit in goods increased moderately in September 2023. The US Goods trade deficit increased to $-85.8 billion last month, September 2023, from $-84.3B in August 2023. The Commerce Department said on Wednesday.The estimate was $-85.4B and August 2023 was revised from $-84.3B to $-84.6B.
No 10
Sep-2023
Positive View
     
U.S. trade deficit in goods shrinks 7.3% — and might give small lift to GDP. Business inventories grow at slower pace. The numbers: The nation’s trade deficit in goods dropped 7.3% in August to $84.3 billion, reflecting in part a decline in consumer imports such as the new iPhone. The trade gap in goods slipped from $90.9 billion in July, Census Bureau figures showed.
No 9
-84.3B
Aug-2023
Negative View
     
U.S. trade deficit in goods widens in July. The numbers: The U.S. trade deficit in goods widened 2.6% to $91.2 billion in July, according to the Commerce Department’s advanced estimate released Wednesday. Economists polled by Econoday were looking for the deficit to rise to $90.8 billion deficit.
No 8
-91.2B
Jul-2023
Positive View
     
U.S. trade deficit in goods narrows slightly in June. Despite the improvement in June, the trade deficit subtracted slightly from second-quarter economic growth. The U.S. international trade deficit in goods narrowed 4.4% to $87.8 billion in June, according to the Commerce Department’s advanced estimate released Thursday. Economists polled by Econoday were looking for the deficit to remain broadely unchanged at a $91.8 billion deficit.
No 7
-87.8B
Jun-2023
Negative View
     
May 2023 Trade Gap is $69.0 Billion. The U.S. goods and services trade deficit decreased from $74.4 billion in April (revised) to $69.0 billion in May, as imports decreased more than exports. The goods deficit decreased $4.8 billion to $91.3 billion, and the services surplus increased $0.7 billion to $22.3 billion
No 6
-69.0B
May-2023
Positive View
     
U.S. trade deficit in goods leaps 17% as exports retreat. Rebound in imports from recent low points to steady consumer spending. The numbers: The trade deficit in goods shot up 17% in April to a six-month high of $96.8 billion, reflecting a rebound in imports and a broad decline in American exports. The trade gap in goods rose from $82.7 billion in March, the Census Bureau said.
No 5
-96.8B
Apr-2023
Negative View
     
The U.S. trade deficit in goods increased moderately in March 2023. The US Goods trade deficit increased to $-84.6 billion last month, March 2023, from $-91.6B in February 2023. The Commerce Department said on Wednesday.The estimate was $-90.0B and February 2023 was revised from $-91.6B to $-92.0B.
No 4
-84.6B
Mar-2023
Negative View
     
The U.S. trade deficit in goods increased moderately in February 2023. The US Goods trade deficit increased to $-91.6 billion last month, February 2023, from $-91.5B in January 2023. The Commerce Department said on Wednesday.The estimate was $-90.0B and January 2023 was revised from $-91.5B to $-91.1B.
No 3
-91.6B
Feb-2023
Negative View
     
U.S. goods trade deficit widens in January; wholesale inventories decline. The U.S. trade deficit in goods increased moderately in January, with both imports and exports rising solidly, leaving trade on track to have little or no impact on gross domestic product growth early in the first quarter.The goods trade deficit widened 2.0% to $91.5 billion, the Commerce Department said on Tuesday. This left the goods trade deficit slightly above the fourth-quarter average. Goods imports increased 3.4% to $265.3 billion. Motor vehicle imports surged 9.0% while imports of consumer goods jumped 6.4%. There were also increases in imports of food and capital goods. But imports of industrial supplies, which include crude oil, fell as did those of other goods. Exports of goods shot up 4.2% to $173.8 billion, boosted by a 14.8% jump in consumer goods. Motor vehicle exports accelerated 8.2%. Exports of capital goods and food also increased strongly. Shipments of industrial supplies, however, rose moderately and exports of other goods fell. A smaller trade deficit was one of the contributors to the economy's 2.7% annualized growth pace in the fourth quarter. The other boost to growth came from inventories..
No 2
-91.5B
Jan-2023
Positive View
     
Trade deficit in goods tops $1 trillion in 2021 for first time as U.S. gobbles up imports. Americans spend huge sums on imports, but exports lag behind. The U.S. trade deficit in goods topped $1 trillion in 2021 for the first time ever, as an economic recovery enabled Americans to snap up a record amount of imports such as toys, cell phones and appliances. For all of 2021, the trade gap in goods rose to $1.08 trillion from $893.5 billion in the prior year. The deficit in 2020 had also been a record high.
No 1
-90.3B
Dec-2022
Negative View
     
         
Top of Page
         
Tradingvesting.com   Brief News | 2022 USA US Trade in Goods (Adv) | Growth   Today's Week Today's Week
US Traded In Goods(At 8:30 a.m ET)
DATE/WEEK HIGHLIGHTS For Actual
Trade in Goods
No 12
...
Nov-2022
Negative View
     
Trade in Goods
No 11
...
Oct-2022
Negative View
     
Trade in Goods
No 10
...
Sep-2022
Negative View
     
Trade in Goods
No 9
...
Aug-2022
Negative View
     
Trade in Goods
No 8
...
Jul-2022
Negative View
     
Trade in Goods
No 7
...
Jun-2022
Negative View
     
Trade in Goods
No 6
...
May-2022
Negative View
     
Trade in Goods
No 5
...
Apr-2022
Negative View
     
Trade in Goods
No 4
...
Mar-2022
Negative View
     
Trade in Goods
No 3
...
Feb-2022
Negative View
     
Trade in Goods
No 2
...
Jan-2022
Negative View
     
Trade in Goods
No 1
...
Dec-2021
Negative View
     
         
Top of Page
         
Tradingvesting.com   Brief News | 2021 USA US Trade in Goods (Adv) | Growth   Today's Week Today's Week
US Traded In Goods(At 8:30 a.m ET)
DATE/WEEK HIGHLIGHTS For Actual
Trade in Goods
No 12
...
Nov-2021
Negative View
     
Trade in Goods
No 11
...
Oct-2021
Negative View
     
Trade in Goods
No 10
...
Sep-2021
Negative View
     
Trade in Goods
No 9
...
Aug-2021
Negative View
     
Trade in Goods
No 8
...
Jul-2021
Negative View
     
Trade in Goods
No 7
...
Jun-2021
Negative View
     
Trade in Goods
No 6
...
May-2021
Negative View
     
Trade in Goods
No 5
...
Apr-2021
Negative View
     
Trade in Goods
No 4
...
Mar-2021
Negative View
     
Trade in Goods
No 3
...
Feb-2021
Negative View
     
Trade in Goods
No 2
...
Jan-2021
Negative View
     
Trade in Goods
No 1
...
Dec-2020
Negative View
     
         
  Tradingvesting.com Legends: Delayed Delayed Positive View Positive View Negative View Negative View Neutral View Neutral View N/A Non Available Today's Week
         
Top of Page
       
Tradingvesting.com   Definitions | Explain USA US Trade in Goods (Adv) | Growth   Today's Week Today's Week
     
   
How the Trade Balance Affects You?

International Trade

Exports grow when foreign economies are strong. The weaker the foreign exchange value of the dollar, the less expensive goods and services are to foreigners, and this also helps spurt export activity. Imports grow when U.S. economic growth is robust. Imports are also spurred by a strong foreign exchange value of the dollar.

International Trade Balance

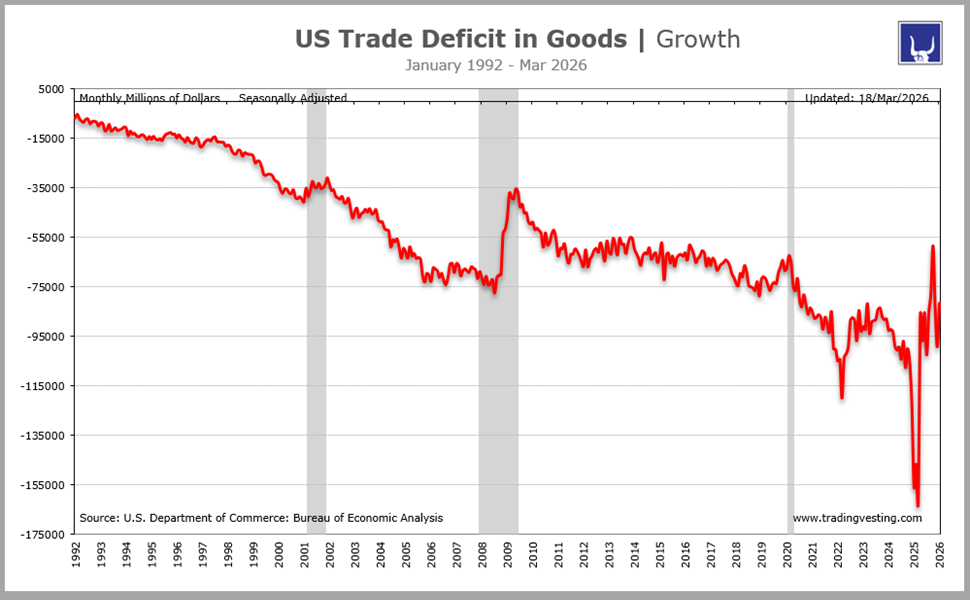
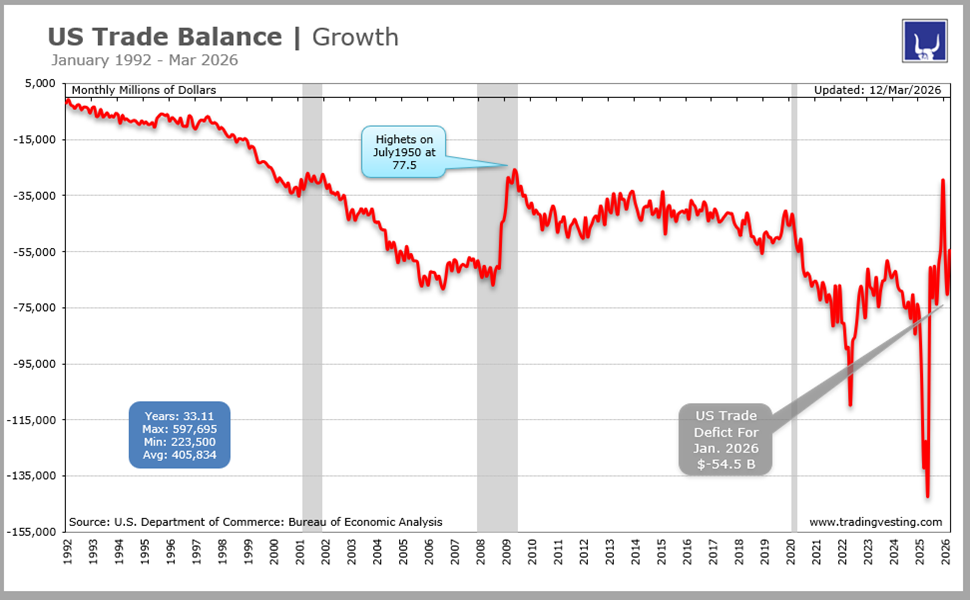
The international trade balance has posted a deficit almost continuously since the 1980s. Any trade deficit is a drag on U.S. GDP growth, but a smaller deficit adds to growth, while a larger deficit decreases GDP growth.

Interpreting the Rating for Trade Balance

A National Association for Business Economics forecasting panel has projected that the deficit for 2012 will narrow by 4.1% to $535.4 billion and will edge down further to $525 billion in 2013 as growth in exports keeps pace with import increases

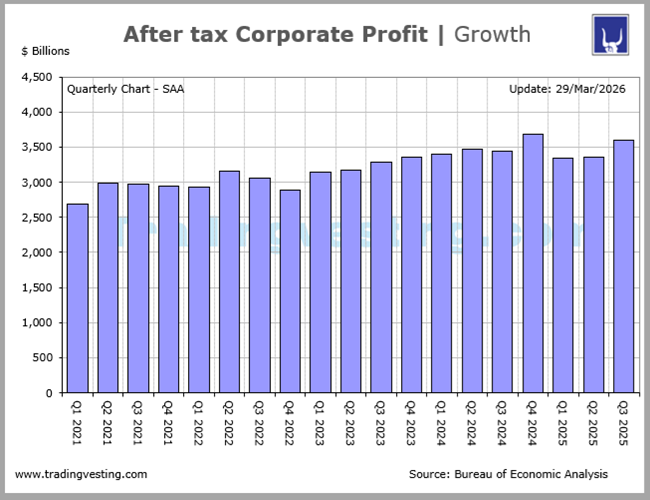
Consider this fact....Economic growth weakens when exports decline because factories tend to produce fewer goods. And U.S. companies earn less.

A wider trade deficit acts as a drag on growth because the U.S. is typically spending more on imports while taking in less from the sales of American-made goods. So, wat this moment we need Imports to decrease and Exports Decline means a Red Flag for our purposes...Negative View

What is the Trade Deficit?

The trade deficit is when the total goods and services the U.S. imports is greater than the total it exports.

In 2010, the total U.S. trade deficit was $497.9 billion. This was $1.8 trillion in exports minus $2.3 trillion in imports. This shows the economy is strengthening, since it is more than the $375 billion trade deficit in 2009. Still, it's much less than the record $759 billion trade deficit in 2006. A wider deficit can depress economic growth because it usually means fewer export-related jobs.
For the 2011, the U.S. deficit climbed to $588 billion, the highest level since 2008. Both exports and imports rose to all-time highs.

There are many causes of the steady growth in U.S. trade deficits. These include non-tariff barriers to U.S. exports in a number of key foreign markets, and export-led growth strategies in many countries that target American markets because they are the largest and are more open than many others. Macroeconomic factors such as the over-valuation of the U.S. dollar and slow growth abroad have also played important roles in the 1990s, and especially in the past few years. Perhaps most important is a pattern of neglect of the American industrial structure by the federal government.

Since the 1970s the U.S. moved from a trade surplus to a deficit position, as Europe and Japan began to compete effectively with the U.S. in a range of industries. The trade surplus of the 1960s was transformed into a deficit that reached 2.9% of GDP in 1998, as shown in Figure 1. This deficit will grow rapidly in the future as a result of the continuing global financial crisis. Although financial markets are beginning to recover throughout the world, the real economies of many developing countries and Japan remain mired in recessions.the steady growth in our trade deficits over the past two decades has eliminated millions of U.S. manufacturing jobs.

Balance of Payments

The Balance of Payment records in detail how one country interacts with others in the international economy - tracking the purchase, sale and transfer of goods, services and capital investments.

The forces that affect a country's balance of payments give deep insight into the broader picture of demand and supply for that country's currency. With impact on economic and political developments. The Balance of Payments is affected by several component reports detailed below.

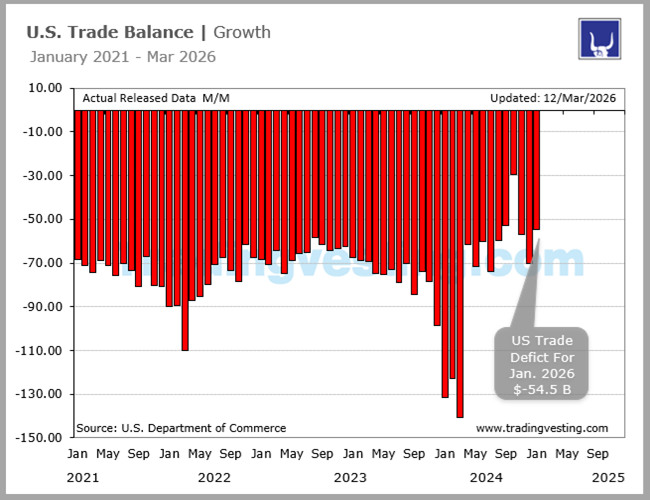
The U.S. trade deficit widened : as American exports declined and imports increase

Exports grow when foreign economies are strong. The weaker the foreign exchange value of the dollar, the less expensive goods and services are to foreigners, and this also helps spurt export activity. Imports grow when U.S. economic growth is robust. Imports are also spurred by a strong foreign exchange value of the dollar.

Why an Ongoing Trade Deficit Weakens the Economy

An ongoing trade deficit is detrimental to the nation's economy over the long term because it is financed with debt. In other words, the U.S. can buy more than it makes because the countries that it buys from are lending it the money. It is like a party where you've run out of money, but the pizza place is willing to keep sending you pizzas and put it on your tab. Of course, this can only go on as long as there are no other customers for the pizza, and the pizza place can afford to loan you the money. One day the lending countries may decide to ask the U.S. to repay the debt. On that day, the party is over.

How the Dollar Decline Affects the Trade Deficit:

The dollar declined 40% against the euro in the last six years. This means that U.S. goods and services are 40% cheaper for Europeans, which makes U.S. companies more competitive, and increases exports. However, the recession offset this advantage, so that exports declined - from $1.8 trillion in 2008 to $1.5 trillion in 2009. The recession also lowered imports, which dropped from $2.3 trillion in 2007 to $1.6 in 2009.

OIL

Keep in mind that oil is priced in dollars. As the dollar declines, OPEC increases prices to maintain its revenue. The U.S. reliance on oil means it will be difficult to escape its trade deficit.

The U.S. Could Be Losing Its Competitiveness:

A third concern about the trade deficit is the statement it makes about the competitiveness of the U.S. economy itself. By purchasing goods overseas for a long enough period of time, U.S. companies lose the expertise and even the factories to make those products. Try finding a pair of shoes made in the America. As the U.S. loses competitiveness, it has even lower quality jobs and the standard of living decline.

The reasoning is simple: Taking as much as 4% out of our gross domestic product will push the economy back into recession. And when the economy tumbles, the government takes in less tax revenues and has to spend more on social programs like unemployment insurance, food stamps, welfare and the like.

Now you don't have to be a rocket scientist to conclude that less revenues and more spending increases the deficit: not the other way around.

         
Top of Page
       
Tradingvesting.com   Data | Source USA US Trade in Goods (Adv) | Growth   Today's Week Today's Week
         
Related Links
Global View  
  Construction Spending  
  Corporate Profits  
  US Trade Balance  
  US Trade in Goods  
  Current Account  
 
DATA INFORMATION US TRADE BALANCE
SOURCE Bureau of Economic Analysis (BEA), U.S. Department of Commerce.
WEB www.bea.gov
FREQUENCY Quarterly
AVAILABILITY Usually during the fourth week of the month.
COVERAGE Data are for the previous quarter.
REVISIONS Yes
IMPORTANCE Growth - Very Important
         
Top of Page
     
Interest Rates
Interest Rates
Meetings
Minutes
Beige Book
Growth
Growth
GDP
US Balance
Spending
Inflation
Growth
CPI
Core PCE
PPI
Employment
Employment
Payroll
Rate
ADP
Manufacturing
Manufacturing
ISM Mfg
Industrial
Factory
Real Estate
Real Estate
Starts
Permits
Shiller
stock market, online trading, ETF, portfolio, dividends, crypto, day trading, shares, how to start investing, broker, day trading, IPO, bull market, bear market, how to invest, margin account, futures, stock market today, stock market futures, investing, stock signals, stock alerts, stockmarket, alerts
 
 
Portfolio | 52-Weeks | Global | Trend500 | Top News | Reports | Charts | Indexes | Today
Vix | Oil | ETFs | Stocks | Futures | 10-Year | S&P 500 | Markets | Register
About | Contact | Log-in | Register | WeDo | Times | Links
Disclaimer | Risk Disclosure | Calendar
 
  Tradingvesting.com | Trading and Investing   You can follow us at: YouTube Twitter
 
All Rights Reserved | www.tradingvesting.com | © Copyright 2008
Discipline - Confidence - Patience