|
 |
|
 |
Corporate Profits | Growth |
|
 |
|
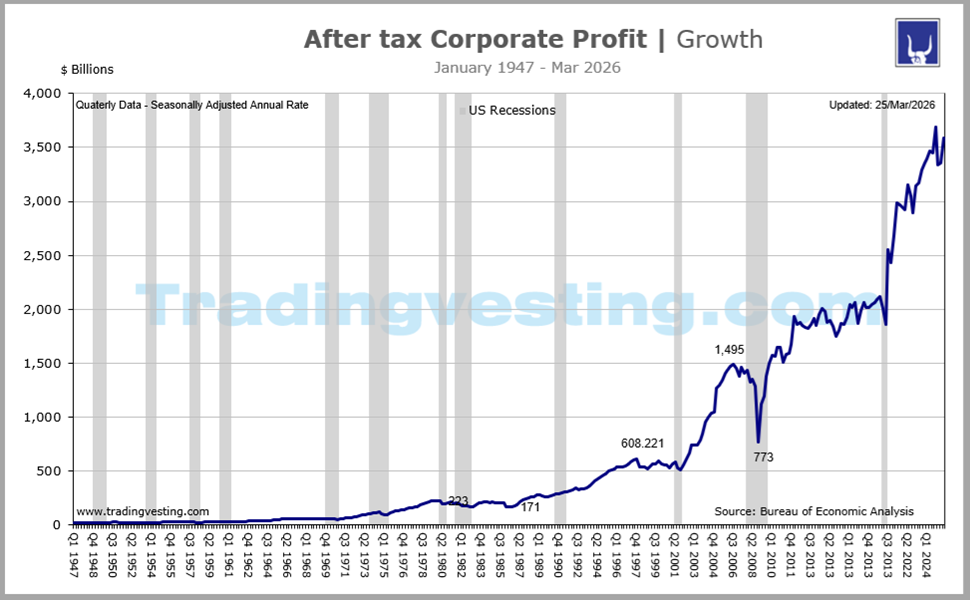
Corporate profit is the money left over after a corporation pays all of its expenses. When profits are strong, then companies will be able to increase their capital spending.It is with and without Inventory & Consumption Adjustments.. Read More...
|
|
|
|
|
|
|
| |
|
| |
 5. Corporate Profit (5 of 6) 5. Corporate Profit (5 of 6) 6. Current Account (6 of 6) 6. Current Account (6 of 6) 1. Real GDP (1 of 6) 1. Real GDP (1 of 6) 2. US Trade Balance (2 of 6) 2. US Trade Balance (2 of 6) 3. US Trade in Goods (3 of 6) 3. US Trade in Goods (3 of 6) 4. Construction Spending (4 of 6) 4. Construction Spending (4 of 6)
|
 |
|
|
|
|
| |
|
→ Big Chart |
|
→ Release |
|
| |
|
|
|
|
|
|
|
|
|
|
|
|
|
|
|
|
|
|
|
 |
|
Big Chart | Large Data |
 |
|
Corporate Profits| Growth |
|
Today's Week |
 |
|
|
|
|
|
|
|
|
|
|
|
|
|
| |
|
|
|
|
|
|
|
|
|
|
|
|
|
| |
|
https://fred.stlouisfed.org/series/CPATAX# |
|
|
|
|
|
|
|
|
|
|
|
|
|
|
|
|
|
|
|
Release Schedule | 2026 |
|
|
Corporate Profits| Growth |
|
Today's Week |
|
|
|
|
|
|
|
|
|
|
|
|
|
Corporate Profits (At 8:30 a.m ET)
| SCHEDULE 2026 |
No 1 |
No 2 |
No 3 |
No 4 |
No 5 |
No 6 |
No 7 |
| Release | Week |
|
|
|
|
|
|
|
| Release | Date |
|
|
|
|
|
|
|
| Release | Day |
|
|
|
|
|
|
|
 |
|
|
|
|
|
|
|
| CP - Without IVA and CCAdj |
No 1 |
No 2 |
No 3 |
No 4 |
No 5 |
No 6 |
No 7 |
| After Tax Y/Y Prior: |
4.3% |
... |
... |
... |
... |
... |
... |
| After Tax Y/Y Prior rev: |
4.7% |
... |
... |
... |
... |
... |
... |
| After Tax Y/Y: (% Change from Year Ago) |
5.7% |
... |
... |
... |
... |
... |
... |
|
|
|
|
|
|
|
|
| CP - With IVA and CCAdj |
No 1 |
No 2 |
No 3 |
No 4 |
No 5 |
No 6 |
No 7 |
| With IVA and Cons Adj Prior Y/Y: |
10.8% |
... |
... |
... |
... |
... |
... |
| With IVA and Cons Adj Prior Y/Y: Rev: |
4.5% |
... |
... |
... |
... |
... |
... |
| CP - After Tax IVA and CCAdj (% Change) |
6.0% |
... |
... |
... |
... |
... |
... |
| Quarter for: |
Q4-2025 |
Q1 -2025 |
Q1 -2026 |
Q2 -2026 |
Q2 -2026 |
Q3 -2026 |
Q3 -2026 |
| Type: |
... |
Preliminary |
Revised |
Preliminary |
Revised |
Preliminary |
Revised |
| RATING WITH: |
|
|
|
|
|
|
|
|
|
|
|
|
|
|
|
|
|
| |
|
| |
| |
|
|
|
|
|
|
|
|
|
|
|
|
|
|
|
Release Schedule | 2025 |
|
|
Corporate Profits| Growth |
|
Today's Week |
|
|
|
|
|
|
|
|
|
|
|
|
|
Corporate Profits (At 8:30 a.m ET)
| SCHEDULE 2025 |
No 1 |
No 2 |
No 3 |
No 4 |
No 5 |
No 6 |
No 7 |
| Release | Week |
|
|
|
|
|
|
|
| Release | Date |
|
|
|
|
|
|
|
| Release | Day |
|
|
|
|
|
|
|
|
|
|
|
|
|
|
|
| CP - Without IVA and CCAdj |
No 1 |
No 2 |
No 3 |
No 4 |
No 5 |
No 6 |
No 7 |
| After Tax Y/Y Prior: |
9.2% |
12.1% |
8.4% |
8.7% |
7.0% |
4.8% |
2.4% |
| After Tax Y/Y: (% Change from Year Ago) |
12.1% |
8.4% |
8.7% |
7.0% |
-3.3% |
2.4% |
4.3% |
|
|
|
|
|
|
|
|
| CP - With IVA and CCAdj |
No 1 |
No 2 |
No 3 |
No 4 |
No 5 |
No 6 |
No 5 |
| With IVA and Cons Adj Prior Y/Y: |
5.9% |
5.9% |
5.1% |
5.5% |
4.0% |
.... |
10.5% |
| CP - After Tax IVA and CCAdj (% Change) |
5.9% |
5.1% |
5.5% |
4.0% |
4.8% |
... |
10.8% |
| Quarter for: |
Q4-2024 |
Q1 -2025 |
Q1 -2025 |
Q2 -2025 |
Q2 -2025 |
Q3 -2025 |
Q3 -2025 |
| Type: |
... |
Preliminary |
Revised |
Preliminary |
Revised |
Preliminary |
Final |
| RATING WITH: |
|
|
|
|
|
|
|
|
|
|
|
|
|
|
|
|
|
| |
|
| |
|
|
|
|
|
|
|
|
|
|
|
Release Schedule | 2024 |
|
|
Corporate Profits| Growth |
|
Today's Week |
|
|
|
|
|
|
|
|
|
|
|
|
|
Corporate Profits (At 8:30 a.m ET)
| SCHEDULE 2024 |
No 1 |
No 2 |
No 3 |
No 4 |
No 5 |
No 6 |
No 7 |
| Release | Week |
|
|
|
|
|
|
|
| Release | Date |
|
|
|
|
|
|
|
| Release | Day |
|
|
|
|
|
|
|
|
|
|
|
|
|
|
|
| WITHOUT IVENTORY AND CONS ADJ |
No 1 |
No 2 |
No 3 |
No 4 |
No 5 |
No 6 |
No 7 |
| After Tax Y/Y Prior: |
0.1% |
8.6% |
10.9% |
10.0% |
11.2% |
14.2% |
5.0% |
| After Tax Y/Y: |
8.6% |
10.9% |
10.0% |
11.2% |
14.2% |
5.0% |
9.2% |
|
|
|
|
|
|
|
|
| WITH IVENTORY AND CONS ADJ |
No 1 |
No 2 |
No 3 |
No 4 |
No 5 |
No 6 |
No 7 |
| With IVA and Cons Adj Prior Y/Y: |
-2.1% |
3.8% |
6.4% |
5.3% |
6.6% |
10.8% |
6.4% |
| With IVA and Consumption Adj Y/Y: |
3.8% |
6.4% |
5.3% |
6.6% |
10.8% |
6.4% |
5.9% |
| Quarter for: |
Q4-2023 |
Q1 -2024 |
Q1 -2024 |
Q2 -2024 |
Q2 -2024 |
Q3 -2024 |
Q3 -2024 |
| Type: |
... |
Preliminary |
Revised |
Preliminary |
Revised |
Preliminary |
Revised |
| RATING WITH: |
|
|
|
|
|
|
|
|
|
|
|
|
|
|
|
|
|
| |
|
| |
|
|
|
|
|
|
|
|
|
|
|
Release Schedule | 2023 |
|
|
Corporate Profits| Growth |
|
Today's Week |
|
|
|
|
|
|
|
|
|
|
|
|
|
Corporate Profits (At 8:30 a.m ET)
| SCHEDULE 2023 |
No 1 |
No 2 |
No 3 |
No 4 |
No 5 |
No 6 |
No 7 |
| Release | Week |
|
|
|
|
|
|
|
| Release | Date |
|
|
|
|
|
|
|
| Release | Day |
|
|
|
|
|
|
|
|
|
|
|
|
|
|
|
| WITHOUT IVENTORY AND CONS ADJ |
No 1 |
No 2 |
No 3 |
No 4 |
No 5 |
No 6 |
No 7 |
| After Tax Y/Y Prior: |
2.3% |
-1.4% |
-6.0% |
-5.1% |
-9.4% |
-7.8% |
0.5% |
| After Tax Y/Y: |
-1.4% |
-6.0% |
-5.1% |
-9.4% |
-7.8% |
0.5% |
0.1% |
|
|
|
|
|
|
|
|
| WITH IVENTORY AND CONS ADJ |
No 1 |
No 2 |
No 3 |
No 4 |
No 5 |
No 6 |
No 7 |
| With IVA and Cons Adj Prior Y/Y: |
3.3% |
1.6% |
-2.8% |
-1.9% |
-6.2% |
-4.1% |
-1.7% |
| With Inventory and ConsAdj Y/Y: |
1.6% |
-2.8% |
-1.9% |
-6.2% |
-4.1% |
-1.7% |
-2.1% |
| Quarter for: |
Q4-2022 |
Q1(p)-23 |
Q1(r)-23 |
Q2(p)-23 |
Q2(r)-23 |
Q3(p)-23 |
Q3(r)-23 |
| Type: |
Final |
Preliminary |
Final |
Preliminary |
Final |
Preliminary |
Final |
| RATING: |
|
|
|
|
|
|
|
|
|
|
|
|
|
|
|
|
|
| |
|
| |
|
|
|
|
|
|
|
|
|
|
|
Release Schedule | 2022 |
|
|
Corporate Profits| Growth |
|
Today's Week |
|
|
|
|
|
|
|
|
|
|
|
|
|
Corporate Profits (At 8:30 a.m ET)
| SCHEDULE 2022 |
No 1 |
No 2 |
No 3 |
No 4 |
No 5 |
No 6 |
No 7 |
| Release | Week |
|
|
|
|
|
|
|
| Release | Date |
|
|
|
|
|
|
|
| Release | Day |
|
|
|
|
|
|
|
|
|
|
|
|
|
|
|
| Quarter for: |
Q4-2021 |
Q1-2022 |
Q1-2022 |
Q2-2022 |
Q2-2022 |
Q3-2022 |
Q3-2022 |
| Type: |
Preliminary |
Final |
Preliminary |
Final |
Preliminary |
Final |
Preliminary |
| Prior Y/Y: |
26.7% |
24.8% |
15.7% |
15.2% |
11.9% |
7.7% |
1.3% |
| Prior Revised: |
... |
... |
... |
... |
... |
... |
7.4% |
| After Tax Y/Y: |
24.8% |
15.7% |
15.2% |
11.9% |
7.7% |
1.3% |
3.5% |
|
|
|
|
|
|
|
|
| With Inventory Prior Y/Y: |
18.2% |
19.7% |
9.5% |
8.8% |
7.4% |
7.7% |
2.5% |
| With inventory: |
19.7% |
9.5% |
8.8% |
7.4% |
7.7% |
2.5% |
2.3% |
| RATING: |
|
|
|
|
|
|
|
|
|
|
|
|
|
|
|
|
|
| |
|
| |
|
|
|
|
|
|
|
|
|
|
|
Release Schedule | 2021 |
|
|
Corporate Profits| Growth |
|
Today's Week |
|
|
|
|
|
|
|
|
|
|
|
|
|
Corporate Profits (At 8:30 a.m ET)
| SCHEDULE 2021 |
No 1 |
No 2 |
No 3 |
No 4 |
No 5 |
No 6 |
No 7 |
| Release | Week |
|
|
|
|
|
|
|
| Release | Date |
|
|
|
|
|
|
|
| Release | Day |
|
|
|
|
|
|
|
|
|
|
|
|
|
|
|
| Quarter for: |
Q4-2020 |
Q1-2021 |
Q1-2021 |
Q2-2021 |
Q2-2021 |
Q3-2021 |
Q3-2021 |
| Type: |
Final |
Preliminary |
Final |
Preliminary |
Final |
Preliminary |
Final |
| Prior Y/Y: |
10.3% |
4.1% |
25.2% |
28.1% |
69.3% |
70.5% |
27.6% |
| Prior Revised: |
... |
... |
... |
36.1% |
... |
... |
... |
| After Tax Y/Y: |
4.1% |
25.2% |
28.3% |
69.3% |
70.5% |
27.6% |
31.0% |
| RATING: |
|
|
|
|
|
|
|
|
|
|
|
|
|
|
|
|
|
| |
|
|
| |
|
|
|
|
|
|
|
|
|
|
|
|
Corporate Profits (At 8:30 a.m ET)
| DATE/WEEK |
HIGHLIGHTS |
FOR |
ACTUAL |
|
Profits |
No 7 |
... |
|
Q3(r)2026 |
|
| |
|
|
|
Profits |
No 6 |
... |
|
Q3(P)2026 |
|
| |
|
|
|
Profits |
No 5 |
... |
|
Q2(r)2026 |
|
| |
|
|
|
Profits |
No 4 |
... |
|
Q2(p)2026 |
|
| |
|
|
|
Profits |
No 3 |
... |
|
Q1(r)2026 |
|
| |
|
|
|
Profits |
No 2 |
... |
|
Q1(p)2026 |
|
| |
|
|
|
Profits |
No 1 |
... |
|
Q4-2025 |
|
| |
|
|
|
|
|
|
|
|
| |
|
|
|
|
|
| |
|
|
|
|
|
|
Corporate Profits (At 8:30 a.m ET)
| DATE/WEEK |
HIGHLIGHTS |
FOR |
ACTUAL |
|
Profits |
No 7 |
4.3% |
|
Q3(r)2025 |
|
| |
|
|
|
Profits |
No 6 |
2.4% |
|
Q3(P)2025 |
|
| |
|
|
|
Corporate Profits in Nonfinancial Industries Plunge by Most Ever in $, amid Massive Downward Revisions. The measure of corporate profits here are pre-tax profits “from current production” (more on what that means in a moment) by businesses of all sizes that have to file corporate tax returns, including LLCs and S corporations, plus some organizations that do not file corporate tax returns. The data are not based on surveys but on administrative data, such as corporate tax data from the IRS and from financial statements filed with the SEC. Corporate profits in the United States fell by 3.3% from the previous period to $3.204 trillion in the first quarter of 2025. |
No 5 |
-3.3% |
|
Q2(r)2025 |
|
| |
|
|
|
The BEA also reported that profits from current production with inventory valuation and capital consumption adjustments rebounded $65.5 billion last quarter, despite tariffs raising costs for businesses. Profits decreased $90.6 billion in the January-March period.US corporate profits rebounded in the second quarter, but tariffs on imports are raising costs for businesses, which could limit further gains and hamper economic growth. Profits from current production with inventory valuation and capital consumption adjustments increased $65.5 billion last quarter, the Commerce Department's Bureau of Economic Analysis (BEA) said today. Profits had decreased by $90.6 billion in the January-March period. |
No 4 |
7.0% |
|
Q2(p)2025 |
|
| |
|
|
|
US Corporate Profits Fall Less than Initially Thought.. Profits from current production (corporate profits with inventory valuation and capital consumption adjustments) decreased $90.6 billion in the first quarter, an upward revision of $27.5 billion. |
No 3 |
8.7% |
|
Q1(r)2025 |
|
| |
|
|
|
U.S. corporate profits fell sharply in the first quarter and could continue to be squeezed this year by higher costs from tariffs that are threatening to undercut the economic expansion. Profits from current production with inventory valuation and capital consumption adjustments dropped $118.1 billion last quarter, the Commerce Department's Bureau of Economic Analysis (BEA) said on Thursday. Profits surged $204.7 billion in the October-December quarter. |
No 2 |
8.4% |
|
Q1(p)2025 |
|
| |
|
|
|
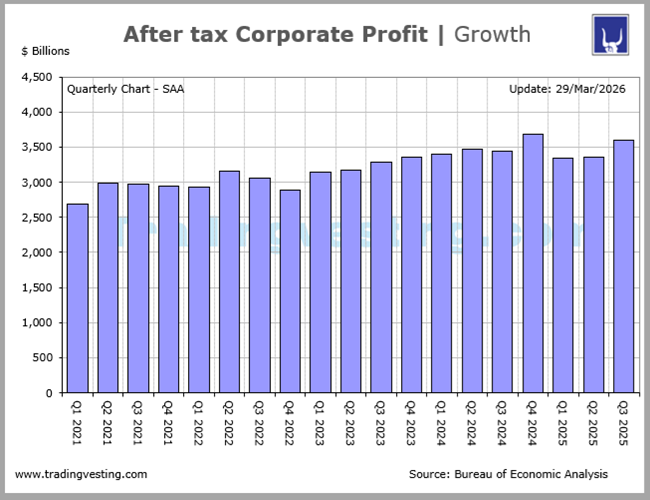
Corporate profits hit record high as economy boomed in fourth quarter of 2023. Adjusted profits after taxes hit a record high of $2.8 trillion, beating the record of $2.7 trillion in the third quarter of 2022. Profits increased 3.9 percent on the quarter, above expectations of around 3.3 percent. Corporate profits smashed expectations in the fourth quarter of 2023 as the knock-on effects of pandemic stimulus juiced the U.S. economy. |
No 1 |
12.1% |
|
Q4-2024 |
|
| |
|
|
|
|
|
|
|
|
| |
|
|
|
|
|
| |
|
|
|
|
|
|
Corporate Profits (At 8:30 a.m ET)
| DATE/WEEK |
HIGHLIGHTS |
FOR |
ACTUAL |
|
Real gross domestic income (GDI) increased 2.1 percent in the third quarter, a downward revision of 0.1 percentage point from the previous estimate. The average of real GDP and real GDI, a supplemental measure of U.S. economic activity that equally weights GDP and GDI, increased 2.6 percent in the third quarter, an upward revision of 0.1 percentage point from the previous estimate. Profits from current production (corporate profits with inventory valuation and capital consumption adjustments) decreased $15.0 billion in the third quarter 2024, a downward revision of $4.9 billion from the previous estimate. Profits of domestic financial corporations increased $3.0 billion in the third quarter, an upward revision of $5.6 billion from the previous estimate. Profits of domestic nonfinancial corporations increased $24.9 billion, a downward revision of $5.9 billion. Rest-of-the-world profits decreased $42.9 billion, a downward revision of $4.6 billion. Receipts decreased $61.5 billion, and payments decreased $18.7 billion. |
No 7 |
9.2% |
|
2024 |
|
| |
|
|
|
Corporate profits Preliminary for Q3-2024, meanwhile, fell by 0.3% in the third quarter after a 3.6% gain in the second quarter. |
No 6 |
5.0% |
|
2024 |
|
| |
|
|
|
US economic growth, corporate profits revised higher in 2023. The U.S. economy grew faster than initially thought in 2023 amid upgrades to business investment and consumer spending despite hefty interest rate increases from the Federal Reserve, revised government data showed on Thursday. The annual benchmark revision from the Commerce Department's Bureau of Economic Analysis (BEA), the government agency that constructs the gross domestic product report, also showed a sharp upward revision to corporate profits last year. Revisions to inflation were minor, while the saving rate was raised. Corporate profits were sharply revised up by $288.5 billion, or 8.9%, in 2023. Companies have enjoyed greater pricing power amid rising inflation. The upbeat outlook on the economy was underscored by other data today showing corporate profits increased at a more robust pace than initially thought in the second quarter. Strong profit growth should help to underpin the labor market and potentially shield the economy from a recession. The economy’s resilience could make it harder for the Federal Reserve to deliver another 50 basis points interest rate cut in November as some investors are hoping. corporate profits including inventory valuation and capital consumption adjustments increased at a $132.5 billion annualized rate in the second quarter. |
No 5 |
14.2% |
|
2024 |
|
| |
|
|
|
Corporate profits in the US rose by 1.73% from the previous period to $2,774 trillion in the second quarter of 2024, rebounding from the 2.72% decline in the earlier quarter, according to a preliminary estimate. The rebound was led by the bounce in undistributed profits (5.6% vs -11.6% in Q1) amid the recovery for net cash flow with inventory valuation adjustment (3.3% vs -2.9%). |
No 4 |
1.73% |
|
2024 |
|
| |
|
|
|
At an annualized rate of $3.168 trillion, year-over-year after-tax corporate profits rose a very sizable 10.0 percent in the first quarter compared to last year's first quarter (revised down from an initial 10.9 percent). When including inventory valuation and consumption adjustments, after-tax profits of $2.727 trillion in the first quarter were up 5.3 percent on the year (revised from 6.4 percent); taxes on corporate income, at a hefty $640.3 billion annual rate in the first quarter and which are calculated on this basis, were up a year-over-year 11.1 percent (revised up from 10.8 percent) |
No 3 |
-2.72% |
|
2024 |
|
| |
|
|
|
Corportae Profits After Tax without IVA and CCAdj) USD 3,096.32 B . From 8.6% to 10.90% year over year. Corportae Profits After Tax WITH inventories t Inventory & Consumption Adjustments USD 2,803 B . From 3.8% to 6.4% year over year. And 3.90% from Month to Month WITH inventories t Inventory. |
No 2 |
3.90% |
|
2024 |
|
| |
|
|
|
Corporate profits hit record high as economy boomed in fourth quarter of 2023. Adjusted profits after taxes hit a record high of $2.8 trillion, beating the record of $2.7 trillion in the third quarter of 2022. Profits increased 3.69 percent on the quarter, above expectations of around 3.3 percent. Corporate profits smashed expectations in the fourth quarter of 2023 as the knock-on effects of pandemic stimulus juiced the U.S. economy. |
No 1 |
3.69% |
|
2024 |
|
| |
|
|
|
|
|
|
|
|
| |
|
|
|
|
|
| |
|
|
|
|
|
|
Corporate Profits (At 8:30 a.m ET)
| DATE/WEEK |
HIGHLIGHTS |
FOR |
ACTUAL |
|
the government confirmed that economic growth accelerated in the third quarter. Gross domestic product increased at a 4.9% annualized rate last quarter, revised down from the previously reported 5.2% pace, the Commerce Department's Bureau of Economic Analysis (BEA) said in its third estimate of third-quarter GDP. It was still the fastest pace of expansion since the fourth quarter of 2021. Economists had expected GDP growth would be unrevised. The economy, which grew at a 2.1% rate in the second quarter, has been expanding at a pace far above what Fed officials regard as the non-inflationary growth rate of around 1.8%. The downward revision to GDP growth last quarter reflected downgrades to consumer spending and inventory investment. Growth in consumer spending, which accounts for more than two-thirds of U.S. economic activity, was trimmed to a still-lofty 3.1% rate from the previously estimated 3.6% pace. That was largely the result of a downward revision to spending on international travel. The increase in private inventory investment was lowered to a $77.8 billion pace from the previously reported $83.9 billion rate, mostly reflecting downgrades to stocks at general merchandise and other retail stores. Profits from current production increased $108.7 billion in the third quarter, revised up $3.0 billion from the previous estimate. Strong profits are good news for the sustainability of the economic expansion.
|
No 7 |
... |
|
2023 |
|
| |
|
|
|
Corporate profits have been trending down. That’s what the Federal Reserve wants to see. The latest numbers from the U.S. Bureau of Economic Analysis, out Wednesday, showed that total corporate profits in the third quarter grew 3.3% to an annualized rate of $3.28 trillion. That's just shy of the all-time peak of $3.3 trillion reached in Q3 2022. The rise in profits last quarter shows that U.S. companies have been able to adjust to the post-COVID operating environment, which includes higher wages and higher borrowing costs. Corporate profits increase 4.3%; saving rate raised. After-tax profits without inventory valuation and capital consumption adjustment, which correspond to S&P 500 profits, increased by $126.2 billion, or at a 4.3% rate. Profits rose at a 0.8% rate in the second quarter. The increase in profits occurred across domestic financial and non-financial corporations as well as from the rest of the world. |
No 6 |
... |
|
2023 |
|
| |
|
|
|
The government also revised GDP data from 2017. The economic picture was little changed from 2017 to 2022, with GDP growing at an average annual rate of 2.2%, up from the previously estimated 2.1% pace. The revisions also showed the economy performing much better when measured from the income side than previously reported. Some economists had seized on the gap between GDP and gross domestic income to argue that the economy was not as strong as the data suggested. Americans still have more savings accumulated during the COVID-19 pandemic than previously thought and corporate profits were also revised up.Upward revisions to recent data on corporate profits also are a favorable sign with respect to the durability of the expansion." |
No 5 |
14.2% |
|
2023 |
|
| |
|
|
|
US Corporate Profits Rise Again With Recession Fear Fading . Profits rose 4.5% in second quarter after year-long slide US corporate profits are on the rise again following four straight quarters of declines, according to government data out Wednesday. After-tax profits for nonfinancial firms rose 4.5% in the second quarter, a Bureau of Economic Analysis report on gross domestic product showed. Measured as a share of gross value added — a proxy for aggregate profit margins — they rose to 14.3% from 13.8%. |
No 4 |
1.73% |
|
2023 |
|
| |
|
|
|
Corporate profits not indicating changes in firms’ pricing strategies. The post-pandemic growth in corporate profits seen since the COVID-19 pandemic in countries other than Finland has been erroneously interpreted – also in Finland – as a signal of inflationary pressures generated by companies’ pricing strategies. The debate on the implications of corporate profits for inflation first emerged in the United States[1] and subsequently spread widely across Europe. The role of corporate profits in explaining inflation is a multifaceted issue and should therefore be analysed from various perspectives instead of using a single indicator alone. |
No 3 |
-2.72% |
|
2023 |
|
| |
|
|
|
Corporate profits from current production. Profits decreased 5.1 percent at a quarterly rate in the first quarter after decreasing 2.0 percent in the fourth quarter. Profits of domestic financial corporations decreased 6.3 percent after decreasing 12.8 percent. Profits of domestic nonfinancial corporations decreased 5.3 percent after decreasing 1.1 percent. Profits from the rest of the world (net) decreased 3.5 percent after increasing 4.8 percent. Corporate profits decreased 2.8 percent in the first quarter from one year ago. |
No 2 |
3.90% |
|
2023 |
|
| |
|
|
|
US Corporate Profits, Gross Domestic Income Fell at End of 2022. Profits slid 2% in the fourth quarter, the most in two years. GDI dropped 1.1% in contrast to a 2.6% increase in GDP. US corporate profits declined in the fourth quarter and a key gauge of economic activity stumbled as companies battled rising costs and softer demand against a backdrop of higher borrowing costs. Adjusted pretax corporate profits fell 2% in the final three months of 2022, the most in two years, according to Commerce Department figures published Thursday. Profits retreated at both domestic non-financial and financial corporations. From a year earlier, profits were up 2.6%. |
No 1 |
3.69% |
|
2023 |
|
| |
|
|
|
|
|
|
|
|
| |
|
|
|
|
|
| |
|
|
|
|
|
|
Corporate Profits (At 8:30 a.m ET)
| DATE/WEEK |
HIGHLIGHTS |
FOR |
ACTUAL |
|
Corporate earnings growth is expected to slow in the year ahead in many countries as higher inflation and rising interest rates take an even bigger toll and companies brace for the likelihood of a global economic downturn. U.S. companies are forecast to have the slowest full-year profit growth since 2020 and the start of the coronavirus pandemic. Some top equity strategists predict no profit growth or even a decline in earnings. |
No 7 |
3.5% |
|
Q3-2021F |
|
| |
|
|
|
Corporate profits probably won’t remain this high indefinitely, as wages rise over time and the possibility of a recession cut into consumer purchasing power.However, a range of economists mostly agreed that corporate profits aren’t necessarily driving inflation. Rather, they are almost certainly benefiting from it. Corporate profits do not drive inflation, but inflation boosts company profits |
No 6 |
|
|
Q3-2022P |
|
| |
|
|
|
Revisions showed GDI rebounding 5.5% in 2021, revised down from the previously published 7.3%. GDI contracted 2.3% in 2020 instead of 2.9% as initially estimated. The downward revision in 2021 reflected revisions to several components, including net interest income, private industry wages and salaries, proprietors income as well as corporate profits. |
No 5 |
7.7% |
|
Q2-2021F |
|
| |
|
|
|
National after-tax profits without inventory valuation and capital consumption adjustments, conceptually most similar to S&P 500 profits, increased $284.9 billion, or at a 10.4% pace, accelerating from the 1.0% growth pace in the January-March period. Profits were 11.9% higher from a year ago. The National Bureau of Economic Research, the official arbiter of recessions in the United States, defines a recession as "a significant decline in economic activity spread across the economy, lasting more than a few months, normally visible in production, employment, real income, and other indicators." |
No 4 |
|
|
Q2-2022P |
|
| |
|
|
|
While sky-high inflation has crunched budgets for essentials like gas and groceries, many large corporations have reported record profits, eliciting anger from some everyday people and public officials over price-gouging. Such frustration recently rose to the fore over eye-popping gas prices. Earlier this month, President Joe Biden sent a letter to major oil refinery companies accusing them of taking advantage of the market environment to reap profits while Americans struggle to afford gas. But economists disagree over the role that elevated corporate profits have played in driving inflation, as some say they account for more than half of the increase in prices while others say they have caused little or none of the hikes. Some who do blame corporate price-gouging for a portion of the price increases said it arises from market concentration that allows a handful of dominant companies in a given sector to raise prices without fear of competitors undercutting them with lower-priced alternatives. But others doubt that explanation, noting the unlikelihood that a major shift in corporate concentration took place over just a couple years amid the pandemic. |
No 3 |
15.2% |
|
Q1-2021F |
|
| |
|
|
|
US corporate profits fell in the first quarter by the most in almost two years as inflation promised greater costs for companies while the economy took a step back. Adjusted pre-tax corporate profits decreased an annualized 2.3% from the prior quarter and were up 12.5% from a year earlier, Commerce Department data showed Thursday. At the same time, one measure of profit margins edged higher. Faced with rising costs for materials, shipping and labor, many companies have sought to pass along those expenses to customers through higher selling prices. However, input costs keep rising, and consumers are grappling with decades-high inflation. In recent weeks, retailers like Target Corp. and Walmart Inc. cut their forecasts for profit this year amid bloated inventories and price increases that failed to keep up with rising costs. While companies report individual profits based on historical costs, the government adjusts the figures to reflect the current cost of replacing capital stock such as equipment and structures. Because of surging inflation, the current replacement costs are much higher.Excluding that adjustment, as well as one for inventory valuation, after-tax profits increased 1.5% in the first quarter from the end of 2021 and were up 15.7% from a year earlier. |
No 2 |
|
|
Q1-2022P |
|
| |
|
|
|
Profits Soar as U.S. Corporations Have Best Year Since 1950. Judging by the stock market, investors see more good times ahead for profits in 2022. U.S. corporate profits jump 25% in 2021 to record high as economy rebounds from pandemic. Corporate profits rose again in the fourth quarter to cap off a big increase in 2021 despite widespread supply and labor shortages that raised costs and contributed to high inflation.The numbers: U.S. corporate profits rose again in the fourth quarter and hit a record high, capping off a huge increase in 2021 despite widespread supply and labor shortages that raised costs and contributed to high inflation during the pandemic. Adjusted pretax profits rose 0.7% to an annualized $2.94 trillion in the final three months of last year from $2.92 trillion in the third quarter, the government said Wednesday. For the full year, adjusted profits leaped 25% -- the largest gain since 1976. Earnings fell in 2020 after the onset of the pandemic, marking the first decline in five years. The profit figures were released as part of the third and final regular update to gross domestic product for the fourth quarter. GDP rose a revised 6.9% in the fourth quarter, down a tick from the prior estimate of 7%. The U.S. economy's rapid recovery from the pandemic has padded the profits of most businesses, especially large ones that were better shielded from the effects of the virus. Although companies are paying higher costs, they've still managed to increase profits. Aa result, they have more money to invest and can afford to pay workers more. Wages are rising at the fastest pace in four decades. |
No 1 |
24.8% |
|
Q4-2021F |
|
| |
|
|
|
|
|
|
|
|
| |
|
|
|
|
|
| |
|
|
|
|
|
|
Corporate Profits (At 8:30 a.m ET)
| DATE/WEEK |
HIGHLIGHTS |
FOR |
ACTUAL |
|
US Corporate Profits Revised Lower in Q3. Corporate profits in the United States rose 3.4 percent to a fresh record high of USD 2.52 trillion in the third quarter of 2021, slowing from a 10.5 percent jump in the previous period and compared with preliminary estimates of 4.3 percent. Undistributed profits climbed 5.3 percent to $1.08 trillion and net cash flow with inventory valuation adjustment, the internal funds available to corporations for investment, increased 1.8 percent to $3.14 trillion. Also, net dividends increased 2.0 percent to $1.44 trillion |
No 7 |
|
|
Q32021F |
|
| |
|
|
|
US Corporate Profits Rise to All-Time High in Q3. Corporate profits in the United States rose 4.3 percent to a fresh record high of USD 2.54 trillion in the third quarter of 2021, slowing from a 10.5 percent jump in the previous period, a preliminary estimate showed. Undistributed profits climbed 7.3 percent to $1.10 trillion and net cash flow with inventory valuation adjustment, the internal funds available to corporations for investment, advanced 2.5 percent to $3.16 trillion. Also, net dividends increased 2.0 percent to $1.44 trillion |
No 6 |
27.6% |
|
Q3-2021P |
|
| |
|
|
|
US Corporate Profits Growth Revised Up in Q2. Corporate profits in the United States climbed 10.5% to a record high of USD 2.44 trillion in the second quarter of 2021, after rising 4.5% in the previous period and compared with a preliminary estimate of a 9.7% jump. Undistributed profits climbed 21.4% to $1.03 trillion and net cash flow with inventory valuation adjustment, the internal funds available to corporations for investment, advanced 7.9% to $3.08 trillion. Also, net dividends rose 3.8% to $1.41 trillion. |
No 5 |
|
|
Q2-2021F |
|
| |
|
|
|
U.S. corporate profits surged to a fresh record high in the second quarter, boosted by robust demand and higher prices, suggesting that an anticipated slowdown in economic growth this quarter because of soaring COVID-19 cases could be temporary. Profits from current production increased by $234.5 billion, or at a 9.2% quarterly rate, to a record $2.8 trillion, after rising at a 5.1% pace in the first quarter. They were driven by a $169.8 billion surge in profits at domestic nonfinancial corporations. There were also gains in domestic financial corporations profits as well as rest-of-the-world profits. Profits were up 69.3% from a year ago, partially exaggerated by low base comparisons in the second quarter of 2020 following mandatory shutdowns of nonessential businesses. |
No 4 |
69.3% |
|
Q2-2021P |
|
| |
|
|
|
US Corporate Profits Unexpectedly Rise in Q1. Corporate profits in the United States jumped 1.7 percent to USD 1,983.8 billion in the first quarter of 2021, after falling 3.3 percent in the previous period and compared with a preliminary estimate of a 0.8 percent drop. |
No 3 |
|
|
Q12021F |
|
| |
|
|
|
US Corporate Profits Fall in Q1. Corporate profits in the United States decreased 0.8 percent to USD 1.94 trillion in the first quarter of 2021, following a 3.3 percent drop in the previous period, a preliminary estimate showed. Net dividends declined 2.8 percent to USD 1.34 trillion. Meantime, net cash flow with inventory valuation adjustment, the internal funds available to corporations for investment, rose 1.8 percent to USD 2.59 trillion and undistributed profits climbed 4 percent to USD 0.60 trillion. |
No 2 |
25.2% |
|
Q1-2021P |
|
| |
|
|
|
US Corporate Profits Fall in Q4. Corporate profits in the United States decreased 3.3 percent to USD 1.95 trillion in the fourth quarter of 2020, down from a 27 percent jump in the previous period. Undistributed profits fell 14.5 percent to USD 0.58 trillion and net cash flow with inventory valuation adjustment, the internal funds available to corporations for investment, went down 2.9 percent to USD 2.54 trillion. Meanwhile, net dividends rose 2.3 percent to USD 1.37 trillion. |
No 1 |
|
|
Q4-2020F |
|
| |
|
|
|
|
|
|
|
|
| |
|
|
|
|
|
|
| |
|
|
|
|
|
|
|
|
|
|
|
|
|
|
|
|
|
|
|
|
|
Definitions | Explain |
|
|
Corporate Profits| Growth |
|
Today's Week |
|
|
|
|
|
|
|
|
|
|
|
|
| |
|
|
|
|
| |
|
| How the CORPORATE PROFITS Affects You? |
What is it?
Corporate profit is the money left over after a corporation pays all of its expenses. All of the money collected by a corporation during the reporting period from services rendered or sales of a product is considered top-line revenue. From revenue, a company will pay its expenses. Money left after expenses are paid is considered to be the company's profit.
Corporate profits are key in the determination of a company's stock price. Profits are after tax but without inventory valuation and capital consumption adjustments.
Corporate profits represents the portion of the total income earned from current production that is accounted for by U.S. corporations. It is one of the most closely watched U.S. economic indicators, as it provides a summary measure of corporate financial health and thus serves as an essential indicator of economic performance.
When corporate profits are rising, then stock prices will likely rise; when profits are falling, then equity prices will probably decline as well. Corporate profits are one of the more volatile series on a yearly basis. Profits are the residual - the left over - from revenues after expenses are taken out - and taxes for after-tax corporate profits. While each component (revenues, expenses, and taxes) is not that volatile, the net is.
A statistical metric produced by the Bureau of Economic Analysis which measures the net income of companies listed on the National Income and Product Accounts. The metric includes after-tax profits, profits from current activities and book profits.
Calculate
Determine the period for calculating corporate profits. Most companies report sales by quarter and by fiscal year. Let's say you want to calculate corporate profits for the most recent quarter. The process for calculating corporate profits is the same, however, regardless of the period used.
Determine the company's total revenue. This is total sales for the company. Let's say total sales for the previous quarter are $100,000.
Calculate gross profit. Determine the cost of goods sold (COGS) and subtract from total sales. The COGS is the cost of all materials and inventory used for the past quarter. Let's say the COGS is $50,000, so the calculation is $100,000 - $50,000 = $50,000.
Determine operating income. Subtract operating expenses from gross profit for operating income. If operating expenses are $5,000, the calculation is: $50,000 - $5,000 = $45,000.
Calculate corporate profits. Subtract taxes and interest expense (or income) from operating income. Let's say that taxes are $5,000 and interest expense is $1,000. The calculation is: Operating income - taxes - interest expense = X, or $45,000 - $5,000 - $1,000 = $39,000.
What's behind the rise in U.S. corporate profits?
Globalization, technological innovation, and supply chain efficiency explain the current resilience of U.S. corporate profits one of the few drivers of the U.S. economy at the moment.
The U.S. Department of Commerce recently reported that corporate profits (which includes both domestic and foreign profits) now make up the largest percentage of the country's gross domestic product (GDP) since the 1950s. This ratio currently stands at just under 13% of GDP, amounting to a total of US $1.9 trillion.
However, wage and salary disbursements have been slowly trending downward from 47% of GDP in 1985 to 44.4% in the second quarter of 2011. These trends seem to point to increased inequality between workers and managers, driven to some extent by the outsourcing of lower-skilled jobs to Asia.
For years, unemployed Americans have complained that even as companies have done so well, workers’ own fortunes have stagnated.
Like employment, corporate profits plummeted during the financial crisis; but unlike employment, profits bounced back almost as quickly as they had fallen. Then, in subsequent quarters, profits kept climbing and climbing, reaching record highs each month. Millions of workers sat on the sidelines, watching companies sit on mountains of cash rather than hire. Employers said economic uncertainty kept them from hiring, since they were concerned that the orders would stop rolling in.
Whether attributable to prescience or self-fulfilling prophecy, business has finally stagnated.
CP as % of GDP
U.S. domestic corporate profits defined as American corporations' profits generated from operations in the United States trended downward from the 1950s through the mid-1980s. But then that trend reversed, with profits experiencing wild swings during recession cycles. In the 1960s, domestic corporate profits were slightly less than 11.0% of GDP, falling to 7% by 1985.
Analysts have been amazed at the rate at which domestic corporate profits have been able to spring back following the "Great Recession" (December 2007 to June 2009). Indeed, domestic corporate profits as a percentage of GDP fell to their lowest point in over 60 years during the recession and then rebounded to their pre-recession levels in just over one year. .
A major game changer in the last couple of decades has been the increasing influence of foreign profits the profits U.S. corporations earn from overseas receipts.
In the mid-1960s, U.S. corporations were making approximately 6.5% of their profits from foreign operations, which translated to less than 1% of GDP. By the mid-1990s, foreign profits started playing a stronger role in overall corporate profitability.
Foreign profits are now slightly less than 4.3% of GDP up more than four-fold from the mid-1980s and American corporations now make 30% of their profits from foreign sources. |
|
|
| |
|
|
|
|
|
|
|
|
|
|
|
| |
|
|
|
|
|
|
| DATA INFORMATION |
CORPORATE PROFITS |
| SOURCE |
Bureau of Economic Analysis (BEA), U.S. Department of Commerce. |
| WEB |
www.bea.gov |
| FREQUENCY |
Quarterly |
| AVAILABILITY |
Usually during the fourth week of the month. |
| COVERAGE |
Data are for the previous quarter. |
| REVISIONS |
Yes |
| IMPORTANCE |
Growth - Very Important |
|
| |
|
|
|
|
|
|
|
|
|
|
|
|