|
|
 |
 |
 |
Portfolio Model Performance | 2026 |
|
 |
|
|
|
|
|
|
|
|
|
|
|
|
|
|
|
|
|
|
| |
1) Current Portfolio Model Holdings |
|
(As of April 12, 2026) |
|
|
|
|
|
|
|
|
|
| |
Type |
Ticker |
Description |
Since |
Days |
Allocation |
| |
1 |
Stock |
 |
AAPL |
Apple Inc (AAPL) |
24/Mar/2026 |
13 |
0% |
| |
2 |
Stock |
|
AMZN |
Amazon.com Inc (AMZN) |
24/Mar/2026 |
13 |
0% |
| |
3 |
Stock |
|
BA |
Boeing Company (BA) |
24/Mar/2026 |
13 |
0% |
| |
4 |
Stock |
|
NVDA |
NVIDIA Corporation (NVDA) |
24/Mar/2026 |
13 |
0% |
| |
5 |
ETF |
|
ACWI |
iShares MSCI ACWI (ACWI) |
24/Mar/2026 |
13 |
0% |
| |
6 |
ETF |
|
IVOO |
Vanguard S&P Mid-Cap 400 (IVOO) |
05/Jan/2026 |
91 |
0% |
| |
7 |
ETF |
|
IWM |
iShares Russell 2000 (IWM) |
16/Jan/2026 |
21 |
0% |
| |
8 |
ETF |
|
QQQ |
Invesco QQQ Trust (QQQ) |
16/Jan/2026 |
21 |
0% |
| |
9 |
ETF |
|
VOOG |
Vanguard S&P 500 Growth (VOOG) |
16/Jan/2026 |
7 |
0% |
| |
10 |
ETF |
|
XLF |
State Street Financial (XLF) |
24/Jan/2026 |
13 |
0% |
| |
11 |
ETF |
|
XLY |
State Street Consumer Discretionary (XLY) |
24/Jan/2026 |
13 |
0% |
| |
... |
Cash |
 |
... |
Liquidity Cash |
... |
... |
100% |
| |
|
→ Charts |
|
|
|
100% |
|
|
|
|
|
|
|
|
|
|
|
|
|
| |
|
|
|
| |
|
|
|
|
| 2026 |
Dates |
Allocation |
Tradingvesting.com | Portfolio |
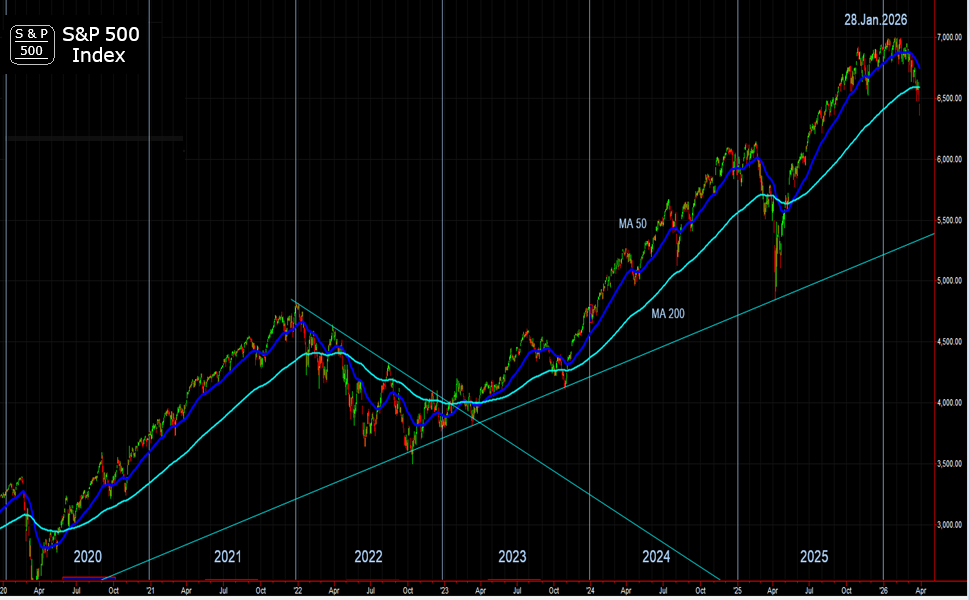
S&P 500 Index |
View |
| Week |
From |
To |
Stk |
ETF |
Cash |
End Week |
W/W |
W/W% |
YTD |
YTD% |
U/D |
%Chg |
Wk |
YTD |
Details |
|
02.Jan.26 |
05.Jan.06 |
0% |
0% |
0% |
$1,000,000 |
$0 |
0.00% |
$0 |
0% |
 |
-0.29% |
 |
-0.29% |
 |
|
05.Jan.26 |
11.Jan.26 |
11% |
89% |
0% |
$1,028,468 |
$28,466 |
2.85% |
$28,456 |
2.85% |
 |
1.07% |
|
1.28% |
|
|
12.Jan.26 |
18.Jan.26 |
12% |
88% |
0% |
$1,039,416 |
$10,948 |
1.09% |
$39,414 |
3.94% |
|
-0.06% |
|
0.90% |
|
|
19.Jan.26 |
25.Jan.26 |
11% |
88% |
0% |
$1,040,334 |
$918 |
0.09% |
$40,334 |
4.03% |
|
0.73% |
|
0.55% |
|
|
26.Jan.26 |
01.Feb.26 |
23% |
77% |
1% |
$1,059,040 |
$18,706 |
1.87% |
$59,040 |
5.90% |
|
0.18% |
|
0.84% |
|
|
02.Feb.26 |
08.Feb.26 |
23% |
76% |
1% |
$1,090,657 |
$31,616 |
3.16% |
$90,657 |
9.06% |
|
0.23% |
|
0.79% |
|
|
09.Feb.26 |
15.Feb.26 |
17% |
80% |
3% |
$1,098,844 |
$8,188 |
0.82% |
$98,844 |
9.88% |
|
-1.17% |
|
-0.61% |
|
|
16.Feb.26 |
22.Feb.26 |
17% |
80% |
3% |
$1,113,550 |
$14,705 |
1.47% |
$113,500 |
11.35% |
|
1.31% |
|
0.46% |
 |
|
23.Feb.26 |
01.Mar.26 |
15% |
81% |
4% |
$1,121,804 |
$8,255 |
0.83% |
$121,804 |
12.18% |
|
-0.32% |
|
0.01% |
|
|
02.Mar.26 |
08.Mar.26 |
15% |
81% |
4% |
$1,141,758 |
$19,953 |
2.00% |
$141,758 |
14.18% |
|
-1.24% |
|
-2.01% |
|
|
09.Mar.26 |
15.Mar.26 |
15% |
81% |
4% |
$1,181,096 |
$39,339 |
3.93% |
$181,096 |
18.11% |
|
-1.01% |
|
-3.58% |
|
|
16.Mar.26 |
22.Mar.26 |
15% |
80% |
4% |
$1,187,612 |
$6,516 |
0.65% |
$187,612 |
18.76% |
|
-2.52% |
|
-5.40% |
|
|
23.Mar.26 |
29.Mar.26 |
25% |
58% |
17% |
$1,180,281 |
-$7,331 |
-0.73% |
$181,096 |
18.03% |
|
-3.14% |
|
-7.41% |
|
|
30.Mar.26 |
05.Apr.26 |
18% |
75% |
0% |
$1,227,444 |
$47,163 |
4.72% |
$227,444 |
22.74% |
|
2.80% |
|
-4.30% |
|
|
06.Apr.26 |
12.Apr.26 |
0% |
0% |
100% |
$1,268,985 |
$41,541 |
4.04% |
$268,985 |
26.90% |
|
3.48% |
|
-0.89% |
|
|
13.Apr.26 |
19.Apr.26 |
|
|
|
... |
... |
... |
... |
... |
... |
... |
... |
... |
... |
|
20.Apr.26 |
26.Apr.26 |
|
|
|
... |
... |
... |
... |
... |
... |
... |
... |
... |
... |
|
27.Apr.26 |
03.May.26 |
|
|
|
... |
... |
... |
... |
... |
... |
... |
... |
... |
... |
|
04.May.26 |
10.May.26 |
|
|
|
... |
... |
... |
... |
... |
... |
... |
... |
... |
... |
|
11.May.26 |
17.May.26 |
|
|
|
... |
... |
... |
... |
... |
... |
... |
... |
... |
... |
|
18.May.26 |
24.May.26 |
|
|
|
... |
... |
... |
... |
... |
... |
... |
... |
... |
... |
|
25.May.26 |
31.May.26 |
|
|
|
... |
... |
... |
... |
... |
... |
... |
... |
... |
... |
|
01.Jun.26 |
07.Jun.26 |
|
|
|
... |
... |
... |
... |
... |
... |
... |
... |
... |
... |
|
08.Jun.26 |
14.Jun.26 |
|
|
|
... |
... |
... |
... |
... |
... |
... |
... |
... |
... |
|
15.Jun.26 |
21.Jun.26 |
|
|
|
... |
... |
... |
... |
... |
... |
... |
... |
... |
... |
|
22.Jun.26 |
28.Jun.26 |
|
|
|
... |
... |
... |
... |
... |
... |
... |
... |
... |
... |
|
29.Jun.26 |
05.Jul.26 |
|
|
|
... |
... |
... |
... |
... |
... |
... |
... |
... |
... |
|
06.Jul.26 |
12.Jul.26 |
|
|
|
... |
... |
... |
... |
... |
... |
... |
... |
... |
... |
|
13.Jul.26 |
19.Jul.26 |
|
|
|
... |
... |
... |
... |
... |
... |
... |
... |
... |
... |
|
20.Jul.26 |
26.Jul.26 |
|
|
|
... |
... |
... |
... |
... |
... |
... |
... |
... |
... |
|
27.Jul.26 |
02.Aug.26 |
|
|
|
... |
... |
... |
... |
... |
... |
... |
... |
... |
... |
|
03.Aug.26 |
09.Aug.26 |
|
|
|
... |
... |
... |
... |
... |
... |
... |
... |
... |
... |
|
10.Aug.26 |
16.Aug.26 |
|
|
|
... |
... |
... |
... |
... |
... |
... |
... |
... |
... |
|
17.Aug.26 |
23.Aug.26 |
|
|
|
... |
... |
... |
... |
... |
... |
... |
... |
... |
... |
|
24.Aug.26 |
30.Aug.26 |
|
|
|
... |
... |
... |
... |
... |
... |
... |
... |
... |
... |
|
31.Aug.26 |
06.Sep.26 |
|
|
|
... |
... |
... |
... |
... |
... |
... |
... |
... |
... |
|
07.Sep.26 |
13.Sep.26 |
|
|
|
... |
... |
... |
... |
... |
... |
... |
... |
... |
... |
|
14.Sep.26 |
20.Sep.26 |
|
|
|
... |
... |
... |
... |
... |
... |
... |
... |
... |
... |
|
21.Sep.26 |
27.Sep.26 |
|
|
|
... |
... |
... |
... |
... |
... |
... |
... |
... |
... |
|
28.Sep.26 |
04.Oct.26 |
|
|
|
... |
... |
... |
... |
... |
... |
... |
... |
... |
... |
|
05.Oct.26 |
11.Oct.26 |
|
|
|
... |
... |
... |
... |
... |
... |
... |
... |
... |
... |
|
12.Oct.26 |
18.Oct.26 |
|
|
|
... |
... |
... |
... |
... |
... |
... |
... |
... |
... |
|
19.Oct.26 |
25.Oct.26 |
|
|
|
... |
... |
... |
... |
... |
... |
... |
... |
... |
... |
|
26.Oct.26 |
01.Nov.26 |
|
|
|
... |
... |
... |
... |
... |
... |
... |
... |
... |
... |
|
02.Nov.26 |
08.Nov.26 |
|
|
|
... |
... |
... |
... |
... |
... |
... |
... |
... |
... |
|
09.Nov.26 |
15.Nov.26 |
|
|
|
... |
... |
... |
... |
... |
... |
... |
... |
... |
... |
|
16.Nov.26 |
22.Nov.26 |
|
|
|
... |
... |
... |
... |
... |
... |
... |
... |
... |
... |
|
23.Nov.26 |
29.Nov.26 |
|
|
|
... |
... |
... |
... |
... |
... |
... |
... |
... |
... |
|
30.Nov.26 |
06.Dec.26 |
|
|
|
... |
... |
... |
... |
... |
... |
... |
... |
... |
... |
|
07.Dec.26 |
13.Dec.26 |
|
|
|
... |
... |
... |
... |
... |
... |
... |
... |
... |
... |
|
14.Dec.26 |
20.Dec.26 |
|
|
|
... |
... |
... |
... |
... |
... |
... |
... |
... |
... |
|
21.Dec.26 |
27.Dec.26 |
|
|
|
... |
... |
... |
... |
... |
... |
... |
... |
... |
... |
|
28.Dec.26 |
31.Dec.26 |
|
|
|
... |
... |
... |
... |
... |
... |
... |
... |
... |
... |
| Week |
From |
To |
Stk |
ETF |
Cash |
End Week |
W/W |
W/W% |
YTD |
YTD% |
U/D |
%Chg |
Wk |
YTD |
Details |
| 2026 |
Dates |
Allocation |
Tradingvesting.com | Portfolio |
S&P 500 Index |
View |
| _________ |
_________ |
_________ |
_____ |
_____ |
_____ |
___________ |
_________ |
________ |
__________ |
________ |
____ |
_______ |
____ |
_______ |
_________ |
|
|
|
| |
|
|
|
| |
|
|
|
|
|
|
|
| No |
Date |
TraInv |
S&P 500 |
Nasdaq |
Dow 30 |
| 1 |
January |
5.90% |
0.89% |
-0.08% |
1.63% |
| 2 |
February |
6.28% |
-0.55% |
-3.01% |
0.41% |
| 3 |
March |
5.85% |
-4.34% |
-3.28% |
-5.03% |
| 4 |
April |
... |
... |
... |
... |
| 5 |
May |
... |
... |
... |
... |
| 6 |
June |
... |
... |
... |
... |
| 7 |
July |
... |
... |
... |
... |
| 8 |
August |
... |
... |
... |
... |
| 9 |
September |
... |
... |
... |
... |
| 10 |
October |
... |
... |
... |
... |
| 11 |
November |
... |
... |
... |
... |
| 12 |
December |
... |
... |
... |
... |
| |
Annual |
18.24% |
-5.08% |
-8.05% |
-0.99% |
|
|
|
|
|
|
| Mo |
Average |
6.01% |
-1.33% |
-2.12% |
-3.67% |
| Mo |
High |
6.28% |
0.89% |
-0.08% |
1.63% |
| Mo |
Low |
5.85% |
-4.34% |
-3.28% |
-5.03% |
|
|
|
|
|
|
| |
|
|
|
|
|
|
|
|
|
|
| COMBINED APPROACH |
Combined Approach
1) Trend Alert → Short-Term Trading
Immediate Notifications: Real-time alerts via Email to help users identify Short-Term Trends
2) Portfolio Model → Long-Term Investing
A sample portfolio provides a blueprint for asset allocation designed for long-term growth and stability rather than trend trading.
With our Model Portfolio, you can take your first steps into the financial world without risking losing any money. You will be able to monitor and evaluate performance.
Goal : Beat the Benchmark, S&P 500 Index
Combining Both: Trading and Investing
Using both services allows a user to follow a well-structured Portfolio Model Strategy while following our Trading Strategy separately using the Trend Alert service
A long-term Portfolio Model strategy doesn’t have to mean picking a fund and then doing nothing with it. Active Portfolio Model means taking better opportunities and adjusting your strategy for long-term growth.
Test our Portfolio Model Strategy to beat the market and outperform the S&P 500 Index.
- View a detailed log of all our transactions and Portfolio Model changes
- Track Our Portfolio Model performance and compare against the S&P 500 index
- Stay up to date and make informed decisions thanks to our Economic Calendar and Reports
- You can mirror our Portfolio Model Strategy, monitor and evaluate our performance. It is a simple and secure way to take your first steps into the world of finance without putting any money at stake.
Read: CFTC rule 4.41: Hypothetical or Simulated Performance Results
|
|
|
|
| |
|
|
|
|
|
|
|
|
|
| |
|
| |
|
|
|
|
|
|
|
|
|
| GENERAL DISCLOSURE |
- The material contained on our Website and Economic Calendar must be used at your own risk. Material is believed to be reliable, but we do not guarantee its accuracy or validity, nor is Tradingvesting.com responsible for any errors or omissions which may occur. The analysis and/or recommendations made by Tradingvesting.com do not provide, imply, or otherwise constitute a guarantee of performance. All contents and recommendations are based on data and sources believed to be reliable, but accuracy and completeness cannot be guaranteed. It should not be assumed that future results will be profitable or will equal past performance, real, indicated or implied.Tradingvesting.com website and material contained therein is not a solicitation to participate in the Futures/Stocks/Options Market. This Economic Calendar does not include Earning Releases, Announced Stock Splits, Upcoming Initial Public Offerings with Underwritings or Rating Changes. Tradingvesting.com has attempted to verify the information contained in this calendar. However, any aspect of such info may change without notice. Unless indicated otherwise: economic data is from the U.S and intraday data is at least 20 minutes delayed; all prices are in the local currency; Time is U.S. Eastern Time. Furthermore, there is a very high degree of risk involved in trading.Tradingvesting.com assumes no responsibilities for your trading and investment results, please red our Risk Disclosure.
- Tradingvesting.com does not provide investment advice, and does not represent that any of the information or related analysis is accurate or complete at any time. All information on this website are for educational purposes only and are not intended to provide financial advice. Any statements about profits or income, expressed or implied, do not represent a guarantee. Your actual trading may result in losses as no trading system is guaranteed. You accept full responsibilities for your actions, trades, profit or loss, and agree to hold Tradingvesting.com and any authorized distributors of this information harmless in any and all ways. We respect your right to privacy, please click here to view our privacy policy.
- U.S. Government Required Disclaimer - Commodity Futures Trading Commission.
Futures and options trading has large potential rewards, but also large potential risk. You must be aware of the risks and be willing to accept them in order to invest in the futures and options markets. Don't trade with money you can't afford to lose. This website is neither a solicitation nor an offer to Buy/Sell futures or options. No representation is being made that any account will or is likely to achieve profits or losses similar to those discussed on this website. The past performance of any trading system or methodology is not necessarily indicative of future results.
- CFTC rule 4.41: Hypothetical or simulated performance results have certain limitations. Unlike an actual performance record, simulated results do not represent actual trading or investing. Also, since the trades have not been executed, the results may have under-or-over compensated for the impact, if any, of certain market factors, such as lack of liquidity. Simulated trading and investing programs in general are also subject to the fact that they are designed with the benefit of hindsight. No representation is being made that any account will or is likely to achieve profit or losses similar to those shown.
- Risk Warning: Trading foreign exchange on margin carries a high level of risk, and may not be suitable for all investors. The high degree of leverage can work against you as well as for you. Before deciding to invest in foreign exchange you should carefully consider your investment objectives, level of experience, and risk appetite. The possibility exists that you could sustain a loss of some or all of your initial investment and therefore you should not invest money that you cannot afford to lose. You should be aware of all the risks associated with foreign exchange trading, and seek advice from an independent financial advisor if you have any doubts. Our linking to these sites does not constitute an endorsement of any products, services or the information found on them. Once you link to another site you are subject to the policies of the new site. By using this site, you agree to the Terms of Service, Privacy Policy and Risk Disclosure. Copyright 2017 Tradingvesting, LLC. All rights reserved. If you have any questions regarding the Online Economic Calendar application, please contact us: click here.
THIS BRIEF STATEMENT CANNOT, OF COURSE, DISCLOSE ALL THE RISKS AND OTHER ASPECTS OF THE COMMODITY MARKETS AND EQUITY MARKETS. PLEASE READ MORE AT: TERMS OF SERVICE.
|
|
|
|
| |
|
|
|
| |
|
|
|