|
 |
|
 |
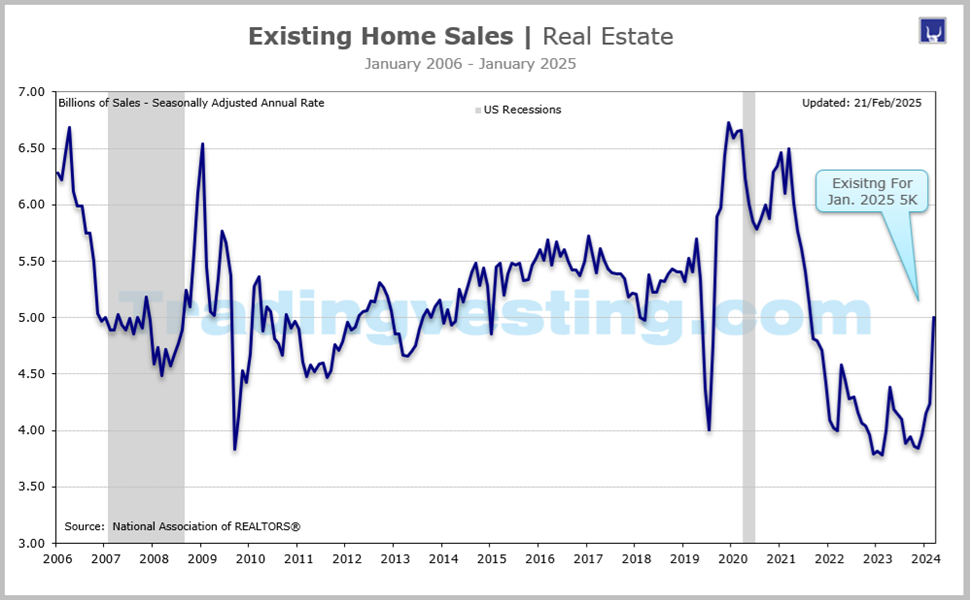
Existing Home Sales | Real Estate |
|
 |
|
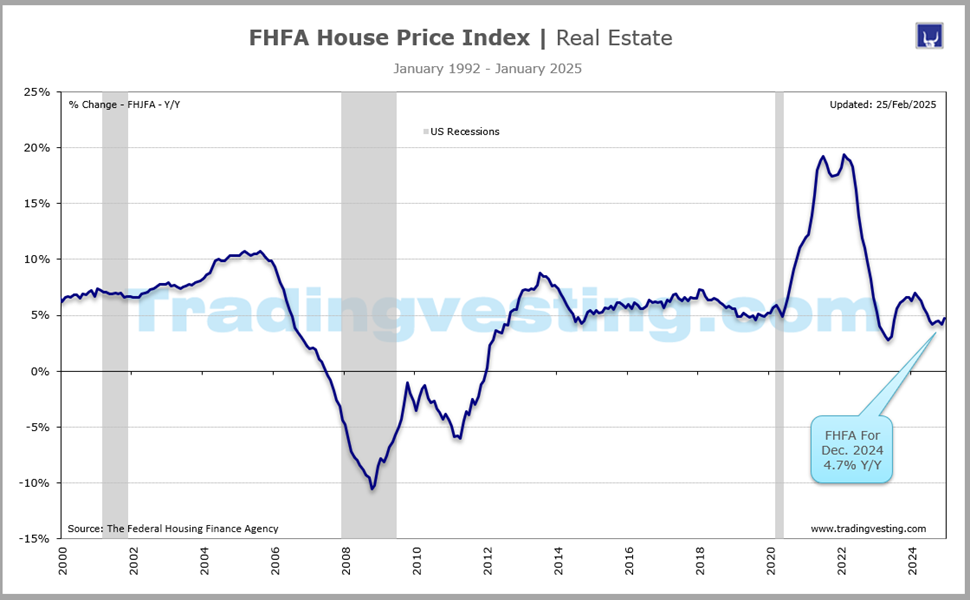
The S&P/Case-Shiller Home Price Indices are the leading measures for the US residential housing market, tracking changes in the value of residential real estate both nationally as well as in 20 metropolitan regions. Read More...
|
|
|
|
|
|
|
| |
|
| |
 5. Existing Home Sales (1 of 10) 5. Existing Home Sales (1 of 10) 1. Housing Starts (2 of 10) 1. Housing Starts (2 of 10) 2. Building Permits (3 of 10) 2. Building Permits (3 of 10) 3. Case Shiller Index (4 of 10) 3. Case Shiller Index (4 of 10) 4. New Home Sales (5 of 10) 4. New Home Sales (5 of 10) 6. Pending Home Sales (6 of 10) 6. Pending Home Sales (6 of 10) 7. Housing Market Index (7 of 10) 7. Housing Market Index (7 of 10) 8. FHFA House Price Index (8 of 10) 8. FHFA House Price Index (8 of 10) 9. MBA Purchase Applications (9 of 10) 9. MBA Purchase Applications (9 of 10) 10. Mortgae Rates 30-Year (10 of 10) 10. Mortgae Rates 30-Year (10 of 10)
|
 |
|
|
|
|
| |
|
→ Big Chart |
|
→ Release |
|
| |
|
|
|
|
|
|
|
|
|
|
|
|
|
|
|
|
|
|
|
 |
|
Big Chart | Large Data |
 |
|
Existing Home Sales | Real Estate |
|
Today's Week |
 |
|
|
|
|
|
|
|
|
|
|
|
|
|
| |
|
|
|
|
|
|
|
|
|
|
|
|
|
|
|
|
|
|
|
|
|
Slides | Ten 10 |
|
|
Existing Home Sales | Real Estate |
|
Today's Week |
|
|
|
|
|
|
|
|
|
|
|
|
|
|
| |
|
|
|
|
|
|
|
|
|
|
|
|
|
|
|
|
|
|
|
|
|
Release Schedule | 2026 |
|
|
Existing Home Sales | Real Estate |
|
Today's Week |
|
|
|
|
|
|
|
|
|
|
|
|
|
Existing Home Sales (At 10:00 a.m ET)
| SCHEDULE 2026 |
No 1 |
No 2 |
No 3 |
No 4 |
No 5 |
No 6 |
No 7 |
No 8 |
No 9 |
No 10 |
No 11 |
No 12 |
| Release | Week |
|
|
|
|
|
|
|
|
|
|
|
|
| Release | Date |
|
|
|
|
|
|
|
|
|
|
|
|
| Release | Day |
|
|
|
|
|
|
|
|
|
|
|
|
 |
|
|
|
|
|
|
|
|
|
|
|
|
| Prior |
4.13 M |
4.35 M |
3.91 M |
4.09 M |
... |
... |
... |
... |
... |
... |
... |
... |
| Prior Revised |
4.14 M |
4.27 M |
4.02 M |
... |
... |
... |
... |
... |
... |
... |
... |
... |
| CONSENSUS |
4.23 M |
4.20 M |
3.88 M |
... |
... |
... |
... |
... |
... |
... |
... |
... |
| Consensus Low |
4.06 M |
4.13 M |
3.81 M |
... |
... |
... |
... |
... |
... |
... |
... |
... |
| Consensus High |
4.30 M |
4.25 M |
3.98 M |
... |
... |
... |
... |
... |
... |
... |
... |
... |
| ANNUAL RATE |
4.35 M |
3.91 M |
4.09 M |
... |
... |
... |
... |
... |
... |
... |
... |
... |
|
|
|
|
|
|
|
|
|
|
|
|
|
| Prior M/M |
... |
5.1% |
-8.4% |
... |
... |
... |
... |
... |
... |
... |
... |
... |
| Prior Rev M/M |
0.7% |
4.4% |
-5.9% |
... |
... |
... |
... |
... |
... |
... |
... |
... |
| MONTH/MONTH |
5.1% |
-8.4% |
1.7% |
... |
... |
... |
... |
... |
... |
... |
... |
... |
|
|
|
|
|
|
|
|
|
|
|
|
|
| Prior Y/Y |
... |
1.4% |
-4.4% |
... |
... |
... |
... |
... |
... |
... |
... |
... |
| Prior Rev Y/Y |
-0.7% |
-0.5% |
-1.7% |
... |
... |
... |
... |
... |
... |
... |
... |
... |
| YEAR/YEAR |
1.4% |
-4.4% |
-1.4% |
... |
... |
... |
... |
... |
... |
... |
... |
... |
| RATING |
|
|
|
|
|
|
|
|
|
|
|
|
| Month For |
Dec-25 |
Jan-26 |
Feb-26 |
Mar-26 |
Apr-26 |
May-26 |
Jun-26 |
Jul-26 |
Aug-26 |
Sep-26 |
Oct-26 |
Nov-26 |
|
|
|
|
|
|
|
|
|
|
|
|
|
|
|
| |
|
| |
|
|
|
|
|
|
|
|
|
|
|
Release Schedule | 2025 |
|
|
Existing Home Sales | Real Estate |
|
Today's Week |
|
|
|
|
|
|
|
|
|
|
|
|
|
Existing Home Sales (At 10:00 a.m ET)
| SCHEDULE 2025 |
No 1 |
No 2 |
No 3 |
No 4 |
No 5 |
No 6 |
No 7 |
No 8 |
No 9 |
No 10 |
No 11 |
No 12 |
| Release | Week |
|
|
|
|
|
|
|
|
|
|
|
|
| Release | Date |
|
|
|
|
|
|
|
|
|
|
|
|
| Release | Day |
|
|
|
|
|
|
|
|
|
|
|
|
|
|
|
|
|
|
|
|
|
|
|
|
|
| Prior |
4.15 M |
4.24 M |
4.08 M |
4.26 M |
4.02 M |
4.00 M |
4.03 M |
3.93 M |
4.01 M |
4.00 M |
4.06 M |
4.10 M |
| Prior Revised |
... |
4.29 M |
4.09 M |
4.27 M |
... |
... |
4.04 M |
... |
... |
... |
4.05 M |
4.11 M |
| CONSENSUS |
4.16 M |
4.16 M |
3.95 M |
4.12 M |
4.13 M |
3.95 M |
4.00 M |
3.90 M |
3.95 M |
4.06 M |
4.09 M |
4.15 M |
| Consensus Low |
4.10 M |
4.02 M |
3.87 M |
4.00 M |
3.90 M |
3.85 M |
3.90 M |
3.80 M |
3.90 M |
3.95 M |
4.02 M |
4.10 M |
| Consensus High |
4.22 M |
4.29 M |
4.10 M |
4.35 M |
4.27 M |
4.10 M |
4.10 M |
3.99 M |
4.00 M |
4.12 M |
4.20 M |
4.25 M |
| ANNUAL RATE |
4.24 M |
4.08 M |
4.26 M |
4.02 M |
4.00 M |
4.03 M |
3.93 M |
4.01 M |
4.00 M |
4.06 M |
4.10 M |
4.13 M |
|
|
|
|
|
|
|
|
|
|
|
|
|
| Prior |
4.8% |
2.2% |
-4.9% |
4.2% |
-5.9% |
-0.5% |
0.8% |
-2.7% |
... |
... |
... |
... |
| Prior Rev |
... |
2.9% |
-4.7% |
4.4% |
... |
... |
... |
... |
... |
... |
... |
... |
| MONTH/MONTH |
2.2% |
-4.9% |
4.2% |
-5.9% |
-0.5% |
0.8% |
-2.7% |
... |
... |
... |
... |
... |
|
|
|
|
|
|
|
|
|
|
|
|
|
| Prior |
2.6% |
9.3% |
4.8% |
-1.2% |
-2.4% |
-2.% |
-0.7% |
0.0% |
... |
... |
... |
... |
| Prior Rev |
... |
5.8% |
2.3% |
-0.9% |
... |
... |
... |
... |
... |
... |
... |
... |
| YEAR/YEAR |
9.3% |
4.8% |
-1.2% |
-2.4% |
-2.0% |
-0.7% |
0.0% |
... |
... |
... |
... |
... |
| RATING |
|
|
|
|
|
|
|
|
|
|
|
|
| Month For |
Dec-24 |
Jan-25 |
Feb-25 |
Mar-25 |
Apr-25 |
May-25 |
Jun-25 |
Jul-25 |
Aug-25 |
Sep-25 |
Oct-25 |
Nov-25 |
|
|
|
|
|
|
|
|
|
|
|
|
|
|
|
| |
|
| |
|
|
|
|
|
|
|
|
|
|
|
Release Schedule | 2024 |
|
|
Existing Home Sales | Real Estate |
|
Today's Week |
|
|
|
|
|
|
|
|
|
|
|
|
|
Existing Home Sales (At 10:00 a.m ET)
| SCHEDULE 2024 |
No 1 |
No 2 |
No 3 |
No 4 |
No 5 |
No 6 |
No 7 |
No 8 |
No 9 |
No 10 |
No 11 |
No 12 |
| Release | Week |
|
|
|
|
|
|
|
|
|
|
|
|
| Release | Date |
|
|
|
|
|
|
|
|
|
|
|
|
| Release | Day |
|
|
|
|
|
|
|
|
|
|
|
|
|
|
|
|
|
|
|
|
|
|
|
|
|
| Prior |
3.82 M |
3.78 M |
4.00 M |
4.38 M |
4.19 M |
4.14 M |
4.11 M |
3.89 M |
3.95 M |
3.86 M |
3.84 M |
3.96 M |
| Prior Revised |
... |
3.88 M |
... |
... |
4.22 M |
... |
... |
3.90 M |
3.96 M |
3.88 M |
3.83 M |
... |
| CONSENSUS |
3.82 M |
3.97 M |
3.92 M |
4.18 M |
4.19 M |
4.10 M |
4.00 M |
3.90 M |
3.90 M |
3.90 M |
3.90 M |
4.05 M |
| Consensus Low |
3.80 M |
3.75 M |
3.85 M |
3.96 M |
4.10 M |
3.85 M |
3.90 M |
3.80 M |
3.82 M |
3.80 M |
3.90 M |
3.90 M |
| Consensus High |
3.85 M |
4.10 M |
3.95 M |
4.40 M |
4.30 M |
4.20 M |
4.25 M |
3.94 M |
4.00 M |
4.00 M |
4.10 M |
4.15 M |
| EXISTING UNITS |
3.78 M |
4.00 M |
4.38 M |
4.19 M |
4.14 M |
4.1 M |
3.89 M |
3.95 M |
3.86 M |
3.84 M |
3.96 M |
4.15 M |
|
|
|
|
|
|
|
|
|
|
|
|
|
| Month over Month |
-1.0% |
3.1% |
9.5% |
-4.3% |
-1.9% |
-0.7% |
-5.4% |
1.3% |
-2.5% |
-1.0% |
3.4% |
4.8% |
|
|
|
|
|
|
|
|
|
|
|
|
|
| Year over Year |
-6.2% |
-1.7% |
3.3% |
-3.7% |
-1.9% |
-2.8% |
-5.4% |
-2.5% |
-4.2% |
-3.5% |
2.9% |
2.6% |
| RATING |
|
|
|
|
|
|
|
|
|
|
|
|
| Month For |
Dec-23 |
Jan-24 |
Feb-24 |
Mar-24 |
Apr-24 |
May-24 |
Jun-24 |
Jul-24 |
Aug-24 |
Sep-24 |
Oct-24 |
Nov-24 |
|
|
|
|
|
|
|
|
|
|
|
|
|
|
|
| |
|
| |
|
|
|
|
|
|
|
|
|
|
|
Release Schedule | 2023 |
|
|
Existing Home Sales | Real Estate |
|
Today's Week |
|
|
|
|
|
|
|
|
|
|
|
|
|
Existing Home Sales (At 10:00 a.m ET)
| SCHEDULE 2023 |
No 1 |
No 2 |
No 3 |
No 4 |
No 5 |
No 6 |
No 7 |
No 8 |
No 9 |
No 10 |
No 11 |
No 12 |
| Release | Week |
|
|
|
|
|
|
|
|
|
|
|
|
| Release | Date |
|
|
|
|
|
|
|
|
|
|
|
|
| Release | Day |
|
|
|
|
|
|
|
|
|
|
|
|
|
|
|
|
|
|
|
|
|
|
|
|
|
| Prior |
4.09 M |
4.02 M |
4.00 M |
4.58 M |
4.44 M |
4.28 M |
4.30 M |
4.16 M |
4.07 M |
4.04 M |
3.96 M |
3.79 M |
| Prior Revised |
4.08 M |
4.03 M |
... |
4.55 M |
4.43 M |
4.29 M |
... |
... |
... |
... |
3.95 M |
... |
| CONSENSUS |
3.97 M |
4.10 M |
4.17 M |
4.50 M |
4.29 M |
4.25 M |
4.23 M |
4.15 M |
4.10 M |
3.90 M |
3.91 M |
3.77 M |
| Consensus Low |
3.90 M |
3.93 M |
3.95 M |
4.01 M |
4.20 M |
4.15 M |
4.20 M |
4.05 M |
4.00 M |
3.79 M |
3.88 M |
3.65 M |
| Consensus High |
4.03 M |
4.20 M |
4.45 M |
4.70 M |
4.40 M |
4.31 M |
4.30 M |
4.20 M |
4.25 M |
4.10 M |
4.00 M |
3.81 M |
| EXISTING UNITS |
4.02 M |
4.00 M |
4.58 M |
4.44 M |
4.28 M |
4.30 M |
4.16 M |
4.07 M |
4.04 M |
3.96 M |
3.79 M |
3.82 M |
|
|
|
|
|
|
|
|
|
|
|
|
|
| Mo over Mo |
-1.5% |
-0.7% |
14.5% |
-2.4% |
-3.4% |
0.2% |
-3.3% |
-2.2% |
-0.7% |
-2.0% |
-4.1% |
0.8% |
|
|
|
|
|
|
|
|
|
|
|
|
|
| Year over Year |
-34.0% |
-36.9% |
-22.6% |
-22.0% |
-23.2% |
-20.4% |
-18.9% |
-16.6% |
-15.3% |
-15.4% |
-14.6% |
-7.3% |
| RATING |
|
|
|
|
|
|
|
|
|
|
|
|
| Month For |
Dec 22 |
Jan-23 |
Feb-23 |
Mar-23 |
Apr-23 |
May-23 |
Jun-23 |
Jul-23 |
Aug-23 |
Sep-23 |
Oct-23 |
Nov-23 |
|
|
|
|
|
|
|
|
|
|
|
|
|
|
|
| |
|
| |
|
|
|
|
|
|
|
|
|
|
|
Release Schedule | 2022 |
|
|
Existing Home Sales | Real Estate |
|
Today's Week |
|
|
|
|
|
|
|
|
|
|
|
|
|
Existing Home Sales (At 10:00 a.m ET)
| SCHEDULE 2022 |
No 1 |
No 2 |
No 3 |
No 4 |
No 5 |
No 6 |
No 7 |
No 8 |
No 9 |
No 10 |
No 11 |
No 12 |
| Release | Week |
|
|
|
|
|
|
|
|
|
|
|
|
| Release | Date |
|
|
|
|
|
|
|
|
|
|
|
|
| Release | Day |
|
|
|
|
|
|
|
|
|
|
|
|
|
|
|
|
|
|
|
|
|
|
|
|
|
| Prior |
6.46 M |
6.10 M |
6.50 M |
6.02 M |
5.77 M |
5.61 M |
5.41 M |
5.12 M |
4.81 M |
4.80 M |
4.71 M |
4.43 M |
| Prior Revised |
6.49 M |
6.09 M |
6.49 M |
5.93 M |
5.75 M |
5.60 M |
... |
5.11 M |
4.82 M |
4.78 M |
... |
... |
| CONSENSUS |
6.40 M |
6.08 M |
6.17 M |
5.86 M |
5.65 M |
5.40 M |
5.39 M |
4.85 M |
4.70 M |
4.69 M |
4.36 M |
4.20 M |
| Consensus Low |
6.35 M |
5.90 M |
5.05 M |
5.70 M |
5.45 M |
5.30 M |
5.15 M |
4.75 M |
4.57 M |
4.50 M |
4.20 M |
4.03 M |
| Consensus High |
6.65 M |
6.35 M |
6.40 M |
6.15 M |
6.00 M |
5.55 M |
5.50 M |
5.16 M |
4.79 M |
4.75 M |
4.70 M |
4.50 M |
| EXISTING UNITS |
6.10 M |
6.50 M |
6.02 M |
5.77 M |
5.61 M |
5.41 M |
5.12 M |
4.81 M |
4.80 M |
4.71 M |
4.43 M |
4.09 M |
|
|
|
|
|
|
|
|
|
|
|
|
|
| Mo over Mo |
-6.0% |
6.7% |
-7.2% |
-2.7% |
-2.4% |
-3.4% |
-5.4% |
-5.9% |
-0.4% |
-1.5% |
-5.9% |
-7.7% |
|
|
|
|
|
|
|
|
|
|
|
|
|
| Year over Year |
-8.3% |
-2.3% |
-2.4% |
-4.5% |
-5.9% |
-8.6% |
-14.2% |
-20.2% |
-19.9% |
-23.8% |
-28.4% |
-36.4% |
| RATING |
|
|
|
|
|
|
|
|
|
|
|
|
| Month For |
Dec 21 |
Jan-22 |
Feb-22 |
Mar-22 |
Apr-22 |
May-22 |
Jun-22 |
Jul-22 |
Aug-22 |
Sep-22 |
Oct-22 |
Nov-22 |
|
|
|
|
|
|
|
|
|
|
|
|
|
|
|
| |
|
| |
|
|
|
|
|
|
|
|
|
|
|
Release Schedule | 2021 |
|
|
Existing Home Sales | Real Estate |
|
Today's Week |
|
|
|
|
|
|
|
|
|
|
|
|
|
Existing Home Sales (At 10:00 a.m ET)
| SCHEDULE 2021 |
No 1 |
No 2 |
No 3 |
No 4 |
No 5 |
No 6 |
No 7 |
No 8 |
No 9 |
No 10 |
No 11 |
No 12 |
| Release | Week |
|
|
|
|
|
|
|
|
|
|
|
|
| Release | Date |
|
|
|
|
|
|
|
|
|
|
|
|
| Release | Day |
|
|
|
|
|
|
|
|
|
|
|
|
|
|
|
|
|
|
|
|
|
|
|
|
|
| Prior |
6.69 M |
6.76 M |
6.69 M |
6.22 M |
6.01 M |
5.85 M |
5.80 M |
5.86 M |
5.99 M |
5.88 M |
6.29 M |
6.34 M |
| Prior Revised |
6.71 M |
6.65 M |
6.66 M |
6.24 M |
... |
... |
5.78 M |
5.87 M |
6.00 M |
... |
... |
... |
| CONSENSUS |
6.55 M |
6.61 M |
6.50 M |
6.19 M |
6.08 M |
5.71M |
5.90 M |
5.83 M |
5.90 M |
6.03 M |
6.20 M |
6.51 M |
| Consensus Low |
1.0 M |
1.0 M |
6.32 M |
5.55 M |
5.90 M |
5.60 M |
5.00 M |
5.56 M |
5.75 M |
5.75 M |
6.10 M |
6.35 M |
| Consensus High |
1.0 M |
1.0 M |
6.70 M |
6.50 M |
6.30 M |
6.00 M |
6.10 M |
6.95 M |
6.02 M |
6.16 M |
6.31 M |
6.67 M |
| EXISTING UNITS |
6.76 M |
6.69 M |
6.22 M |
6.01 M |
5.85 M |
5.80 M |
5.86 M |
5.99 M |
5.88 M |
6.29 M |
6.34 M |
6.46 M |
|
|
|
|
|
|
|
|
|
|
|
|
|
| Mo over Mo |
0.0% |
0.2% |
-6.6% |
-3.7% |
-2.7% |
-0.9% |
1.4% |
2.0% |
-2.0% |
7.0% |
0.8% |
1.9% |
|
|
|
|
|
|
|
|
|
|
|
|
|
| Year over Year |
0.0% |
22.9% |
9.1% |
12.3% |
33.9% |
44.6% |
22.9% |
1.5% |
-1.5% |
-2.3% |
-5.8% |
-2.9% |
| RATING |
|
|
|
|
|
|
|
|
|
|
|
|
| Month For |
Dec 20 |
Jan-21 |
Feb-21 |
Mar-21 |
Apr-21 |
May-21 |
Jun-21 |
Jul-21 |
Aug-21 |
Sep-21 |
Oct-21 |
Nov-21 |
|
|
|
|
|
|
|
|
|
|
|
|
|
|
|
| |
|
| |
|
Legends: |
 |
Delayed |
 |
Positive View |
 |
Negative View |
 |
Neutral View |
 |
Non Available |
|
|
|
|
|
|
|
|
|
|
|
|
|
|
|
|
|
|
|
|
| |
|
|
|
|
|
| |
|
|
|
|
|
|
|
|
|
|
|
|
|
|
|
Brief News | 2026 |
|
|
Existing Home Sales | Real Estate |
|
Today's Week |
|
|
|
|
|
|
|
|
|
|
|
|
|
Existing Home Sales (At 10:00 a.m ET)
| DATE/WEEK |
HIGHLIGHTS |
FOR |
ACTUAL |
|
Existing-Home Sales |
No 12 |
... |
|
Nov-2026 |
|
| |
|
|
|
Existing-Home Sales |
No 11 |
... |
|
Oct-2026 |
|
| |
|
|
|
Existing-Home Sales |
No 10 |
... |
|
Sep-2026 |
|
| |
|
|
|
Existing-Home Sales |
No 9 |
... |
|
Aug-2026 |
|
| |
|
|
|
Existing-Home Sales |
No 8 |
... |
|
Jul-2026 |
|
| |
|
|
|
Existing-Home Sales |
No 7 |
... |
|
Jun-2026 |
|
| |
|
|
|
Existing-Home Sales |
No 6 |
... |
|
May-2026 |
|
| |
|
|
|
Existing-Home Sales |
No 5 |
... |
|
Apr-2026 |
|
| |
|
|
|
Existing-Home Sales |
No 4 |
... |
|
Mar-2026 |
|
| |
|
|
|
US existing home sales unexpectedly increase as mortgage rates decline. As of February 2026, existing-home sales increased by 1.7%, totaling 4.09 million sales. The sales rose in the Midwest, South, and West, but fell in the Northeast. The median sales price was $398,000, and inventory remained high, with a 3.8-month supply of homes available.U.S. existing home sales unexpectedly increased in February as lower mortgage rates and a moderation in house-price growth pulled buyers back into the market, but still-tight supply could constrain activity during the spring selling season. |
No 3 |
4.09 M |
|
Feb-2026 |
|
| |
|
|
|
Existing-Home Sales |
No 2 |
3.91 M |
|
Jan-2026 |
|
| |
|
|
|
Existing-Home Sales |
No 1 |
4.35 M |
|
Dec-2024 |
|
| |
|
|
|
|
|
|
|
|
| |
|
|
|
|
|
|
|
|
|
|
|
|
|
|
|
|
|
|
|
|
|
Brief News | 2025 |
|
|
Existing Home Sales | Real Estate |
|
Today's Week |
|
|
|
|
|
|
|
|
|
|
|
|
|
Existing Home Sales (At 10:00 a.m ET)
| DATE/WEEK |
HIGHLIGHTS |
FOR |
ACTUAL |
|
Existing-Home Sales |
No 12 |
4.13 M |
|
Nov-2025 |
|
| |
|
|
|
Existing-Home Sales |
No 11 |
4.10 M |
|
Oct-2025 |
|
| |
|
|
|
Sales of previously occupied U.S. homes accelerated in September as declining mortgage rates and a pickup in available properties on the market encouraged home shoppers. Existing home sales rose 1.5% last month from August to a seasonally adjusted annual rate of 4.06 million units, the National Association of Realtors said Thursday. That’s the fastest sales pace since February. |
No 10 |
4.06 M |
|
Sep-2025 |
|
| |
|
|
|
Sales of previously owned U.S. homes ticked lower in August amid affordability issues for buyers thanks to still-pricey homes on the market and interest rates on mortgages that remain relatively steep despite recent drops in borrowing costs. Home sales slipped 0.2% last month to a seasonally adjusted annual rate of 4.00 million units from an unrevised 4.01 million in July, the National Association of Realtors said on Thursday. Economists polled by Reuters had forecast home resales would slip slightly further, to 3.96 million units. Sales rose 1.8% on a year-over-year basis. |
No 9 |
4.00 M |
|
Aug-2025 |
|
| |
|
|
|
Sales of previously owned homes rose 2% in July compared with June to 4.01 million units, on a seasonally adjusted, annualized basis, according to the National Association of Realtors. Housing analysts had been expecting a slight decline. Sales were 0.8% higher than July 2024.Sales of previously owned homes rose 2% in July, according to the National Association of realtors.There were 1.55 million homes for sale at the end of July, an increase of 15.7% from the same month last year. Inventory is now at the highest level since May 2020 — and it’s clearly taking the pressure off prices. |
No 8 |
4.01 M |
|
Jul-2025 |
|
| |
|
|
|
US Existing-Home Sales Fall to 9-Month Low. US existing-home sales fell 2.7% from the previous month to a seasonally adjusted annual rate of 3.93 million units in June 2025, down from 4.04 million in May and below market expectations of 4.01 million. |
No 7 |
3.93 M |
|
Jun-2025 |
|
| |
|
|
|
Existing-home sales in May 2025 saw a slight increase of 0.8% to a seasonally adjusted annual rate of 4.03 million units, a modest gain despite persistently high mortgage rates and concerns about economic uncertainty that had impacted April's pending home sales. While sales ticked up month-over-month, they were down 0.7% year-over-year, and total housing inventory rose significantly, increasing 20.3% from May 2024 to 1.54 million units. The median existing-home sales price in May 2025 was $422,800, up 1.3% from the previous year, marking the highest May median on record, though home price growth moderated. |
No 6 |
4.03 M |
|
May-2025 |
|
| |
|
|
|
Existing-home sales in the US declined 0.5% in April 2025 to a seasonally adjusted annual rate of 4.00 million, reaching a 7-month low, with inventory rising to 1.45 million units and the median existing-home price at $414,000. This marks a 2% decrease year-over-year, making it the slowest April performance in 16 years, despite a 9% increase in inventory from March and a 20.8% increase from April 2024. |
No 5 |
4.00 M |
|
Apr-2025 |
|
| |
|
|
|
Existing-home sales in March 2025 declined by 5.9% from February to a seasonally adjusted annual rate of 4.02 million units, a 2.4% decrease compared to March 2024. The median existing-home sales price increased by 2.7% year-over-year to $403,700, while housing inventory rose by 19.8% from a year ago to 1.33 million units, reaching a 4.0-month supply. |
No 4 |
4.02 M |
|
Mar-2025 |
|
| |
|
|
|
Existing-home sales in the U.S. rose by 4.2% in February 2025 to a seasonally adjusted annual rate of 4.26 million homes, surpassing expectations and rebounding from a prior-month decline, although they remained 1.2% below the February 2024 sales pace. Despite the increase, affordability challenges and economic uncertainty still influence the market, with housing inventory also growing significantly. |
No 3 |
4.26 M |
|
Feb-2025 |
|
| |
|
|
|
Existing-home sales in January 2025 fell 4.9% from December to a seasonally adjusted annual rate of 4.08 million units, marking a decline from the prior month but still representing a 2% increase compared to January 2024, according to the National Association of Realtors (NAR). Despite the dip in sales, the median existing-home sales price increased by 4.8% year-over-year to $396,900, indicating continued challenges in housing affordability. |
No 2 |
4.08 M |
|
Jan-2025 |
|
| |
|
|
|
U.S. existing home sales increased to a 10-month high in December, but further gains are likely to be limited by elevated mortgage rates and house prices, which are keeping many prospective buyers on the sidelines. Despite the bigger-than-expected rise reported by the National Association of Realtors on Friday, home sales in 2024 were the lowest in three decades. The median house price last year hit a record high of $407,500. While housing supply has improved, it remains below pre-pandemic levels. |
No 1 |
4.24 M |
|
Dec-2024 |
|
| |
|
|
|
|
|
|
|
|
| |
|
|
|
|
|
| |
|
|
|
|
|
|
|
|
|
|
|
|
|
|
|
Brief News | 2024 |
|
|
Existing Home Sales | Real Estate |
|
Today's Week |
|
|
|
|
|
|
|
|
|
|
|
|
|
Existing Home Sales (At 10:00 a.m ET)
| DATE/WEEK |
HIGHLIGHTS |
FOR |
ACTUAL |
|
November home sales surged more than expected, boosted by lower mortgage rates. Sales of previously owned homes rose 4.8% in November compared with October, according to the National Association of Realtors Sales were 6.1% higher than November 2023, the largest annual gain in three years. Sales of previously owned homes rose 4.8% in November compared with October, according to the National Association of Realtors. That put them at a seasonally adjusted, annualized rate of 4.15 million units. |
No 12 |
4.15 M |
|
Nov-2024 |
|
| |
|
|
|
Existing-Home Sales Grew 3.4% in October; First Year-Over-Year Gain Since July 2021. Existing-home sales climbed 3.4% in October to a seasonally adjusted annual rate of 3.96 million. Sales advanced 2.9% from one year ago, the first year-over-year increase in more than three years (July 2021; +1.8%). The median existing-home sales price ascended 4.0% from October 2023 to $407,200, the 16th consecutive month of year-over-year price gains. The inventory of unsold existing homes edged higher by 0.7% from the prior month to 1.37 million at the end of October, or the equivalent of 4.2 months' supply at the current monthly sales pace. |
No 11 |
3.96 M |
|
Oct-2024 |
|
| |
|
|
|
Home sales fall 1.0% to 3.84 million units in September. Housing inventory up 1.5% to 1.39 million units. Median existing home price rises 3% from year-ago period. U.S. existing home sales dropped to a 14-year low in September, weighed down by higher mortgage rates and house prices. The second straight monthly decline in home resales reinforced economists' views that the slump in residential investment, which includes homebuilding, deepened in the third quarter. The housing market has struggled to rebound after being knocked down by a resurgence in mortgage rates in the spring. Though supply has improved, entry-level homes remain scarce in most regions of the country, keeping home prices at levels that are unaffordable for most first-time buyers. Home sales fell 1.0% last month to a seasonally adjusted annual rate of 3.84 million units, the lowest level since October 2010, the National Association of Realtors said on Wednesday. Economists polled by Reuters had forecast home resales would be unchanged at a rate of 3.86 million units. |
No 10 |
|
|
Sep-2024 |
|
| |
|
|
|
US existing home sales drop in August; supply improves. U.S. existing home sales fell more than expected in August as house prices remained elevated despite a continued improvement in supply. Home sales fell 2.5% last month to a seasonally adjusted annual rate of 3.86 million units, the National Association of Realtors said on Thursday. Economists polled by Reuters had forecast home resales falling to a rate of 3.90 million units. The Federal Reserve on Wednesday cut interest rates by 50 basis points, the first reduction in borrowing costs since 2020. The move could see mortgage rates, which have retreated to 1-1/2-year lows, declining further. Lower mortgage rates could entice more homeowners to put their homes on the market, which could increase supply. |
No 9 |
3.86 M |
|
Aug-2024 |
|
| |
|
|
|
U.S. existing home sales rose more than expected in July, reversing four consecutive monthly declines, as improving supply and declining mortgage rates offered hope that activity could rebound in the months ahead. Home sales rose 1.3% last month to a seasonally adjusted annual rate of 3.95 million units, the National Association of Realtors said on Thursday. Economists polled by Reuters had forecast home resales would edge up to a rate of 3.93 million units. Home resales, which account for a large portion of U.S. housing sales, declined 2.5% on a year-on-year basis in July. The median existing home price jumped 4.2% from a year earlier to $422,600. Home prices increased in all four U.S. regions. Home resales are counted at the close of a contract. Sales in July likely reflected contracts signed in the prior two months, when the average rate on the popular 30-year fixed-rate mortgage was hovering around 7.0%. |
No 8 |
3.95 M |
|
Jul-2024 |
|
| |
|
|
|
U.S. existing home sales fell more than expected in June as the median house price set another record high, but improving supply and declining mortgage rates offered hope that activity could rebound in the months ahead. The fourth straight monthly decline in home resales reported by the National Association of Realtors on Tuesday added to weak homebuilding and permits data in suggesting that the housing market contracted in the second quarter after providing a boost to economic growth in the January-March quarter. Existing home sales are counted at the close of a contract. Sales in June likely reflected contracts signed in the prior two months, when the average rate on the popular 30-year fixed-rate mortgage was above 7.0%. |
No 7 |
3.89 M |
|
Jun-2024 |
|
| |
|
|
|
Existing home sales fell for the third straight month in May due to lingering high mortgage rates and record-high prices, according to the National Association of Realtors (NAR). Low resale inventory and strong demand continued to drive up existing home prices, marking the eleventh consecutive month of year-over-year median sales price gains. However, rising inventory is likely to dampen home price growth in the months ahead. Homeowners with lower mortgage rates have opted to stay put, avoiding trading in for higher rates. This trend is driving home prices higher and resale inventory lower. Eventually, mortgage rates are expected to decrease gradually, leading to increased demand (and unlocking lock-in inventory) in the coming quarters. However, that decline is dependent on future inflation reports. Total existing home sales, including single-family homes, townhomes, condominiums, and co-ops, fell 0.7% to a seasonally adjusted annual rate of 4.11 million in May (as shown below). On a year-over-year basis, sales were 2.8% lower than a year ago. |
No 6 |
4.11 M |
|
May-2024 |
|
| |
|
|
|
Existing home sales fall 1.9% in April. Housing inventory increases 9% to 1.21 million. Median house price rises 5.7% to $407,600 from year ago. U.S. existing home sales unexpectedly fell in April as higher mortgage rates and house prices weighed on demand, dealing another setback to the housing market. Though the report from the National Association of Realtors on Wednesday showed inventory increasing last month to a 2-1/2-year high entry-level homes remained scarce, accounting for the second straight monthly decline in sales. The housing market has taken a step back after residential investment, which includes homebuilding, grew at its fastest pace in more than three years in the first quarter amid a resurgence in mortgage rates. |
No 5 |
4.14 M |
|
Apr-2024 |
|
| |
|
|
|
US existing home sales drop in March; median price increases. U.S. existing home sales fell in March as higher interest rates and house prices sidelined buyers from the market. Home sales dropped 4.3% last month to a seasonally adjusted annual rate of 4.19 million units, the National Association of Realtors said on Thursday. Economists polled by Reuters had forecast home resales slipping to a rate of 4.20 million units. Sales fell in the densely populated South, the Midwest, which is considered the most affordable region, and the West. They rose in the Northeast for the first time since November. Home resales, which account for a large portion of U.S. housing sales, declined 3.7% on a year-on-year basis in March. |
No 4 |
4.19 M |
|
Mar-2024 |
|
| |
|
|
|
US home sales post second straight monthly drop; house prices accelerate. Existing-Home Sales Surge in a Positive Sign for This Year’s Housing Market. Sales of existing homes, which exclude new construction, jumped 9.5% from January to February, according to a recent report from the National Association of Realtors®. That was the largest month-over-month increase in a year. However, sales did dip a little annually, coming down 3.3% from February 2023. The surge in monthly closings is likely due to the drop in mortgage rates, which began declining last fall. This brought more buyers into the market and, importantly, might have persuaded more homeowners to sell their properties. As most sellers are also buyers, many have been reluctant to trade a low mortgage rate for a higher one. Mortgage rates averaged 6.87% for 30-year fixed loans in the week ending March 21, according to Freddie Mac. |
No 3 |
4.38 M |
|
Feb-2024 |
|
| |
|
|
|
Sales of previously owned homes rose 3.1% in January to 4 million units on a seasonally adjusted annualized basis, according to the National Association of Realtors. Sales were down 1.7% year over year. Existing home sales rose 3% to start the year, but higher mortgage rates are already hurting. Sales of previously owned homes rose in January, boosted by lower mortgage interest rates of November and December. Inventory of homes for sale in January increased to 1.01 million units, up 3.1% from January 2023, but still at a low 3-month supply. The median existing-home price for all housing types in January was $379,100, up 5.1% from a year earlier and an all-time high for the month of January. |
No 2 |
4.00 M |
|
Jan-2024 |
|
| |
|
|
|
US existing home sales fall in December, supply shows signs of improvement. U.S. existing home sales fell in December to the lowest level in nearly 13-1/2 years, but a recovery could be in the cards this year as mortgage rates decline and housing inventory shows signs of improving. Existing home sales slipped 1.0% last month to a seasonally adjusted annual rate of 3.78 million units, the lowest level since August 2010, the National Association of Realtors said on Friday. Economists polled by Reuters had forecast home sales would be unchanged. Home resales are counted at the closing of a contract. The sales in December likely reflected contracts signed in the prior two months, when the average rate on the popular 30-year fixed-rate mortgage was stuck above 7.0%. |
No 1 |
3.78 M |
|
Dec-2023 |
|
| |
|
|
|
|
|
|
|
|
| |
|
|
|
|
|
| |
|
|
|
|
|
|
|
|
|
|
|
|
|
|
|
Brief News | 2023 |
|
|
Existing Home Sales | Real Estate |
|
Today's Week |
|
|
|
|
|
|
|
|
|
|
|
|
|
Existing Home Sales (At 10:00 a.m ET)
| DATE/WEEK |
HIGHLIGHTS |
FOR |
ACTUAL |
|
Existing Home Sales Beat Expectations In November. After falling for five consecutive months, existing home sales in November beat expectations and moved higher from the previous month. The National Association of Realtors (NAR) reported that existing home sales were 0.8% higher than in October, and the annual rate of 3.82 million was higher than economists' projection of 3.76 million. While the number represented an improvement over the prior month, sales of single-family homes, townhomes, condominiums, and co-ops were still 7.3% lower than the prior year. |
No 12 |
3.82 M |
|
Nov-2023 |
|
| |
|
|
|
US home sales on pace for the worst year since 1993. In October, sales of existing homes dropped to 3.79 million, marking the lowest point since 2010, the National Realtor Association reported .
Home sales may have their worst year in 30 years. Sales slumped in October and prices continued to climb, as mortgage rates surged last month and inventory remained extraordinarily low. That kept homebuyers out of the market, according to a monthly report from the National Association of Realtors released Tuesday. Home sales remained at 13-year lows as buyers competed for the few available homes on the market and continued to push up prices. Elevated prices, together with the average rate for a 30-year fixed rate mortgage nearing 8% in October, have created the least affordable market in several decades. |
No 11 |
3.79 M |
|
Oct-2023 |
|
| |
|
|
|
U.S. existing home sales dropped to a 13-year low in September as surging mortgage rates and tight supply combined to reduce affordability for many first-time buyers. Existing home sales fell 2.0% last month to a seasonally adjusted annual rate of 3.96 million units, the lowest level since October 2010, the National Association of Realtors said on Thursday. They are counted at the closing of a contract and last month's sales likely reflected contracts signed in August, when the rate on the popular 30-year fixed mortgage vaulted above 7%. Economists polled by Reuters had forecast home sales slipping to a rate of 3.89 million units. Sales dropped 1.1% in the South and decreased 4.1% in the Midwest. They rose 4.2% in the Northeast and slumped 5.3% in the West.Home resales, which account for a big chunk of U.S. housing sales, declined 15.4% on a year-on-year basis in September. Mortgage rates have risen in tandem with the yield on the benchmark 10-year Treasury note, which has spiked to more than a 16-year high, mostly because of expectations that the Federal Reserve will keep interest rates higher for longer in response to the economy's resilience. Since March 2022, the U.S. central bank has raised its benchmark overnight interest rate by 525 basis points to the current 5.25%-5.50% range. |
No 10 |
|
|
Sep-2023 |
|
| |
|
|
|
U.S. existing home sales unexpectedly fell in August as persistently tight supply boosted prices, and a further decline is likely amid a resurgence in mortgage rates. Existing home sales slipped 0.7% last month to a seasonally adjusted annual rate of 4.04 million units, the National Association of Realtors said on Thursday. Existing home sales are counted at the closing of a contract. Last month's sales likely reflected contracts signed in July, before the recent run-up in mortgage rates, which lifted the rate on the popular 30-year fixed mortgage above 7%. Economists polled by Reuters had forecast home sales climbing to a rate of 4.10 million units.The housing market had shown signs of stabilizing after being slammed by the Federal Reserve's aggressive monetary policy tightening. With mortgage rates resuming their upward trend, it appears to be faltering. Homebuilder confidence slumped to a five-month low in September, while housing starts in August dropped to levels last seen in mid-2020.The increase in mortgages rates is in tandem with U.S. Treasury yields, which have risen amid worries that surging oil prices could hamper the Fed's fight against inflation. |
No 9 |
4.04 M |
|
Aug-2023 |
|
| |
|
|
|
U.S. existing home sales dropped to a six month-low in July as home owners who are locked into cheap mortgages refrained from selling their properties with the cost of new mortgages for another home at the highest levels in decades. That limited inventory, however, helped drive prices higher on a year-over-year basis for the first time since January. Existing home sales fell 2.2% in July to a seasonally adjusted annual rate of 4.07 million units, the lowest level since January, from an unrevised 4.16 million units in June, the National Association of Realtors said on Tuesday. Economists polled by Reuters had forecast home sales would be little changed at 4.15 million units. Sales fell in the Northeast, Midwest and South, but rose in the West, where home prices have fallen most sharply in the past year. All regions experienced annual sales declines. Home prices have bottomed out after being pressured by the Federal Reserve's aggressive interest rate hikes, but the persistent shortage of properties for sale could limit any rebound as many prospective buyers are forced out of the market. Mortgage rates have surged again recently to the highest levels in decades, with the average rate on the popular 30-year fixed-rate mortgage topping 7% in the latest week, according to mortgage finance giant Freddie Mac. |
No 8 |
4.07 M |
|
Jul-2023 |
|
| |
|
|
|
U.S. existing home sales dropped to a five month-low in June, depressed by a chronic shortage of houses on the market that slowed the pace of decline in annual house prices. Existing home sales fell 3.3% in June to a seasonally adjusted annual rate of 4.16 million units, the lowest level since January, the National Association of Realtors said on Thursday. Economists polled by Reuters had forecast home sales would drop to a rate of 4.20 million units. Home resales, which account for a big chunk of U.S. housing sales, plunged 18.9% on a year-on-year basis in June. With the average rate on the popular 30-year fixed mortgage just under 7%, according to data from mortgage finance agency Freddie Mac, many homeowners are remaining in their homes for longer, contributing to the tight supply. |
No 7 |
4.16 M |
|
Jun-2023 |
|
| |
|
|
|
U.S. existing-home prices register largest drop since December 2011. U.S. existing home sales ticked higher in May to snap a two-month skid with condominium sales accounting for the modest gain, and selling prices nationally fell from a year earlier by the most in more than a decade, showing the uneven nature of the sector's recovery from last year's downdraft. Existing home sales rose 0.2% to a seasonally adjusted annual rate of 4.3 million units last month, the National Association of Realtors said on Thursday. Sales rose in the South and West and fell in the Northeast and Midwest. Economists polled by Reuters had forecast home sales would fall to a rate of 4.25 million units. Home resales, which account for the largest share of U.S. housing sales, tumbled 20.4% on a year-on-year basis in May. The median sales price was $396,100, a 3.1% decline from a year earlier, the largest annual drop since 2011. Prices grew in the Northeast and Midwest but fell in the South and West. |
No 6 |
4.30 M |
|
May-2023 |
|
| |
|
|
|
U.S. existing home sales fell for a second straight month in April, with prices rising in roughly half of the country, which together with possibly higher mortgage rates could delay a housing market recovery. Existing home sales dropped 3.4% to a seasonally adjusted annual rate of 4.28 million units last month, the National Association of Realtors said on Thursday. Sales fell in all four regions. Economists polled by Reuters had forecast home sales would fall to a rate of 4.30 million units. Home resales, which account for a big chunk of U.S. housing sales, tumbled 23.2% on a year-on-year basis in April. The median existing house price fell 1.7% from a year earlier to $388,800 in April. Still, markets in the Northeast and Midwest regions reported price gains. |
No 5 |
4.28 M |
|
Apr-2023 |
|
| |
|
|
|
U.S. existing home sales fell in March as a reversal in mortgage rates likely pushed buyers back to the sidelines, but there are tentative signs that the housing market slump is close to reaching a bottom. Existing home sales dropped 2.4% to a seasonally adjusted annual rate of 4.44 million units last month, the National Association of Realtors said on Thursday. They had increased in February for the first time in a year. Existing home sales are counted at the closing of a contract. Last month's sales likely reflected some contracts signed in February, when mortgage rates started rising again after mostly decreasing in January. Economists polled by Reuters had forecast home sales would fall to a rate of 4.50 million units. Home resales, which account for a big chunk of U.S. housing sales, tumbled 22.0% on a year-on-year basis in March. Mortgage rates declined from mid-March through mid-April, in tandem with U.S. Treasury yields, on hopes that the Fed would not continue raising borrowing costs beyond next month amid signs that the economy was slowing. |
No 4 |
4.44 M |
|
Mar-2023 |
|
| |
|
|
|
Existing home sales jump 14.5% in February. Median house price falls 0.2% to $363,000 from year ago. Supply increases 15.3% year-on-year to 980,000 units. U.S. existing home sales rebounded more than expected in February as lower mortgage rates and the first year-on-year decrease in prices in 11 years pulled buyers back into the market, further evidence that the housing market was stabilizing at low levels. The jump in sales of previously owned homes, which was reported by the National Association of Realtors on Tuesday, was the largest in more than 2-1/2 years and ended 12 straight monthly declines in sales, the longest such stretch since 1999. The housing market has been the biggest casualty of the aggressive interest rate hikes delivered by the Federal Reserve in its battle to tame high inflation. The surge in sales added to data on housing starts and homebuilder confidence in suggesting that the housing market was probably finding a floor. Existing home sales, which are counted at the close of a contract, surged 14.5% to a seasonally adjusted annual rate of 4.58 million units last month. February's sales likely reflected contracts signed a couple of months back. Mortgage rates decreased from mid-November through early February before rising again. Home sales could fall in March.Economists polled by Reuters had forecast home sales would rebound 5.0% to a rate of 4.20 million units. Home resales, which account for a big chunk of U.S. housing sales, fell 22.6% on a year-on-year basis in February. |
No 3 |
4.58 M |
|
Feb-2023 |
|
| |
|
|
|
U.S. existing home sales dropped to a more than 12-year low in January, but the pace of decline slowed, raising cautious optimism that the housing market slump could be close to reaching a bottom. Existing home sales fell 0.7% to a seasonally adjusted annual rate of 4.00 million units last month, the lowest level since October 2010, the National Association of Realtors said on Tuesday. That marked the 12th straight monthly decline in sales, the longest such stretch since 1999. Sales fell in the Northeast and Midwest, but rose in the South and West. Economists polled by Reuters had forecast home sales rising to a rate of 4.10 million units. Home resales, which account for a big chunk of U.S. housing sales, plunged 36.9% on a year-on-year basis in January. But the worst is probably over. Homebuilders sentiment rose to a five-month high in February, though still depressed. It will, however, be a while before the housing market turns around. Government data last week showed single-family homebuilding and permits for future home construction declining in January. Mortgage rates are rising again, with the 30-year fixed mortgage rate increasing to an average 6.32% last week from 6.12% the prior week, according to data from mortgage finance agency Freddie Mac. The second straight weekly increase reflected a spike in bond yields after recent strong data on retail sales and inflation raised fears that the Fed could continue raising interest rates through summer.The median existing house price increased 1.3% from a year earlier to $359,000 in January. There were 980,000 previously owned homes on the market, up 2.1% from December and 15.3% from a year ago. At January's sales pace, it would take 2.9 months to exhaust the current inventory of existing homes up from 1.6 months a year ago. A four-to-seven-month supply is viewed as a healthy balance between supply and demand. Properties typically remained on the market for 33 days last month, up from 26 days in December. Fifty-four percent of homes sold in January were on the market for less than a month. |
No 2 |
4.00 M |
|
Jan-2023 |
|
| |
|
|
|
Existing home sales fall to lowest level since 2010.Sales of previously owned homes fell for the 11th consecutive month in December, according to the National Association of Realtors.Existing homes fell to an annualized pace of 4.02 million units in December, down 1.5% month over month and 34% year over year.The last time the pace of buying was this slow was in November 2010. U.S. existing home sales plunged to a 12-year low in December, but declining mortgage rates raised cautious optimism that the embattled housing market could be close to finding a floor.The report from the National Association of Realtors on Friday also showed the median house price increasing at the slowest pace since early in the COVID-19 pandemic as sellers in some parts of the country resorted to offering discounts. Existing home sales, which are counted when a contract is closed, fell 1.5% to a seasonally adjusted annual rate of 4.02 million units last month, the lowest level since November 2010. That marked the 11th straight monthly decline in sales, the longest such stretch since 1999. |
No 1 |
4.02 M |
|
Dec-2022 |
|
| |
|
|
|
|
|
|
|
|
| |
|
|
|
|
|
| |
|
|
|
|
|
|
|
|
|
|
|
|
|
|
|
Brief News | 2022 |
|
|
Existing Home Sales | Real Estate |
|
Today's Week |
|
|
|
|
|
|
|
|
|
|
|
|
|
Existing Home Sales (At 10:00 a.m ET)
| DATE/WEEK |
HIGHLIGHTS |
FOR |
ACTUAL |
|
U.S. existing-home sales to slide to 11-year low in 2023, NAR says. Sales of previously owned U.S. homes will fall for a second year in 2023 to their lowest annual total since 2012 when the housing market was still in a slow recovery from the sub-prime mortgage crisis, but sales prices should hold up, the National Association of Realtors said on Tuesday. Existing-home sales, which have fallen each month since January as mortgage rates surged on the back of the Federal Reserve's aggressive campaign to hike interest rates to control inflation, are projected to slide by another 6.8% to 4.78 million in 2023, Lawrence Yun, NAR chief economist and senior vice president of research, said. Mortgage rates, which topped 7% in October for 30-year fixed-rate loans, should ease to 5.7% as the Fed dials back on its rate-hike campaign, Yun predicted. They stood at 6.41% in early December, according to the Mortgage Bankers Association. |
No 12 |
4.09 M |
|
Nov-2022 |
|
| |
|
|
|
Home sales declined for the ninth straight month in October, as higher interest rates and surging inflation kept buyers on the sidelines. Sales of previously owned homes dropped 5.9% from September to October, according to the National Association of Realtors. That is the slowest pace since December 2011, with the exception of a very brief drop at the beginning of the Covid-19 pandemic. The October reading put sales at a seasonally adjusted, annualized pace of 4.43 million units. Sales were 28.4% lower year over year. Even as sales slow, supply is still stubbornly low. There were 1.22 million homes for sale at the end of October, an decrease of just under 1% both month to month and year over year. That’s a 3.3-month supply at the current sales pace. Historically, a balanced market is considered to be a six-month supply. The median price of an existing home sold in October was $379,100, an increase of 6.6% from the year before. The price gains, however, are shrinking, as the seasonal drop in home prices this time of year appears to be much deeper than usual. |
No 11 |
4.43 M |
|
Oct-2022 |
|
| |
|
|
|
Sales of existing U.S. homes slid for an eighth straight month in September and will likely fall further in the months ahead as the housing market continues to stand out as the economic sector absorbing the hardest hit from the Federal Reserve's aggressive interest rate hikes. Existing home sales fell 1.5% to a seasonally adjusted annual rate of 4.71 million units last month, the NAR said. Outside of the short-lived plunge during the spring of 2020, when the economy was reeling from the first wave of COVID-19, this was the lowest sales level since September 2012. Economists polled by Reuters had forecast sales would decrease to a rate of 4.70 million units. On a regional basis, sales fell in the Northeast, Midwest and South and were unchanged in the West. Home resales, which account for the bulk of U.S. home sales, decreased 23.8% on a year-on-year basis. |
No 10 |
4.71 M |
|
Sep-2022 |
|
| |
|
|
|
Existing home sales fall in August 2022, and prices soften significantly. Sales of previously owned homes fell 0.4% in August 2022 from July 2022 to a seasonally adjusted annualized rate of 4.80 million units, according to the National Association of Realtors. That is the slowest sales pace since June 2020, when activity stalled very briefly due to the start of the pandemic. Outside of that, it is the slowest pace since November 2015. Sales of previously owned homes fell 0.4% in August from July to a seasonally adjusted annualized rate of 4.80 million units, according to the National Association of Realtors. That is the slowest sales pace since May 2020, when activity stalled very briefly due to the start of the Covid pandemic. Outside of that, it is the slowest pace since November 2015. Sales were 19.9% lower than in August 2021. Homebuilders have been pulling back in the face of falling demand, but there was a small bump in single-family housing starts in August, according to the U.S. Census. That may have been due to a brief drop in mortgage rates during, which sparked more interest from buyers. But building permits, which are an indicator of future construction, fell as mortgage rates were expected to rise again. The 30-year fixed started this year at 3%. It is now close to 6.5%. Even with interest rates making housing less affordable, prices were still higher than a year ago. The median price of an existing home sold in August was $389,500, up 7.7% from a year ago. Home prices historically decline from July to August, due to seasonality, but the drop this year was wider than usual, suggesting a significant softening. |
No 9 |
4.80 M |
|
Aug-2022 |
|
| |
|
|
|
Sales of previously owned homes fell nearly 6% in July compared with June, according to a monthly report from the National Association of Realtors. The sales count declined to a seasonally adjusted annualized rate of 4.81 million units, the group added. It is the slowest sales pace since November 2015, with the exception of a brief plunge at the beginning of the Covid pandemic. Sales dropped about 20% from the same month a year ago. |
No 8 |
4.81 M |
|
Jul-2022 |
|
| |
|
|
|
U.S. existing home sales fell for a fifth straight month in June to the lowest level in two years, as fast-rising interest rates and record-high selling prices make buying a home too expensive for a growing share of American households. Mortgage interest rates have soared as a result of the Federal Reserve's stiff rate hikes to try to tame high inflation. That has driven a new buyer's monthly payment up by more than 50% in the first six months of 2022 by some estimates and has had a clear effect on home sales that had surged during the COVID-19 pandemic to the highest levels since the mid-2000s. In June, sales of previously owned homes fell 5.4% to a seasonally adjusted annual rate of 5.12 million units, the lowest level since June 2020 when sales were rebounding from the COVID-19 lockdown slump, the National Association of Realtors said on Wednesday. Sales have now fallen each month since January. Economists polled by Reuters had forecast sales would decrease to a rate of 5.38 million units. |
No 7 |
5.12 M |
|
Jun-2022 |
|
| |
|
|
|
Sales of existing homes in May dropped 3.4% to a seasonally adjusted annualized rate of 5.41 million units, according to the National Association of Realtors. Sales were 8.6% lower than in May 2021. April’s sales were revised slightly lower as well. This is the weakest reading since June 2020, which was during the early months of the Covid pandemic. Adjusting for that, it is the lowest since January 2020. This reading is based on closings during the month, therefore representing contracts likely signed in March and April. During that time the average rate on the 30-year fixed mortgage rose from right around 4% to 5.5%. It is currently right around 6%, according to Mortgage News Daily. Rising rates, along with rapid home price appreciation and continued low supply, have given affordability a triple punch. There were 1.16 million homes for sale at the end of May, an increase of 12.6% month to month but still down 4.1% from May 2021. At the current sales pace, that represents a 2.6-month supply. Low supply continued to push home prices higher. The median price of a house sold in May was $407,600, an increase of 14.8% from May 2021. That is the highest price on record since the Realtors began tracking it in the late 1980s. Supply is leanest on the lower end of the market, which is likely why activity there continues to be weaker than on the higher end. Sales of homes priced between $100,000 and $250,000 dropped 27% from a year ago. Sales of homes priced between $750,000 and $1 million were up 26%. Sales of homes priced above $1 million surged 22% year over year. Homes are selling quickly, however. Houses stayed on the market an average of just 16 days, the lowest on record for the Realtors. All-cash sales were still elevated at 25% of all sales. Investors made up 16% of all transactions, down slightly from April and from a year ago. First-time buyers made up just 27% of all transactions, down from 31% a year ago. Affordability is clearly hitting them hardest, as rents are rising as well. |
No 6 |
5.41 M |
|
May-2022 |
|
| |
|
|
|
Existing home sales fell in April 2022 to the lowest level since the start of the pandemic. Sales of previously owned homes in April fell to the lowest pace since the Covid pandemic started, according to the National Association of Retailers. “We are moving back to pre-pandemic sales activity, but I expect further declines,” said Lawrence Yun, chief economist for the group. Tight supply kept home prices higher, despite rising interest rates. The median price of an existing home sold in April was $391,200, the highest on record and an increase of 14.8% from a year ago. |
No 5 |
5.61 M |
|
Apr-2022 |
|
| |
|
|
|
Sales of existing homes dropped 2.7% M/M in March 2022 to a seasonally adjusted, annualized rate of 5.77 million units, according to the National Association of Realtors. February’s reading was also revised downward with a larger-than-usual dent, from 6.02 million units to 5.93 million. The price of a home sold in March set a record, as inventory dwindled and sales fell. March 2022 sales were 4.5% Y/Y lower than the same period in 2021. The median price of an existing home sold in March was $375,300, an increase of 15% from March 2021. That’s the highest median price ever recorded by the Realtors. At the end of March 2022 there were 950,000 homes for sale, a decrease of 9.5% year over year. At the current sales pace that represents a two-month supply. March 2022 sales were 4.5% lower than the same period in 2021. The reading is based on closings, meaning the contracts were likely signed in January and February, when mortgage rates began to rise but had not yet shot up as sharply as they did in March. The average rate on the 30-year fixed mortgage stood at 3.29% at the beginning of January and rose to 3.9% by the end of February, according to Mortgage News Daily. The 30-year fixed rate now stands at 5.35%. |
No 4 |
5.77 M |
|
Mar-2022 |
|
| |
|
|
|
Existing home sales fall 7.2% in February. Median house price rises 15% to $357,300 from year ago. Housing inventory drops 15.5% to 870,000 from year ago. U.S. home sales fell by the most in a year in February as a perennial shortage of houses and double-digit price growth continued to squeeze first-time buyers out of the market. With mortgage rates rising above 4% for the first time in nearly three years, sales are likely to slow this year, though that would do little to curb house price inflation. Contracts to buy previously owned houses, a leading indicator of home sales, fell for three straight months through January. Existing home sales dropped 7.2% to a seasonally adjusted annual rate of 6.02 million units last month, the largest decrease since February 2021, the National Association of Realtors said on Friday. |
No 3 |
6.02 M |
|
Feb-2022 |
|
| |
|
|
|
January 2022 home sales jump 6.7% despite a record low supply. Sales of previously owned homes in January 2022 rose 6.7% from December to a seasonally adjusted annualized rate of 6.5 million units, according to the National Association of Realtors. The supply of homes for sale fell to a record low, down 16.5% from a year ago. Tight supply and strong demand pushed the median price of a home sold in January to $350,300, an increase of 15.4% from January 2021. U.S. existing home sales ticked higher in May to snap a two-month skid with condominium sales accounting for the modest gain, and selling prices nationally fell from a year earlier by the most in more than a decade, showing the uneven nature of the sector's recovery from last year's downdraft. Existing home sales rose 0.2% to a seasonally adjusted annual rate of 4.3 million units last month, the National Association of Realtors said on Thursday. Sales rose in the South and West and fell in the Northeast and Midwest. Economists polled by Reuters had forecast home sales would fall to a rate of 4.25 million units. |
No 2 |
6.50 M |
|
Jan-2022 |
|
| |
|
|
|
On the negative side, home builders also were broadly lower following after KeyBanc downgraded the group on concerns over looming interest rate hikes that will drive up borrowing costs. KB Home lost 3.9%, Lennar fell about 4.4% and D.R. Horton fell 3.3%. U.S. home sales tumbled in December 2021 as higher prices amid record low inventory continued to shut out some first-time buyers. Existing home sales dropped 4.6% to a seasonally adjusted annual rate of 6.18 million units last month, the National Association of Realtors said on Thursday. Sales fell across all regions. Economists polled by Reuters had forecast sales would fall to a rate of 6.44 million units. |
No 1 |
6.10 M |
|
Dec-2021 |
|
| |
|
|
|
|
|
|
|
|
| |
|
|
|
|
|
| |
|
|
|
|
|
|
|
|
|
|
|
|
|
|
|
Brief News | 2021 |
|
|
Existing Home Sales | Real Estate |
|
Today's Week |
|
|
|
|
|
|
|
|
|
|
|
|
|
Existing Home Sales (At 10:00 a.m ET)
| DATE/WEEK |
HIGHLIGHTS |
FOR |
ACTUAL |
|
November 2021 Existing Home Sales Increase for Third Consecutive Month. NAR released a summary of existing-home sales data showing that housing market activity this November increased 1.9% from October 2021, the third consecutive month of increase. November’s existing-home sales reached a 6.46 million seasonally adjusted annual rate. November’s sales of existing homes declined 2.2% from November 2020, reflecting the off-season bump in sales in the second half of 2020 as the economy started opening up from the pandemic lockdown. |
No 12 |
6.46 m |
|
Nov-2021 |
|
| |
|
|
|
Existing-home sales rose for the second month in a row in October, as the median sales price also posted an increase, marking 116 consecutive months of gains, the longest streak on record, the National Association of Realtors said. Total existing-home sales, which are completed transactions, including single-family homes, townhomes, condominiums and co-ops, rose 0.8% from September to a seasonally adjusted annual rate of 6.34 million in October. Year over year, sales were down 5.8% from 6.73 million transactions in October 2020. The median existing-home price for all housing types in October was $352,800, up 13.3% from October 2020, as prices rose in each region, the NAR said in a press release. |
No 11 |
6.34 M |
|
Oct-2021 |
|
| |
|
|
|
Existing home sales increased in September, up 7.0 percent to hit a 6,290,000 unit annual rate. While this is the highest sales rate since January, overall existing home sales remained in the range set in the fall of 2020. The inventory of available homes on the market remained low, dipping from an already very tight 2.6 months’ worth in August, to 2.4 months in September. According to the National Association of Realtors, the median sales price of an existing home was up by 13.3 percent in September compared with a year earlier. |
No 10 |
6.29 M |
|
Sep-2021 |
|
| |
|
|
|
August Existing Home Sales Drop 2.0%. The decline follows two months of increases. NAR’s chief economist says buyer demand remains strong, but higher prices have pushed many to wait for more inventory. Existing-home sales retreated in August, breaking two straight months of increases, according to the National Association of Realtors® (NAR). Each of the four major U.S. regions experienced declines on both a month-over-month and a year-over-year perspective. Total existing-home sales – completed transactions that include single-family homes, townhomes, condominiums and co-ops – fell 2.0% month-to-month to a seasonally adjusted annual rate of 5.88 million in August. Year-over-year, sales dropped 1.5% year-to-year (5.97 million in August 2020). |
No 9 |
5.88 M |
|
Aug-2021 |
|
| |
|
|
|
July 2021 Existing-Home Sales Rise With the Aid of More Supply. NAR released a summary of existing-home sales data showing that housing market activity this July inclined 2.0% from June 2021. July’s existing-home sales reached a 5.99 million seasonally adjusted annual rate. July’s sales of existing homes inclined 1.5% from July 2020. |
No 8 |
5.99 M |
|
Jul-2021 |
|
| |
|
|
|
After four straight months of declines, sales of previously owned homes rose 1.4% in June month-to-month to a seasonally adjust annualized rate of 5.86 million units, according to the National Association of Realtors. These sales represent closings, so they are based on contracts signed in April and May. Sales were 22.9% higher compared with June 2020. That annual comparison, according to the Realtors, is still slightly skewed due to pandemic lockdowns in certain parts of the country that lasted into summer last year. The inventory of homes for sale at the end of June was 1.25 million, representing a 2.6-month supply at the current sales pace. That is a slight improvement from May’s 2.5-month supply.“We may have turned a corner on inventory,” said Lawrence Yun, NAR’s chief economist. “There is some softening in the demand.” |
No 7 |
5.86 M |
|
Jun-2021 |
|
| |
|
|
|
Sales of existing homes in May dropped for the fourth straight month due to a very low supply of homes on the market. Existing home sales fell 0.9% last month from April to a seasonally adjusted annualized rate of 5.8 million units, according to the National Association of Realtors. The 5.8 million rate is modestly above pre-pandemic levels. Sales were 44.6% higher than a year earlier, but that comparison is skewed massively given that the housing market basically shut down for about two months at the start of the pandemic. The market then rebounded dramatically last summer and remained strong for all of last year. |
No 6 |
5.80 M |
|
May-2021 |
|
| |
|
|
|
U.S. home sales fell for a third straight month in April as an acute shortage of properties drove prices to a record high. Existing home sales dropped 2.7% to a seasonally adjusted annual rate of 5.85 million units last month, the National Association of Realtors said on Friday. Sales fell in the Northeast, West and the densely populated South, but rose in the Midwest. Economists polled by Reuters had forecast sales rebounding 2.0% to a rate of 6.09 million units in April. Home resales, which account for the bulk of U.S. home sales, surged 33.9% on a year-on-year basis. The annual increase was, however, distorted by the plunge in sales in April 2020, when the economy was reeling from mandatory shutdowns of non-essential businesses to slow the first wave of COVID-19 cases. |
No 5 |
5.85 M |
|
Apr-2021 |
|
| |
|
|
|
U.S. home sales fell to a seven-month low in March, pulled down by an acute shortage of properties, which is boosting prices and making owning a house more expensive for some first-time buyers. Existing home sales dropped 3.7% to a seasonally adjusted annual rate of 6.01 million units last month, the lowest level since August 2020, the National Association of Realtors said on Thursday. Sales fell in all four regions. Economists polled by Reuters had forecast sales at a rate of 6.19 million units in March. The second straight monthly decline in sales was flagged by a sharp decline in signed contracts and applications for home purchasing loans in February. |
No 4 |
6.01 M |
|
Mar-2021 |
|
| |
|
|
|
Existing home sales fell sharply in February, as supply dropped by the largest amount on record. Closed sales of existing homes in February dropped a larger-than-expected 6.6% compared with January, according to the National Association of Realtors.That put them at a seasonally adjusted, annualized rate of 6.22 million units, which was 9.1% higher compared with February 2020. The supply of homes for sale fell 29.5% year over year, the largest annual decline ever, to 1.03 million homes. Despite being on the cusp of the historically busy spring housing market, homeowners are not listing their properties for sale at the pace they normally would this time of year. |
No 3 |
6.22 M |
|
Feb-2021 |
|
| |
|
|
|
Existing-Home Sales Tick Up 0.6% in January. Existing-home sales continued to increase in January to a seasonally-adjusted annual rate of 6.69 million, up 0.6% from the prior month and 23.7% from one year ago. The median existing-home sales price rose to $303,900, 14.1% higher from one year ago. As of the end of January, housing inventory fell to a record-low of 1.04 million units, down by 25.7% year-over-year – a record decline. |
No 2 |
6.69 M |
|
Jan-2021 |
|
| |
|
|
|
December 2020 Existing Home Sales Annual Pace Rises to 6.76 Million. NAR released a summary of existing-home sales data showing that housing market activity this December rose modestly 0.7% from November 2020. December’s existing-home sales reached a 6.76 million seasonally adjusted annual rate, and rose 22.2% from December 2019. The pandemic took some steam out of a typically busy first quarter in 2020, then robust sales followed to close out the year. Total existing-home sales rose to 5.64 million in 2020, up 5.6% from the prior year, with all regions showing sales gains. The annual sales figure is the highest level since 2006 when existing home sales totaled 6.477 million |
No 1 |
6.76 M |
|
Dec-2020 |
|
| |
|
|
|
|
|
|
|
|
| |
|
|
|
|
|
| |
|
Legends: |
|
Delayed |
|
Positive View |
|
Negative View |
|
Neutral View |
|
Non Available |
|
|
|
|
|
|
|
|
|
|
|
|
|
|
|
|
|
|
|
|
| |
|
|
|
|
|
|
|
|
|
|
|
|
|
|
|
|
|
|
|
|
|
Definitions | Explain |
|
|
Existing Home Sales | Real Estate |
|
Today's Week |
|
|
|
|
|
|
|
|
|
|
|
|
| |
|
|
|
|
| |
|
| EXISTING HOME SALES |
Building Permits
Permits usually lead home construction by about a month, but permits are not required in all regions of the country, and the level of permits therefore tends to be less than the level of starts over time.
Housing Permits Building permits are permits taken out in order to allow excavation. An increase in building permits and starts usually occurs a few months after a reduction in mortgage rates. A sale isn't final until a mortgage is closed.
According to the government, a building permit results in a new housing start roughly within one month. Permits usually lead home construction by about a month, but permits are not required in all regions of the country, and the level of permits therefore tends to be less than the level of starts over time.
Construction of single-family homes - the lion's share of the market.
While home building now accounts for only about 2.5% of gross domestic product, it remains a major force in the economy. Economists estimate that for every one house built, about 2.5 jobs are created.
The inventory of homes for sale and the median price. The inventory of homes for sale at the current sales pace is the inventory/sales ratio of the housing sector.
For example, a 5.0 figure for inventory/sales indicates that the supply of homes for sale would be depleted within five months at the current sales pace. The lower this figure goes, the greater the need for new housing starts. The year/year change in the median price provides a good indication of inflation in home price.
|
|
|
| |
|
|
|
|
|
|
|
|
|
|
|
|
|
|
|
|
|
|
|
|
|
Data | Source |
|
|
Existing Home Sales | Real Estate |
|
Today's Week |
|
|
|
|
|
|
|
|
|
|
|
|
| |
|
|
|
|
|
|
| DATA INFORMATION |
EXISTING HOME SALES |
| SOURCE |
U.S. Department of Housing & Urban Development. |
| WEB |
www.hud.gov |
| FREQUENCY |
Monthly |
| AVAILABILITY |
Usually during the third week of the month. |
| COVERAGE |
Data are for the previous month. Data for June are released in July. |
| REVISIONS |
Yes |
| IMPORTANCE |
Real Estate - Low Importance |
|
| |
|
|
|
|
|
|
|
|
|
|
|
|