|
 |
|
 |
FHFA House Price Index | Real Estate |
|
 |
|
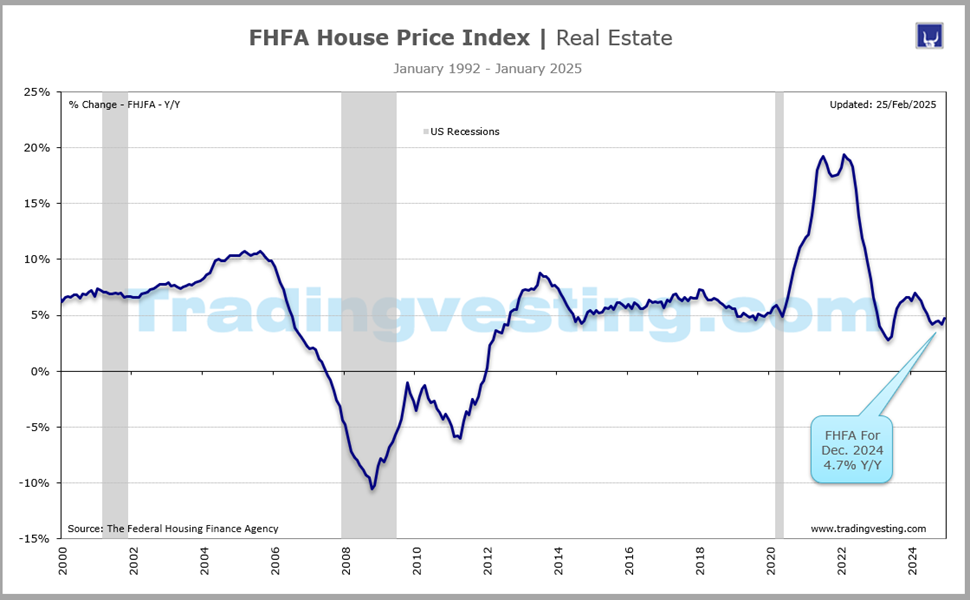
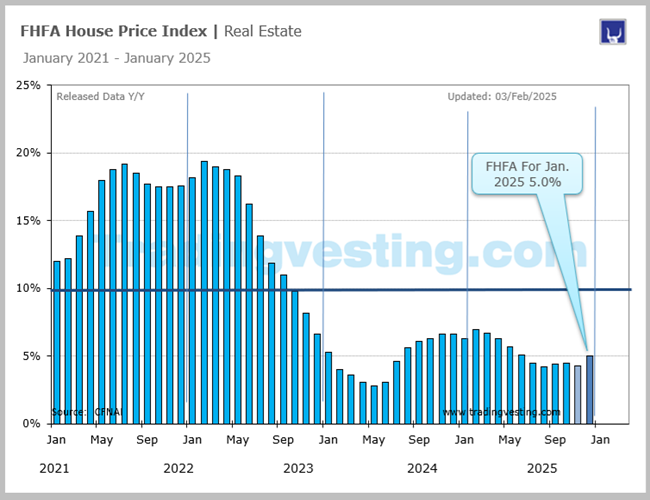
The FHFA report measures changes in real estate values using purchases of properties with mortgages backed by Fannie Mae or Freddie Mac. It doesn't provide a specific price for homes.. Read More...
|
|
|
|
|
|
|
| |
|
| |
 8. FHFA House Price Index (1 of 10) 8. FHFA House Price Index (1 of 10) 9. MBA Purchase Applications (2 of 10) 9. MBA Purchase Applications (2 of 10) 10. Mortgage Rates 30-Year (3 of 10) 10. Mortgage Rates 30-Year (3 of 10)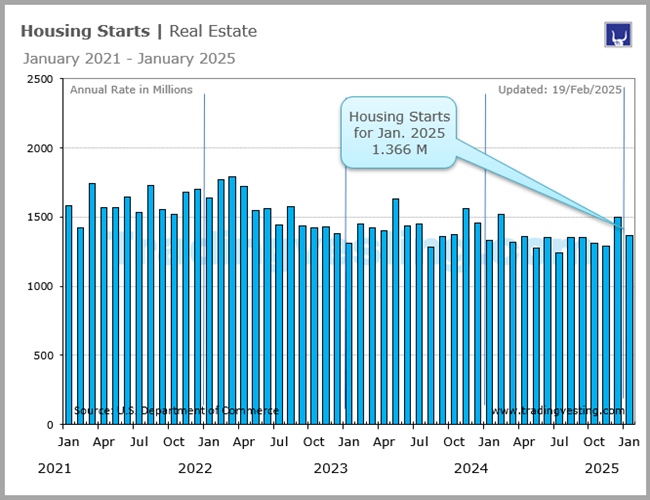 1. Housing Starts (4 of 10) 1. Housing Starts (4 of 10)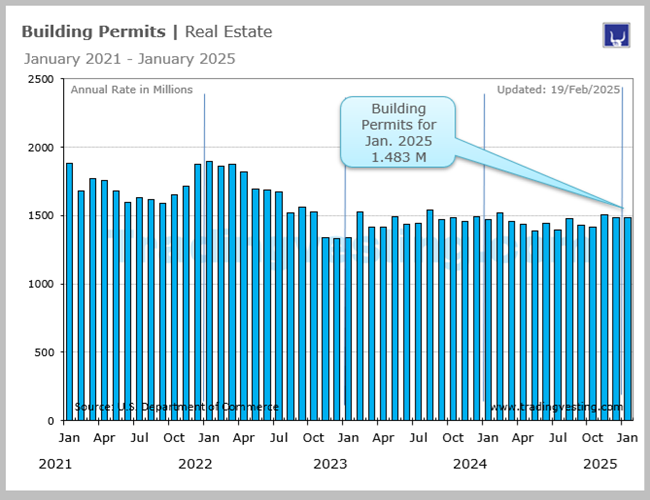 2. Building Permits (5 of 10) 2. Building Permits (5 of 10) 3. Case Shiller Index (6 of 10) 3. Case Shiller Index (6 of 10) 4. New Home Sales (7 of 10) 4. New Home Sales (7 of 10) 5. Existing Home Sales (8 of 10) 5. Existing Home Sales (8 of 10) 6. Pending Home Sales (9 of 10) 6. Pending Home Sales (9 of 10) 7. Housing Market Index (10 of 10) 7. Housing Market Index (10 of 10)
|
 |
|
|
|
|
| |
|
→ Big Chart |
|
→ Release |
|
| |
|
|
|
|
|
|
|
|
|
|
|
|
|
|
|
|
|
|
|
 |
|
Big Chart | Large Data |
 |
|
FHFA House Price Index | Real Estate |
|
Today's Week |
 |
|
|
|
|
|
|
|
|
|
|
|
|
|
| |
|
|
|
|
|
|
|
|
|
|
|
|
|
|
|
|
|
|
|
|
|
Slides | Ten 10 |
|
|
FHFA House Price Index | Real Estate |
|
Today's Week |
|
|
|
|
|
|
|
|
|
|
|
|
|
|
| |
|
|
|
|
|
|
|
|
|
|
|
|
|
|
|
|
|
|
|
|
|
Release Schedule | 2026 |
|
|
FHFA House Price Index | Real Estate |
|
Today's Week |
|
|
|
|
|
|
|
|
|
|
|
|
|
FHFA House Price Index (At 9:00)
| SCHEDULE 2026 |
No 1 |
No 2 |
No 3 |
No 4 |
No 5 |
No 6 |
No 7 |
No 8 |
No 9 |
No 10 |
No 11 |
No 12 |
| Release | Week |
|
|
|
|
|
|
|
|
|
|
|
|
| Release | Date |
|
|
|
|
|
|
|
|
|
|
|
|
| Release | Day |
|
|
|
|
|
|
|
|
|
|
|
|
 |
|
|
|
|
|
|
|
|
|
|
|
|
| Prior |
0.4% |
0.6% |
0.1% |
... |
... |
... |
... |
... |
... |
... |
... |
... |
| Prior Revised: |
... |
0.7% |
0.3% |
... |
... |
... |
... |
... |
... |
... |
... |
... |
| CONSENSUS |
... |
0.3% |
... |
... |
... |
... |
... |
... |
... |
... |
... |
... |
| Consensus Low |
... |
0.2% |
... |
... |
... |
... |
... |
... |
... |
... |
... |
... |
| Consensus High |
... |
1.0% |
... |
... |
... |
... |
... |
... |
... |
... |
... |
... |
| FHFA M/M |
0.6% |
0.1% |
0.1% |
... |
... |
... |
... |
... |
... |
... |
... |
... |
| Month For |
Nov 24 |
Dec-24 |
Jan-25 |
Feb-25 |
Mar-25 |
Apr-25 |
May-25 |
Jun-25 |
Jul-25 |
Aug-25 |
Sep-25 |
Oct-25 |
| |
|
|
|
|
|
|
|
|
|
|
|
|
| FHFA Y/Y |
No 1 |
No 2 |
No 3 |
No 4 |
No 5 |
No 6 |
No 7 |
No 8 |
No 9 |
No 10 |
No 11 |
No 12 |
| Prior Y/Y |
1.7% |
1.9% |
1.8% |
... |
... |
... |
... |
... |
... |
... |
... |
... |
| Prior Revised |
... |
2.1% |
1.9% |
... |
... |
... |
... |
... |
... |
... |
... |
... |
| Consensus Y/Y |
... |
... |
... |
... |
... |
... |
... |
... |
... |
... |
... |
... |
| FHFA Y/Y |
1.9% |
1.8% |
1.6% |
... |
... |
... |
... |
... |
... |
... |
... |
... |
| RATING |
|
|
|
|
|
|
|
|
|
|
|
|
| Month For |
Nov 25 |
Dec 25 |
Jan-26 |
Feb-26 |
Mar-26 |
Apr-26 |
May-26 |
Jun-26 |
Jul-26 |
Aug-26 |
Sep-26 |
Oct-26 |
| |
|
|
|
|
|
|
|
|
|
|
|
|
|
|
| |
|
| |
|
|
|
|
|
|
|
|
|
|
|
Release Schedule | 2025 |
|
|
FHFA House Price Index | Real Estate |
|
Today's Week |
|
|
|
|
|
|
|
|
|
|
|
|
|
FHFA House Price Index (At 9:00)
| SCHEDULE 2025 |
No 1 |
No 2 |
No 3 |
No 4 |
No 5 |
No 6 |
No 7 |
No 8 |
No 9 |
No 10 |
No 11 |
No 12 |
| Release | Week |
|
|
|
|
|
|
|
|
|
|
|
|
| Release | Date |
|
|
|
|
|
|
|
|
|
|
|
|
| Release | Day |
|
|
|
|
|
|
|
|
|
|
|
|
|
|
|
|
|
|
|
|
|
|
|
|
|
| Prior |
0.4% |
0.3% |
0.4% |
0.2% |
0.1% |
-0.1% |
-0.4% |
-0.2% |
-0.2% |
-0.1% |
0.4% |
0.0% |
| Prior Revised: |
0.6% |
0.4% |
0.5% |
0.3% |
0.0% |
0.0% |
-0.3% |
-0.1% |
... |
0.0% |
... |
-0.1% |
| CONSENSUS |
... |
... |
... |
0.3% |
... |
... |
-0.1% |
... |
... |
... |
0.1% |
... |
| Consensus Low |
... |
... |
... |
0.3% |
... |
... |
-0.3% |
... |
... |
... |
0.1% |
... |
| Consensus High |
... |
... |
... |
0.4% |
... |
... |
-0.1% |
... |
... |
... |
0.2% |
... |
| FHFA M/M |
0.3% |
0.4% |
0.2% |
0.1% |
-0.1% |
-0.4% |
-0.2% |
-0.2% |
-0.1% |
0.4% |
0.0% |
0.4% |
| Month For |
Nov 24 |
Dec-24 |
Jan-25 |
Feb-25 |
Mar-25 |
Apr-25 |
May-25 |
Jun-25 |
Jul-25 |
Aug-25 |
Sep-25 |
Oct-25 |
| |
|
|
|
|
|
|
|
|
|
|
|
|
| FHFA Y/Y |
No 1 |
No 2 |
No 3 |
No 4 |
No 5 |
No 6 |
No 7 |
No 8 |
No 9 |
No 10 |
No 11 |
No 12 |
| Prior Y/Y |
4.5% |
4.2% |
4.7% |
4.8% |
3.9% |
3.7% |
3.0% |
2.8% |
2.6% |
2.3% |
2.3% |
1.7% |
| Prior Revised |
... |
4.5% |
4.8% |
5.0% |
... |
... |
... |
2.9% |
... |
... |
2.4% |
1.8% |
| Consensus Y/Y |
... |
... |
... |
... |
... |
... |
2.8% |
... |
... |
... |
... |
... |
| FHFA Y/Y |
4.2% |
4.7% |
4.8% |
3.9% |
3.7% |
3.0% |
2.8% |
2.6% |
2.3% |
2.3% |
1.7% |
1.7% |
| RATING |
|
|
|
|
|
|
|
|
|
|
|
|
| Month For |
Nov 24 |
Dec-24 |
Jan-25 |
Feb-25 |
Mar-25 |
Apr-25 |
May-25 |
Jun-25 |
Jul-25 |
Aug-25 |
Sep-25 |
Oct-25 |
| |
|
|
|
|
|
|
|
|
|
|
|
|
|
|
| |
|
| |
|
|
|
|
|
|
|
|
|
|
|
Release Schedule | 2024 |
|
|
FHFA House Price Index | Real Estate |
|
Today's Week |
|
|
|
|
|
|
|
|
|
|
|
|
|
FHFA House Price Index (At 9:00)
| SCHEDULE 2024 |
No 1 |
No 2 |
No 3 |
No 4 |
No 5 |
No 6 |
No 7 |
No 8 |
No 9 |
No 10 |
No 11 |
No 12 |
| Release | Week |
|
|
|
|
|
|
|
|
|
|
|
|
| Release | Date |
|
|
|
|
|
|
|
|
|
|
|
|
| Release | Day |
|
|
|
|
|
|
|
|
|
|
|
|
|
|
|
|
|
|
|
|
|
|
|
|
|
| Prior |
0.3% |
0.3% |
0.1% |
-0.1% |
1.2% |
0.1% |
0.2% |
0.0% |
-0.1% |
0.1% |
0.3% |
0.7% |
| Prior Revised: |
... |
0.4% |
... |
... |
... |
0.0% |
0.3% |
... |
0.0% |
0.2% |
0.4% |
... |
| CONSENSUS |
0.3% |
0.1% |
... |
0.1% |
0.5% |
0.3% |
0.3% |
... |
-0.1% |
0.1% |
0.2% |
... |
| Consensus Low |
0.2% |
0.0% |
... |
0.1% |
0.5% |
0.1% |
0.3% |
... |
-0.2% |
0.0% |
0.2% |
... |
| Consensus High |
0.3% |
0.2% |
... |
0.5% |
1.0% |
0.5% |
0.3% |
... |
0.2% |
0.2% |
0.3% |
... |
| FHFA M/M |
0.3% |
0.1% |
-0.1% |
1.2% |
0.1% |
0.2% |
0.0% |
-0.1% |
0.1% |
0.3% |
0.7% |
0.4% |
| Month For |
Nov 23 |
Dec-23 |
Jan-24 |
Feb-24 |
Mar-24 |
Apr-24 |
May-24 |
Jun-24 |
Jul-24 |
Aug-24 |
Sep-24 |
Oct-24 |
| |
|
|
|
|
|
|
|
|
|
|
|
|
| FHFA Y/Y |
No 1 |
No 2 |
No 3 |
No 4 |
No 5 |
No 6 |
No 7 |
No 8 |
No 9 |
No 10 |
No 11 |
No 12 |
| Prior Y/Y |
6.3% |
6.6% |
6.6% |
6.3% |
7.0% |
6.7% |
6.3% |
5.7% |
5.1% |
4.5% |
4.2% |
4.4% |
| Prior Revised |
... |
6.7% |
6.7% |
6.5% |
7.1% |
... |
6.5% |
5.9% |
5.3% |
4.7% |
4.2% |
... |
| Consensus Y/Y |
... |
... |
... |
... |
... |
... |
... |
... |
... |
... |
... |
... |
| FHFA Y/Y |
6.6% |
6.6% |
6.3% |
7.8% |
6.7% |
6.3% |
5.7% |
5.1% |
4.5% |
4.2% |
4.4% |
4.5% |
| RATING |
|
|
|
|
|
|
|
|
|
|
|
|
| Month For |
Nov 23 |
Dec-23 |
Jan-24 |
Feb-24 |
Mar-24 |
Apr-24 |
May-24 |
Jun-24 |
Jul-24 |
Aug-24 |
Sep-24 |
Oct-24 |
| |
|
|
|
|
|
|
|
|
|
|
|
|
|
|
| |
|
| |
|
|
|
|
|
|
|
|
|
|
|
Release Schedule | 2023 |
|
|
FHFA House Price Index | Real Estate |
|
Today's Week |
|
|
|
|
|
|
|
|
|
|
|
|
|
FHFA House Price Index (At 9:00)
| SCHEDULE 2023 |
No 1 |
No 2 |
No 3 |
No 4 |
No 5 |
No 6 |
No 7 |
No 8 |
No 9 |
No 10 |
No 11 |
No 12 |
| Release | Week |
|
|
|
|
|
|
|
|
|
|
|
|
| Release | Date |
|
|
|
|
|
|
|
|
|
|
|
|
| Release | Day |
|
|
|
|
|
|
|
|
|
|
|
|
|
|
|
|
|
|
|
|
|
|
|
|
|
| Prior: |
0.0% |
-0.1% |
-0.1% |
0.2% |
0.5% |
0.6% |
0.7% |
0.7% |
0.3% |
0.8% |
0.6% |
0.6% |
| Prior Revised: |
... |
... |
-0.1% |
0.1% |
0.7% |
0.5% |
... |
... |
0.4% |
|
0.7% |
0.7% |
| Consensus: |
... |
-0.3% |
-0.2% |
-0.1% |
0.3% |
0.4% |
... |
... |
... |
... |
0.4% |
0.5% |
| Consensus Low: |
... |
-0.4% |
-0.3% |
-0.4% |
0.2% |
0.3% |
... |
... |
... |
... |
0.3% |
0.4% |
| Consensus High: |
... |
-0.2% |
0.3% |
0.1% |
0.3% |
0.5% |
... |
... |
... |
... |
0.4% |
0.6% |
| FHFA M/M: |
-0.1% |
-0.1% |
0.2% |
0.5% |
0.6% |
0.7% |
0.7% |
0.3% |
0.8% |
0.6% |
0.6% |
0.3% |
| Month For |
...v 22 |
Dec 22 |
Jan-23 |
Feb-23 |
Mar-23 |
Apr-23 |
May-23 |
Jun-23 |
Jul-23 |
Aug-23 |
Sep-23 |
Oct-23 |
| |
|
|
|
|
|
|
|
|
|
|
|
|
| FHFA Y/Y |
No 1 |
No 2 |
No 3 |
No 4 |
No 5 |
No 6 |
No 7 |
No 8 |
No 9 |
No 10 |
No 11 |
No 12 |
| Prior Y/Y: |
9.3% |
8.2% |
6.6% |
5.3% |
4.0% |
3.6% |
3.1% |
2.8% |
3.1% |
4.6% |
5.6% |
6.1% |
| Prior Revised: |
... |
8.3% |
6.7% |
... |
4.3% |
3.7% |
... |
2.9% |
3.2% |
... |
5.8% |
6.2% |
| Consensus Y/Y: |
... |
... |
... |
... |
... |
... |
... |
... |
... |
... |
... |
... |
| FHFA Y/Y: |
8.2% |
6.6% |
5.3% |
4.0% |
3.6% |
3.1% |
2.8% |
3.1% |
4.6% |
5.6% |
6.1% |
6.3% |
| RATING |
|
|
|
|
|
|
|
|
|
|
|
|
| Month For: |
Nov 22 |
Dec 22 |
Jan-23 |
Feb-23 |
Mar-23 |
Apr-23 |
May-23 |
Jun-23 |
Jul-23 |
Aug-23 |
Sep-23 |
Oct-23 |
| |
|
|
|
|
|
|
|
|
|
|
|
|
|
|
| |
|
| |
|
|
|
|
|
|
|
|
|
|
|
Release Schedule | 2022 |
|
|
FHFA House Price Index | Real Estate |
|
Today's Week |
|
|
|
|
|
|
|
|
|
|
|
|
|
FHFA House Price Index (At 9:00)
| SCHEDULE 2022 |
No 1 |
No 2 |
No 3 |
No 4 |
No 5 |
No 6 |
No 7 |
No 8 |
No 9 |
No 10 |
No 11 |
No 12 |
| Release | Week |
|
|
|
|
|
|
|
|
|
|
|
|
| Release | Date |
|
|
|
|
|
|
|
|
|
|
|
|
| Release | Day |
|
|
|
|
|
|
|
|
|
|
|
|
|
|
|
|
|
|
|
|
|
|
|
|
|
| Prior |
1.1% |
1.1% |
1.2% |
1.6% |
2.1% |
1.5% |
1.6% |
1.4% |
0.1% |
-0.6% |
-0.7% |
0.1% |
| Prior Revised: |
... |
1.2% |
1.3% |
... |
1.9% |
1.6% |
1.5% |
1.3% |
0.1% |
... |
... |
... |
| CONSENSUS |
1.0% |
1.0% |
... |
1.6% |
1.9% |
... |
... |
0.9% |
0.0% |
-0.7% |
-1.0% |
-0.5% |
| Consensus Low |
0.8% |
0.9% |
... |
1.4% |
1.8% |
... |
... |
0.8% |
-0.1% |
-0.7% |
-1.3% |
-0.7% |
| Consensus High |
1.1% |
1.0% |
... |
1.7% |
2.0% |
... |
... |
1.1% |
0.1% |
-0.3% |
-0.7% |
-0.3% |
| FHFA M/M |
1.1% |
1.2% |
1.6% |
2.1% |
1.5% |
1.6% |
1.4% |
0.1% |
-0.6% |
-0.7% |
0.1% |
0.0% |
|
|
|
|
|
|
|
|
|
|
|
|
|
| Prior: |
17.5% |
17.5% |
17.6% |
18.2% |
19.4% |
19.0% |
18.8% |
18.3% |
16.2% |
13.9% |
11.9% |
11.0% |
| Prior Revised: |
... |
... |
17.6% |
... |
19.3% |
19.1% |
18.9% |
... |
16.3% |
... |
12.0% |
11.1% |
| Consensus Y/Y: |
17.4% |
17.5% |
... |
... |
19.7% |
... |
... |
... |
16.0% |
... |
... |
9.1% |
| FHFA Y/Y: |
17.5% |
17.6% |
18.2% |
19.4% |
19.0% |
18.8% |
18.3% |
16.2% |
13.9% |
11.9% |
11.0% |
9.8% |
| RATING |
|
|
|
|
|
|
|
|
|
|
|
|
| Month For: |
Nov 21 |
Dec 21 |
Jan-22 |
Feb-22 |
Mar-22 |
Apr-22 |
May-22 |
Jun-22 |
Jul-22 |
Aug-22 |
Sep-22 |
Oct-22 |
| |
|
|
|
|
|
|
|
|
|
|
|
|
|
|
| |
|
| |
|
|
|
|
|
|
|
|
|
|
|
Release Schedule | 2021 |
|
|
FHFA House Price Index | Real Estate |
|
Today's Week |
|
|
|
|
|
|
|
|
|
|
|
|
|
FHFA House Price Index (At 9:00)
| SCHEDULE 2021 |
No 1 |
No 2 |
No 3 |
No 4 |
No 5 |
No 6 |
No 7 |
No 8 |
No 9 |
No 10 |
No 11 |
No 12 |
| Release | Week |
|
|
|
|
|
|
|
|
|
|
|
|
| Release | Date |
|
|
|
|
|
|
|
|
|
|
|
|
| Release | Day |
|
|
|
|
|
|
|
|
|
|
|
|
|
|
|
|
|
|
|
|
|
|
|
|
|
| Prior |
0.5% |
1.0% |
1.1% |
1.0% |
0.9% |
1.4% |
1.8% |
1.7% |
1.6% |
1.4% |
1.0% |
0.9% |
| Prior Revised: |
... |
... |
... |
... |
1.1% |
1.6% |
... |
... |
... |
... |
... |
... |
| CONSENSUS |
0.7% |
0.8% |
1.0% |
0.9% |
1.0% |
1.2% |
1.8% |
... |
1.5% |
... |
1.0% |
0.7% |
| Consensus Low |
0.3% |
0.6% |
0.5% |
0.8% |
0.7% |
0.8% |
1.3% |
... |
1.0% |
... |
1.0% |
0.6% |
| Consensus High |
0.9% |
1.0% |
1.0% |
1.1% |
1.4% |
1.5% |
1.8% |
... |
1.6% |
... |
1.2% |
0.7% |
| FHFA M/M |
1.0% |
1.1% |
1.0% |
0.9% |
1.4% |
1.8% |
1.7% |
1.6% |
1.4% |
1.0% |
0.9% |
1.1% |
|
|
|
|
|
|
|
|
|
|
|
|
|
| FHFA Y/Y: |
11.1% |
11.4% |
12.0% |
12.2% |
13.9% |
15.7% |
18.0% |
18.8% |
19.2% |
18.5% |
17.7% |
17.5% |
| RATING |
|
|
|
|
|
|
|
|
|
|
|
|
| Month For: |
Nov-20 |
Dec-20 |
Jan-21 |
Feb-21 |
Mar-21 |
Apr-21 |
May-21 |
Jun-21 |
Jul-21 |
Aug-21 |
Sep-21 |
Oct-21 |
|
|
|
|
|
|
|
|
|
|
|
|
|
|
|
| |
|
| |
|
Legends: |
 |
Delayed |
 |
Positive View |
 |
Negative View |
 |
Neutral View |
 |
Non Available |
|
|
|
|
|
|
|
|
|
|
|
|
|
|
|
|
|
|
|
|
| |
|
|
|
|
|
|
|
|
|
|
|
|
|
|
|
|
|
|
|
|
|
Brief News | 2026 |
|
|
FHFA House Price Index | Real Estate |
|
Today's Week |
|
|
|
|
|
|
|
|
|
|
|
|
|
S&P Case-Shiller HPI (At 9:00 a.m ET)
| DATE/WEEK |
HIGHLIGHTS |
FOR |
Y/Y |
|
FHFA |
No 12 |
... |
|
Oct-2026 |
|
| |
|
|
|
FHFA |
No 11 |
... |
|
Sep-2026 |
|
| |
|
|
|
FHFA |
No 10 |
... |
|
Aug-2026 |
|
| |
|
|
|
FHFA |
No 9 |
... |
|
Jul-2026 |
|
| |
|
|
|
FHFA |
No 8 |
... |
|
Jun-2026 |
|
| |
|
|
|
FHFA |
No 7 |
... |
|
May-2026 |
|
| |
|
|
|
FHFA |
No 6 |
... |
|
Apr-2026 |
|
| |
|
|
|
FHFA |
No 5 |
... |
|
Mar-2026 |
|
| |
|
|
|
FHFA |
No 4 |
... |
|
Feb-2026 |
|
| |
|
|
|
FHFA |
No 3 |
... |
|
Jan-2026 |
|
| |
|
|
|
FHFA |
No 2 |
... |
|
Dec-2025 |
|
| |
|
|
|
FHFA |
No 1 |
1.9% |
|
Nov-2025 |
|
| |
|
|
|
|
|
|
|
|
| |
|
|
|
|
|
| |
|
|
|
|
|
|
|
|
|
|
|
|
|
|
|
Brief News | 2025 |
|
|
FHFA House Price Index | Real Estate |
|
Today's Week |
|
|
|
|
|
|
|
|
|
|
|
|
|
FHFA House Pricde index | Real Estate
| DATE/WEEK |
HIGHLIGHTS |
FOR |
Y/Y |
|
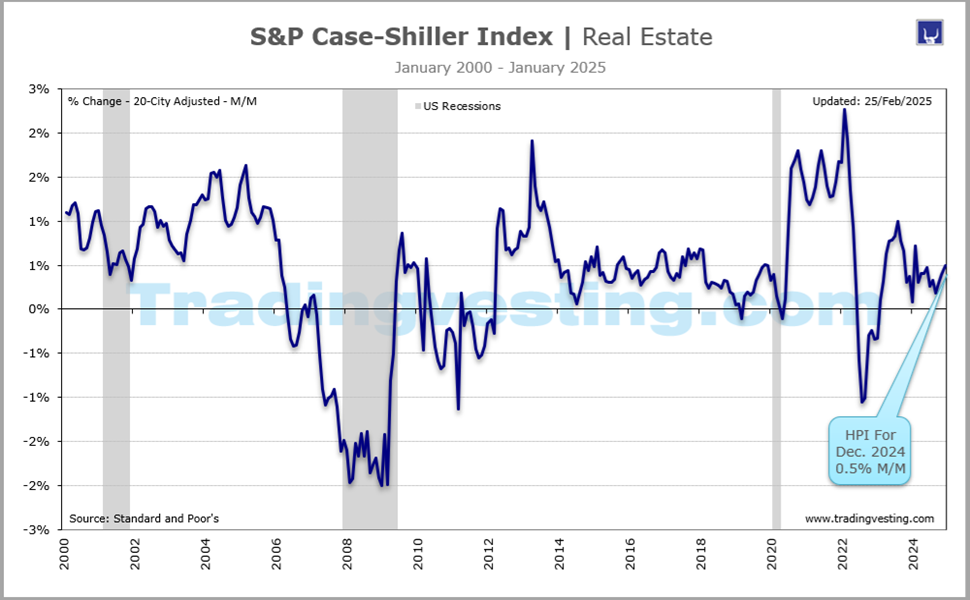
In October 2025, the S&P Cotality Case-Shiller U.S. National Home Price NSA Index showed a 1.4% year-over-year increase, continuing a trend of cooling price growth. The national index stood at 328.98, while the 20-City Composite rose 1.3% annually, as high mortgage rates slowed market momentum and caused broad monthly declines across most cities. |
No 12 |
1.7% |
|
Oct-2025 |
|
| |
|
|
|
n September 2025, the U.S. FHFA House Price Index (seasonally adjusted) was unchanged (0.0%) month-over-month, following a 0.4% increase in August. Year-over-year, home prices rose 1.7% in September, with regional performance showing a -0.7% to +5.3% variation. The Q3 2025 appreciation was 0.2% quarter-over-quarte |
No 11 |
1.7% |
|
Sep-2025 |
|
| |
|
|
|
U.S. house prices rose 0.4 percent in August, according to the U.S. Federal Housing (FHFA) seasonally adjusted monthly House Price Index (FHFA HPI®). House prices rose 2.3 percent from August 2024 to August 2025. The previously reported 0.1 percent price decline in July was revised to 0.0 percent. National house prices rose 0.4% from July to August, according to House Price Index (HPI) data released Tuesday by the Federal Housing Finance Agency (FHFA). House prices rose 2.3% annually in August, the same rate of growth observed in July. House prices rose 4.2% from August 2023 to August 2024, however, reflecting the cooling trend underway nationwide. |
No 10 |
2.3% |
|
Aug-2025 |
|
| |
|
|
|
U.S. house prices, as measured by the FHFA Seasonally Adjusted Monthly House Price Index, fell 0.1% in July b compared to the previous month. Despite this monthly decline, house prices recorded a 2.3% increase compared to July 2024, continuing a pattern of slowed annual appreciation. |
No 9 |
2.3% |
|
Jul-2025 |
|
| |
|
|
|
In June 2025, U.S. house prices based on the FHFA seasonally adjusted monthly index fell by 0.2% to 0.4% compared to May, marking a continued slight decline. Despite this, home prices increased by 2.6% to 3.0% year-over-year. The data indicates weakening monthly price momentum while annual appreciation remained positive, with regional variations. |
No 8 |
2.6% |
|
Jun-2025 |
|
| |
|
|
|
U.S. house prices in May 2025 fell by 0.2% on a seasonally adjusted monthly basis, according to the FHFA HPI®. Despite the monthly decline, house prices grew 2.8% from May 2024 to May 2025, showing sustained, though slowing, annual appreciation. This indicates a cooling market, with prices adjusting to higher mortgage rates. |
No 7 |
2.8% |
|
May-2025 |
|
| |
|
|
|
U.S. house prices in April 2025 fell by 0.4% month-over-month, marking the first monthly decline since August 2022, while increasing 3.0% year-over-year. The FHFA HPI® report indicated a slowdown in annual growth compared to March 2025, with the lowest year-over-year appreciation rate since May 2023. |
No 6 |
3.0% |
|
Apr-2025 |
|
| |
|
|
|
U.S. house prices in March 2025 showed signs of stabilization, with the FHFA seasonally adjusted monthly index falling by 0.1% month-over-month and rising 3.7% year-over-year. This marks a deceleration in annual appreciation, with the first quarter of 2025 showing a 0.7% increase over the fourth quarter of 2024. |
No 5 |
3.7% |
|
Mar-2025 |
|
| |
|
|
|
U.S. house prices increased by 0.1% in February 2025 (seasonally adjusted) and rose 3.9% year-over-year compared to February 2024, according to FHFA (2025). Regional performance varied significantly, ranging from a 0.8% decrease in the Pacific division to a 1.3% increase in the New England division |
No 4 |
3.9% |
|
Feb-2025 |
|
| |
|
|
|
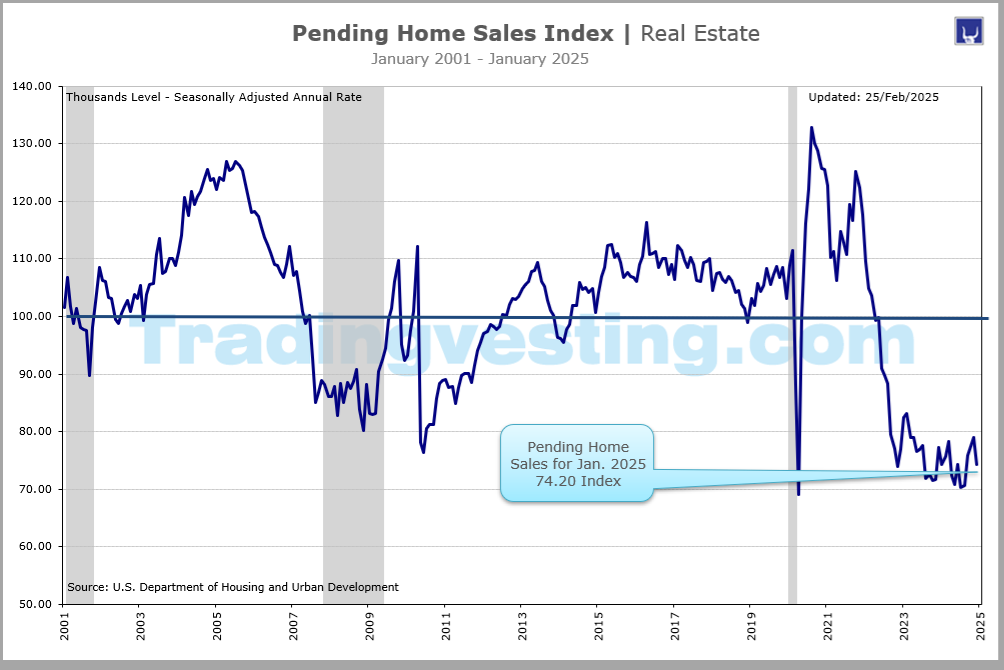
U.S. house prices rose by 0.2% in January 2025 according to the FHFA seasonally adjusted monthly House Price Index, with a 4.8% increase compared to January 2024. This indicates continued, albeit slower, home price growth, with significant regional variations ranging from -0.8% in the South Atlantic to +1.0% in the West North Central division. |
No 3 |
4.8% |
|
Jan-2025 |
|
| |
|
|
|
In December 2024, the U.S. FHFA House Price Index (HPI) rose by 0.4% month-over-month, marking 11 consecutive monthly gains and bringing the index to 436.1. On a year-over-year basis, national house prices increased by 4.7%. This sustained growth was driven by continued inventory shortages. |
No 2 |
4.7% |
|
Dec-2024 |
|
| |
|
|
|
U.S. house prices increased by 0.3% in November 2024, according to the Federal Housing Finance Agency (FHFA) seasonally adjusted monthly House Price Index (HPI®). On an annual basis, home prices rose 4.2% from November 2023 to November 2024, reflecting a deceleration in growth compared to previous periods. |
No 1 |
4.2% |
|
Nov-2024 |
|
| |
|
|
|
|
|
|
|
|
| |
|
|
|
|
|
| |
|
|
|
|
|
|
|
|
|
|
|
|
|
|
|
Brief News | 2024 |
|
|
FHFA House Price Index | Real Estate |
|
Today's Week |
|
|
|
|
|
|
|
|
|
|
|
|
|
FHFA House Pricde index | Real Estate
| DATE/WEEK |
HIGHLIGHTS |
FOR |
Y/Y |
|
U.S. house prices in October 2024 (reported by FHFA in late 2024) continued to rise, with an increase of 0.3% in August and a continued upward trend in the fall. Annually, house prices b from August 2023 to August 2024 and by 4.3% over the year ending in the third quarter of 2024. The FHFA House Price Index for October 2024 showed that U.S. house prices rose 0.4% on a seasonally adjusted monthly basis and were up 4.5% annually from October 2023. |
No 12 |
4.5% |
|
Oct-2024 |
|
| |
|
|
|
U.S. House Prices Rise 4.4 Percent over the Prior Year; Up 0.7 Percent from the Second Quarter of 2024. U.S. house prices rose 4.3 percent between the third quarter of 2023 and the third quarter of 2024, according to the Federal Housing Finance Agency (FHFA) House Price Index (FHFA HPI®). House prices were up 0.7 percent compared to the second quarter of 2024. FHFA’s seasonally adjusted monthly index for September was up 0.7 percent from August. U.S. house price growth slowed in the third quarter, continuing a trend that started in the fourth quarter of the previous year. While house prices continued to increase because housing demand outpaced the locked-in housing supply, elevated house prices and mortgage rates likely contributed to the slowdown in price growth. |
No 11 |
4.4% |
|
Sep-2024 |
|
| |
|
|
|
U.S. house prices rose by 0.3% in August 2024, continuing a trend of modest growth, while marking a 4.2% increase from August 2023, according to the FHFA monthly House Price Index (HPI®). The July 2024 price change was revised upward to a 0.2% increase. |
No 10 |
|
|
Aug-2024 |
|
| |
|
|
|
U.S. house prices increased by 0.1% in July 2024, showing a slight rise on a monthly basis while overall, they rose 4.5% year-over-year. According to the Federal Housing Finance Agency (FHFA), the annual appreciation rate was the slowest since June 2023, signaling a cooling market, with prices for June 2024 revised from a decrease to 0.0%. |
No 9 |
4.5% |
|
Jul-2024 |
|
| |
|
|
|
The Federal Housing Finance Agency (FHFA) house price index (HPI) unexpectedly declined to 424.5 in June, just below the all-time high of 424.8 from the previous month. U.S. home prices were down 0.1% from the previous month and are up 5.1% from one year ago. House prices dipped 0.1% on a month-on-month basis after being unchanged in May, the Federal Housing Finance Agency said on Tuesday. They increased 5.1% in the 12 months through June, the smallest year-on-year rise since July 2023, after advancing by an upwardly revised 5.9% in May. The rise in annual house prices was previously reported to have been 5.7% in May. |
No 8 |
5.1% |
|
Jun-2024 |
|
| |
|
|
|
US home prices unchanged in May; annual gain smallest in 10 months. U.S. single-family home prices were unchanged in May and the annual increase was the smallest in 10 months as higher mortgage rates stifled demand, boosting housing supply. The unchanged reading in house prices followed a 0.3% month-on-month rise in April, the Federal Housing Finance Agency said on Tuesday. In the 12 months through May, house prices increased 5.7%. That was the smallest year-on-year advance since July 2023 and followed a 6.5% gain in April. A surge in mortgage rates in spring depressed sales, pushing existing homes inventory to the highest level in nearly four years in June. New single-family housing supply jumped to the highest level since February 2008. |
No 7 |
5.7% |
|
May-2024 |
|
| |
|
|
|
U.S. single-family home prices increased at a steady clip in April, but momentum could slow as higher borrowing costs weigh on demand for housing, contributing to a rise in supply. House prices rose 0.2% month-on-month after being unchanged in March, the Federal Housing Finance Agency said on Tuesday. In the 12 months through April house prices increased 6.3% after advancing 6.7% in March. |
No 6 |
6.3% |
|
Apr-2024 |
|
| |
|
|
|
U.S. house price growth slowed sharply in March, likely as rising mortgage rates weighed on demand, data showed on Tuesday. Prices edged up 0.1% in March after surging by an unrevised 1.2% in February, the Federal Housing Finance Agency said in its monthly report on home prices. On a year-over-year basis, prices increased 6.7% in March after advancing 7.1% in February. |
No 5 |
6.7% |
|
Mar-2024 |
|
| |
|
|
|
U.S. home prices leapt in February by the most in nearly two years, federal housing authorities reported on Tuesday, reflecting the effects that lean home supply continue to have on the nation's housing market. Prices climbed 1.2% in February from January, the largest month-to-month increase since April 2022, the Federal Housing Finance Agency said in its monthly report on home prices. On a year-over-year basis, prices climbed 7%, the swiftest increase since November 2022. |
No 4 |
7.0% |
|
Feb-2024 |
|
| |
|
|
|
U.S. annual home prices rose at a slower rate in January and slipped on a monthly basis for the first time in 17 months, data released Tuesday showed. Home prices grew 6.3% on a yearly basis from an upwardly revised 6.7% in December, a Federal Housing Finance Agency (FHFA) report said, marking the first annual price deceleration since last May. On a monthly basis, home prices fell for the first time since August 2022 by 0.1% in January, reversing a 0.1% gain in December. Despite the slowdown, annual price growth remains near the historical average, said Dr. Anju Vajja deputy director at FHFA's Division of Research and Statistics. |
No 3 |
6.3% |
|
Jan-2024 |
|
| |
|
|
|
US annual home prices rising despite fourth-quarter slowdown, FHFA says. U.S. annual home prices rose again in December, although housing price growth slowed during the fourth quarter of 2023 from the prior three-month period. Home prices grew 6.6% on a yearly basis from an upwardly revised 6.7% in November, a survey released by the Federal Housing Finance Agency (FHFA) showed on Tuesday. The slight decrease in appreciation followed on the heels of the swiftest annual growth in November since December 2022. On a monthly basis, home prices increased 0.1% in December from an upwardly revised 0.4% in November. |
No 2 |
6.6% |
|
Dec-2023 |
|
| |
|
|
|
U.S. home prices rose in November at the swiftest annual rate in 11 months, indicating a recovery in the housing market may be taking hold. Home prices grew 6.6% on a yearly basis after rising by 6.3% the month before, the Federal Housing Finance Agency (FHFA) said on Tuesday. That was the strongest annual growth since December 2022, when prices rose 6.8%. Annual home price gains have been picking up speed, although home sales rates have remained subdued due to lack of inventory and high mortgage rates. Prices increased 0.3% on a month-to-month basis in November, unchanged from October's growth rate. |
No 1 |
6.6% |
|
Nov-2023 |
|
| |
|
|
|
|
|
|
|
|
| |
|
|
|
|
|
| |
|
|
|
|
|
|
|
|
|
|
|
|
|
|
|
Brief News | 2023 |
|
|
FHFA House Price Index | Real Estate |
|
Today's Week |
|
|
|
|
|
|
|
|
|
|
|
|
|
FHFA House Pricde index | Real Estate
| DATE/WEEK |
HIGHLIGHTS |
FOR |
ACTUAL |
|
Annual home prices in October rose again, pointing toward continued recovery of the housing market, data on Tuesday showed. A Federal Housing Finance Agency (FHFA) report showed home prices grew 6.3% on a yearly basis, up from a revised 6.2% the month prior. Annual price growth began to accelerate in June after declining steadily since February 2022. Prices increased moderately by 0.3% on a month-to-month basis after climbing by 0.7% the month before. Rates on the most common home loan neared 8% in October, reaching a two-decade high on the back of the Federal Reserve's rate hike cycle. |
No 12 |
6.3% |
|
Oct-2023 |
|
| |
|
|
|
US annual home price growth at 6.1% in September, FHFA says. US annual home price growth accelerated again in September, underscoring the rebound of the housing market as it entered the final quarter of the year, data showed on Tuesday (Nov 28). Home prices rose 6.1 per cent on a year-over-year basis in September, up from an upwardly revised 5.8 per cent increase in the prior month, the Federal Housing Finance Agency (FHFA) said. On a quarterly basis, annual house prices increased 5.5 per cent between the third quarter of last year and the comparative period this year. |
No 11 |
6.1% |
|
Sep-2023 |
|
| |
|
|
|
U.S. annual home price growth accelerated for a third straight month in August, underscoring the recovery of the housing market after a period of softening, data showed on Tuesday. Home prices rose 5.6% on a year-over-year basis in August, up from a 4.6% increase in the prior month, the Federal Housing Finance Agency (FHFA) said. The June reading had marked the first acceleration in annual house price growth since February 2022. The report also showed prices rose moderately on a month-over-month basis, in line with the trend over the past quarter. Prices were up 0.6% in August, compared with a 0.8% month-over-month increase in July. |
No 10 |
|
|
Aug-2023 |
|
| |
|
|
|
U.S. annual home price growth accelerated for a second straight month in July, signaling that softening prices in the market may be bottoming out, according to a report released on Tuesday. Home purchase prices increased 4.6% on a year-over-year basis in July, up from a revised 3.2% increase in the prior month. June marked the first acceleration in annual price growth since February 2022, the Federal Housing Finance Agency (FHFA) said. The report also showed prices rose moderately on a month-over-month basis, in line with the trend over the past quarter. Prices were up 0.8% in July, compared with a revised 0.4% month-over-month increase in June. |
No 9 |
4.6% |
|
Jul-2023 |
|
| |
|
|
|
U.S. house prices rose 17.7 percent from the second quarter of 2021 to the second quarter of 2022 according to the Federal Housing Finance Agency House Price Index (FHFA HPI®). House prices were up 4.0 percent compared to the first quarter of 2022. FHFA’s seasonally adjusted monthly index for June was up 0.1 percent from May.Housing prices grew quickly through most of the second quarter of 2022, but a deceleration has appeared in the June monthly data. The pace of growth has subsided recently, which is consistent with other recent housing data. |
No 8 |
3.1% |
|
Jun-2023 |
|
| |
|
|
|
U.S. House Prices Experience Moderate Rise, FHFA Index Reveals. Index reflects a mixed bag of regional growth and decline in May 2023. The latest Federal Housing Finance Agency’s House Price Index (HPI) released today found U.S. house prices witnessed a modest rise of 0.7% in May compared to April. The HPI, which is seasonally adjusted, further reveals a year-over-year increase of 2.8% from May 2022 to May 2023. Across the nine census divisions, the seasonally adjusted monthly price changes from April to May 2023 ranged from a decline of 0.5% in New England to a notable rise of 1.7% in the Pacific division. The 12-month changes were quite variable as well, with the Mountain division showing a decrease of 2.7% while the East North Central division enjoyed a robust growth of 5.5%. |
No 7 |
2.8% |
|
May-2023 |
|
| |
|
|
|
U.S. house prices increased moderately in April: FHFA. However, prices in some regions continued to decline on a year-over-year basis, according to the FHFA. U.S. house prices rose slightly in April, up 0.7% from March, according to the Federal Housing Finance Agency (FHFA) seasonally adjusted monthly House Price Index (HPI). On a year-over-year basis, prices rose 3.1 % from April 2022 to April 2023. Additionally, the previously reported 0.6% increase in March was revised downward to 0.5%. |
No 6 |
3.1% |
|
Apr-2023 |
|
| |
|
|
|
FHFA House Price Index hits an all-time high. Total active listings are still near all-time lows. On Tuesday the FHFA House Price Index hit an all-time high. In this article I’ll explain why this is happening and why we still have a savagely unhealthy housing market. The quick takeaway here is that total active listings in the U.S. are still near all-time lows and the demand has stabilized. If home sales were crashing at the same pace they were last year, we would all be having a different discussion. This is why I have stressed that Nov. 9, 2022, was an inflection point in housing. It’s not because demand has rebounded in a big way, it’s just that home sales stopped collapsing as they did in 2022. |
No 5 |
3.6% |
|
Mar-2023 |
|
| |
|
|
|
The FHFA house price index is up 0.5 percent in February from January after a small downward revision to up 0.1 percent in January from December. The index is up 4.0 percent compared to a year ago. Home values for resales and refinancings are higher than anticipated. The Econoday survey consensus looked for prices to decline 0.1 percent in February. The readings suggest that demand for existing homes combined with a dip in mortgage rates early in 2023 have helped keep prices higher despite the overall slowdown in the housing market. The year-over-year pace of increases is the lowest since 4.0 percent in September 2014. The data suggest that declines in home prices have bottomed out while going forward price increases should be modest. |
No 4 |
4.0% |
|
Feb-2023 |
|
| |
|
|
|
On the FHFA index: FHFA House Price Index Up 0.2 Percent in January; Up 5.3 Percent from Last Year. U.S. house prices rose in January, up 0.2 percent from December, according to the Federal Housing Finance Agency (FHFA) seasonally adjusted monthly House Price Index (HPI®). House prices rose 5.3 percent from January 2022 to January 2023. The previously reported 0.1 percent price decline in December 2022 remained unchanged. For the nine census divisions, seasonally adjusted monthly price changes from December 2022 to January 2023 ranged from -0.6 percent in the Pacific division to +2.0 percent in the New England division. The 12-month changes were -1.5 percent in the Pacific division to +9.6 percent in the South Atlantic division. |
No 3 |
5.3% |
|
Jan-2023 |
|
| |
|
|
|
A separate report from the Federal Housing Finance Agency on Tuesday showed home prices advanced 6.6% in the 12 months through December, the smallest rise since June 2020, after increasing 8.2% in November. They increased 6.6% in 2022 compared to a gain of 18.0% in 2021. While higher mortgage are hurting demand and cooling house price inflation, the FHFA noted that "these negative pressures were partially offset by historically low inventory." |
No 2 |
6.6% |
|
Dec-2022 |
|
| |
|
|
|
House prices fell 0.1 percent nationwide in November compared to October, according to the latest Federal Housing Finance Agency (FHFA) House Price Index (HPI®). House prices rose 8.2 percent from November 2021 to November 2022. |
No 1 |
8.2% |
|
Nov-2022 |
|
| |
|
|
|
|
|
|
|
|
| |
|
|
|
|
|
| |
|
|
|
|
|
|
|
|
|
|
|
|
|
|
|
Brief News | 2022 |
|
|
FHFA House Price Index | Real Estate |
|
Today's Week |
|
|
|
|
|
|
|
|
|
|
|
|
|
FHFA House Pricde index | Real Estate
| DATE/WEEK |
HIGHLIGHTS |
FOR |
Y/Y |
|
The Federal Housing Finance Agency, which oversees U.S. mortgage-finance entities Fannie Mae and Freddie Mac, said annual home price growth slowed to 9.8 percent in October from 11.1 percent in September, marking that index’s first non-double-digit gain since September 2020. The Federal Housing Finance Agency (FHFA) has released its U.S. House Price Index (HPI) for October. Here is the opening of the press release: U.S. house prices rose 12.4 percent from the third quarter of 2021 to the third quarter of 2022 according to the Federal Housing Finance Agency House Price Index (FHFA HPI®). House prices were up 0.1 percent compared to the second quarter of 2022. FHFA’s seasonally adjusted monthly index for September was up 0.1 percent from August. |
No 12 |
9.8% |
|
Oct-2022 |
|
| |
|
|
|
A separate report from the Federal Housing Finance Agency showed home prices edged up 0.1% on a monthly basis in September after declining 0.7% in August. In the 12 months through September, prices climbed 11.0% after advancing 12.0% in August. “The rate of U.S. house price growth has substantially decelerated,” said William Doerner, supervisory economist in FHFA’s Division of Research and Statistics. “This deceleration is widespread with about one-third of all states and metropolitan statistical areas registering annual growth below 10%.” The 30-year fixed mortgage rate breached 7% in October for the first time since 2002, data from mortgage finance agency Freddie Mac showed. Though the rate retreated to an average of 6.58% last week, it remains well above the 3.10% average during the same period last year. “As the Fed continues to move interest rates higher, mortgage financing continues to be more expensive and housing becomes less affordable,” Craig Lazzara, managing director at S&P DJI, said in a statement. “Given the continuing prospects for a challenging macroeconomic environment, home prices may well continue to weaken.” |
No 11 |
11.0% |
|
Sep-2022 |
|
| |
|
|
|
U.S. annual home price growth accelerated for a third straight month in August, underscoring the recovery of the housing market after a period of softening, data showed on Tuesday. Home prices rose 5.6% on a year-over-year basis in August, up from a 4.6% increase in the prior month, the Federal Housing Finance Agency (FHFA) said. The June reading had marked the first acceleration in annual house price growth since February 2022. The report also showed prices rose moderately on a month-over-month basis, in line with the trend over the past quarter. Prices were up 0.6% in August, compared with a 0.8% month-over-month increase in July. A third report from the Federal Housing Finance Agency showed home prices increased 11.9% in the 12 months through August after rising 13.9% in July. Prices fell 0.7% on a monthly basis after decreasing 0.6% in July. It was the first time since March 2011 that monthly prices posted back-to-back declines. |
No 10 |
11.9% |
|
Aug-2022 |
|
| |
|
|
|
Both the Case-Shiller House Price Index (HPI) and the Federal Housing Finance Agency (FHFA) HPI for July 2022 were released today.
On the FHFA index: FHFA House Price Index Down 0.6 Percent in July; Up 13.9 Percent from Last Year. House prices fell nationwide in July, down 0.6 percent from the previous month, according to the latest Federal Housing Finance Agency House Price Index (FHFA HPI®). House prices rose 13.9 percent from July 2021 to July 2022. |
No 9 |
13.9% |
|
Jul-2022 |
|
| |
|
|
|
U.S. house prices rose 17.7 percent from the second quarter of 2021 to the second quarter of 2022 according to the Federal Housing Finance Agency House Price Index (FHFA HPI®). House prices were up 4.0 percent compared to the first quarter of 2022. FHFA’s seasonally adjusted monthly index for June was up 0.1 percent from May.Housing prices grew quickly through most of the second quarter of 2022, but a deceleration has appeared in the June monthly data. The pace of growth has subsided recently, which is consistent with other recent housing data. |
No 8 |
16.2% |
|
Jun-2022 |
|
| |
|
|
|
Home prices in two regions are down from last year: FHFA. Home prices in the Pacific and Mountain West divisions are negative over the past 12 months, FHFA data shows. U.S. house prices rose slightly in May, up 0.7% from April, according to the Federal Housing Finance Agency (FHFA) seasonally adjusted monthly House Price Index (HPI). On a year-over-year basis, prices rose 2.8% from May 2022 to May 2023. But that only tells part of the story. |
No 7 |
18.3% |
|
May-2022 |
|
| |
|
|
|
U.S. House Prices Rise 18.7 Percent over the Last Year; Up 4.6 Percent from the Fourth Quarter. U.S. house prices rose 18.7 percent from the first quarter of 2021 to the first quarter of 2022 according to the Federal Housing Finance Agency House Price Index (FHFA HPI®). House prices were up 4.6 percent compared to the fourth quarter of 2021. FHFA’s seasonally adjusted monthly index for March was up 1.5 percent from February. High appreciation rates continued across housing markets during the first quarter of 2022. Strong demand coupled with tight supply have kept prices climbing. Through the end of March, higher mortgage rates have not yet translated into slower price gains, but new home sales have dropped during the last few months, with a significant falloff in April. |
No 6 |
18.8% |
|
Apr-2022 |
|
| |
|
|
|
U.S. House Prices Rise 18.7 Percent over the Last Year; Up 4.6 Percent from the Fourth Quarter. U.S. house prices rose 18.7 percent from the first quarter of 2021 to the first quarter of 2022 according to the Federal Housing Finance Agency House Price Index (FHFA HPI®). House prices were up 4.6 percent compared to the fourth quarter of 2021. FHFA’s seasonally adjusted monthly index for March was up 1.5 percent from February. High appreciation rates continued across housing markets during the first quarter of 2022. Strong demand coupled with tight supply have kept prices climbing. Through the end of March, higher mortgage rates have not yet translated into slower price gains, but new home sales have dropped during the last few months, with a significant falloff in April. |
No 5 |
19.0% |
|
Mar-2022 |
|
| |
|
|
|
House prices rose nationwide in February, up 2.1 percent from the previous month, according to the latest Federal Housing Finance Agency House Price Index (FHFA HPI®). House prices rose 19.4 percent from February 2021 to February 2022. The previously reported 1.6 percent price change for January 2022 remained unchanged. For the nine census divisions, seasonally adjusted monthly house price changes from January 2022 to February 2022 ranged from +1.3 percent in the East North Central division to +2.9 percent in the South Atlantic division. The 12-month changes ranged from +15.3 percent in the East North Central division to +24.3 percent in the Mountain division. |
No 4 |
19.4% |
|
Feb-2022 |
|
| |
|
|
|
FHFA numbers come in slightly lower than S&P CoreLogic Case-Shiller index. The rise in house prices continues apace nationwide based on two reports released this morning. January 2022 housing prices increased 1.6% in January 2022, from December 2021. Year over year, they jumped at least 18.2%.. However, the S&P CoreLogic Case-Shiller U.S. National Home Price NSA Index, covering all nine U.S. census divisions, reported a 19.2% annual gain in January, up from 18.9% in the previous month. The difference in numbers comes from how the data is collected. The FHFA HPI uses nominal, seasonally adjusted, purchase-only data from Fannie Mae and Freddie Mac. The S&P CoreLogic Case-Shiller U.S. National Home Price Index tracks the value of single-family housing within the United States. House price trends notched up slightly in January 2022. |
No 3 |
18.2% |
|
Jan-2022 |
|
| |
|
|
|
U.S. House Prices Rise 17.5 Percent over the Last Year; Up 3.3 Percent from the Third Quarter. U.S. house prices rose 17.5 percent from the fourth quarter of 2020 to the fourth quarter of 2021 according to the Federal Housing Finance Agency House Price Index (FHFA HPI®). House prices were up 3.3 percent compared to the third quarter of 2021. FHFA's seasonally adjusted monthly index for December was up 1.2 percent from November. |
No 2 |
17.6% |
|
Dec-2021 |
|
| |
|
|
|
House prices rose nationwide in November, up 1.1 percent from the previous month, according to the latest Federal Housing Finance Agency House Price Index (FHFA HPI®). House prices rose 17.5 percent from November 2020 to November 2021. The previously reported 1.1 percent price change for October 2021 remained unchanged. FHFA will release its next HPI report on February 22, 2022, with monthly data through December 2021 and quarterly data through the fourth quarter of 2021. |
No 1 |
17.5% |
|
Nov-2021 |
|
| |
|
|
|
|
|
|
|
|
| |
|
|
|
|
|
| |
|
|
|
|
|
|
|
|
|
|
|
|
|
|
|
Brief News | 2021 |
|
|
FHFA House Price Index | Real Estate |
|
Today's Week |
|
|
|
|
|
|
|
|
|
|
|
|
|
FHFA House Price Index | Real Estate
| DATE/WEEK |
HIGHLIGHTS |
FOR |
ACTUAL |
|
FHFA House Price Index Up 1.1 Percent in October; Up 17.4 Percent from Last Year. House prices rose nationwide in October, up 1.1 percent from the previous month, according to the latest Federal Housing Finance Agency House Price Index (FHFA HPI®). House prices rose 17.4 percent from October 2020 to October 2021. The previously reported 0.9 percent price change for September 2021 remained unchanged. |
No 12 |
2.3% |
|
Oct-2021 |
|
| |
|
|
|
The home price index is calculated using purchase prices of houses financed with mortgages that have been sold to or guaranteed by Fannie Mae or Freddie Mac. U.S. Federal Housing Finance Agency home price index: 17.7% Year to Year. |
No 11 |
2.1% |
|
Sep-2021 |
|
| |
|
|
|
House prices rose nationwide in August, up 1.0 percent from the previous month, according to the latest Federal Housing Finance Agency House Price Index (FHFA HPI®). House prices rose 18.5 percent from August 2020 to August 2021. The previously reported 1.4 percent price change for July 2021 remained unchanged. For the nine census divisions, seasonally adjusted monthly house price changes from July 2021 to August 2021 ranged from -0.1 percent in the New England division to +1.9 percent in the South Atlantic division. The 12-month changes ranged from +14.9 percent in the West North Central division to +25.8 percent in the Mountain division. |
No 10 |
2.0% |
|
Aug-2021 |
|
| |
|
|
|
House prices rose nationwide in July, up 1.4 percent from the previous month, according to the latest Federal Housing Finance Agency House Price Index (FHFA HPI®). House prices rose 19.2 percent from July 2020 to July 2021. The previously reported 1.6 percent price change for June 2021 was revised upward to 1.7 percent. For the nine census divisions, seasonally adjusted monthly house price changes from June 2021 to July 2021 ranged from +0.8 percent in the West North Central division to +1.9 percent in the South Atlantic division. The 12-month changes ranged from +15.6 percent in the West North Central division to +25.6 percent in the Mountain division. |
No 9 |
6.7% |
|
Jul-2021 |
|
| |
|
|
|
U.S. house prices rose 17.4 percent from the second quarter of 2020 to the second quarter of 2021 according to the Federal Housing Finance Agency House Price Index (FHFA HPI®). House prices were up 4.9 percent compared to the first quarter of 2021. FHFA’s seasonally adjusted monthly index for June was up 1.6 percent from May. “During the second quarter, house prices peaked in June with an 18.8 percent growth rate compared to a year ago,” said Dr. Lynn Fisher, Deputy Director of FHFA’s Division of Research and Statistics. “For the quarter, annual gains surpassed 20 percent in the Mountain, New England, and Pacific census divisions and in all of the top 20 metro areas.” |
No 8 |
2.0% |
|
Jun-2021 |
|
| |
|
|
|
Home prices are up nationwide in May, according to the latest Federal Housing Finance Agency House Price Index (FHFA HPI®). Prices increased by 1.7% since last month and were up 18.0% from May 2020 to May 2021. The previously reported 1.8% price change for April 2021 was unrevised. For the nine census divisions, seasonally adjusted monthly house price changes from April 2021 to May 2021 ranged from: |
No 7 |
6.7% |
|
May-2021 |
|
| |
|
|
|
House prices rose nationwide in April, up 1.8 percent from the previous month, according to the latest Federal Housing Finance Agency House Price Index (FHFA HPI®). House prices rose 15.7 percent from April 2020 to April 2021. The previously reported 1.4 percent price change for March 2021 was revised upward to a 1.6 percent increase. For the nine census divisions, seasonally adjusted monthly house price changes from March 2021 to April 2021 ranged from +1.2 percent in the West North Central division to +2.6 percent in the Mountain and Middle Atlantic divisions. The 12-month changes ranged from +13.0 percent in the West North Central to +20.6 percent in the Mountain division. |
No 6 |
2.0% |
|
Apr-2021 |
|
| |
|
|
|
Housing Prices Skyrocketed In March 2021, Increasing Pressure For Fed Tapering. The FHFA (Federal Housing Finance Agency) purchase-only price index rose 13.9% YoY in March 2021 (the largest increase on record and up from 12.4% YoY percent in February). In March 2021, housing prices growth accelerated, rising at the fastest pace since at least 2013. The trend is likely to remain strong in the coming months raising pressure on Fed to taper MBS purchases in the second half of the year. |
No 5 |
6.7% |
|
Mar-2021 |
|
| |
|
|
|
House prices rose nationwide in February, up 0.9 percent from the previous month, according to the latest Federal Housing Finance Agency House Price Index (FHFA HPI®). House prices rose 12.2 percent from February 2020 to February 2021. The previously reported 1.0 percent price change for January 2021 remained unchanged. |
No 4 |
2.0% |
|
Fedb-2021 |
|
| |
|
|
|
House prices rose nationwide in January, up 1.0 percent from the previous month, according to the latest Federal Housing Finance Agency House Price Index (FHFA HPI®). House prices rose 12.0 percent from January 2020 to January 2021. The previously reported 1.1 percent price change for December 2020 was revised upward to 1.2 percent.... |
No 3 |
6.7% |
|
Jan-2021 |
|
| |
|
|
|
The Federal Housing Finance Agency (FHFA) House Price Index increased 1.1% m/m in December 2020 following an unrevised 1.0% m/m gain in November. This was the seventh consecutive month in which house prices had risen by 1.0% or more. Prior to this seven-month run, this index had risen 1% or more in only five months in the series history dating back to January 1991. Compared to a year ago, house prices were up 11.4%, the highest annual rate of increase in the series history. Over the past seven months, house prices rose 16.6% annualized, also their highest seven-month advance ever. |
No 2 |
2.0% |
|
Dec-2020 |
|
| |
|
|
|
FHFA House Price Index: Up 1.0% in November, Another All-Time High. House prices rose nationwide in November, up 1.0 percent from the previous month, according to the latest Federal Housing Finance Agency House Price Index (FHFA HPI®). House prices rose 11.0 percent from November 2019 to November 2020. The previously reported 1.5 percent price change for October 2020 remained unchanged. |
No 1 |
6.7% |
|
Nov-2020 |
|
| |
|
|
|
|
|
|
|
|
| |
|
|
|
|
|
| |
|
Legends: |
|
Delayed |
|
Positive View |
|
Negative View |
|
Neutral View |
|
Non Available |
|
|
|
|
|
|
|
|
|
|
|
|
|
|
|
|
|
|
|
|
| |
|
|
|
|
|
|
|
|
|
|
|
|
|
|
|
|
|
|
|
|
|
Definitions | Explain |
|
|
FHFA House Price Index | Real Estate |
|
Today's Week |
|
|
|
|
|
|
|
|
|
|
|
|
| |
|
|
|
|
| |
|
| FHFA HOUSE PRICE INDEX |
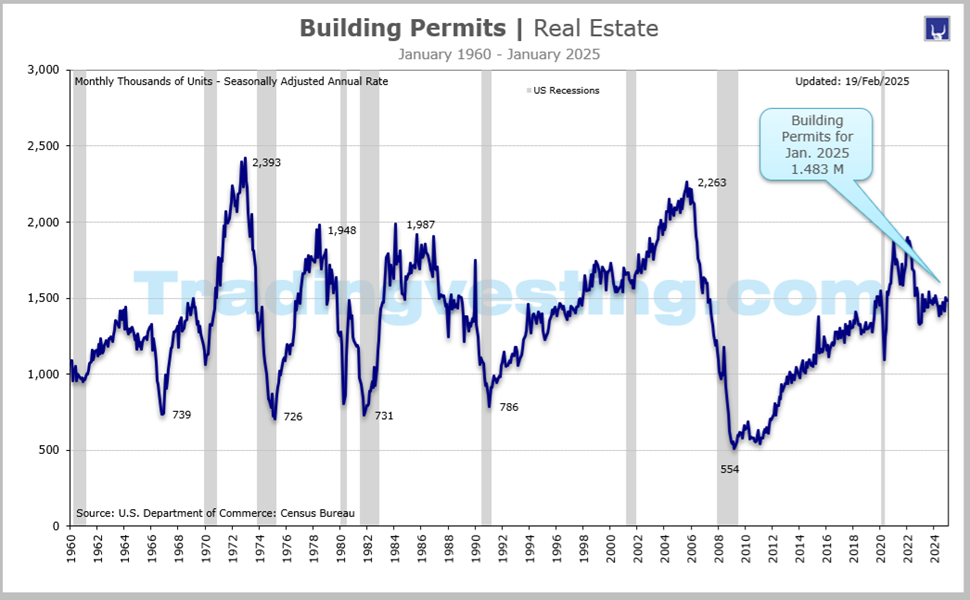
Building Permits
Permits usually lead home construction by about a month, but permits are not required in all regions of the country, and the level of permits therefore tends to be less than the level of starts over time.
Housing Permits Building permits are permits taken out in order to allow excavation. An increase in building permits and starts usually occurs a few months after a reduction in mortgage rates. A sale isn't final until a mortgage is closed.
According to the government, a building permit results in a new housing start roughly within one month. Permits usually lead home construction by about a month, but permits are not required in all regions of the country, and the level of permits therefore tends to be less than the level of starts over time.
Construction of single-family homes - the lion's share of the market.
While home building now accounts for only about 2.5% of gross domestic product, it remains a major force in the economy. Economists estimate that for every one house built, about 2.5 jobs are created.
The inventory of homes for sale and the median price. The inventory of homes for sale at the current sales pace is the inventory/sales ratio of the housing sector.
For example, a 5.0 figure for inventory/sales indicates that the supply of homes for sale would be depleted within five months at the current sales pace. The lower this figure goes, the greater the need for new housing starts. The year/year change in the median price provides a good indication of inflation in home price.
|
|
|
| |
|
|
|
|
|
|
|
|
|
|
|
|
|
|
|
|
|
|
|
|
|
Data | Source |
|
|
FHFA House Price Index | Real Estate |
|
Today's Week |
|
|
|
|
|
|
|
|
|
|
|
|
| |
|
|
|
|
|
|
| DATA INFORMATION |
FHFA HOUSE PRICE INDEX |
| SOURCE |
U.S. Department of Housing & Urban Development. |
| WEB |
www.hud.gov |
| FREQUENCY |
Monthly |
| AVAILABILITY |
Usually during the third week of the month. |
| COVERAGE |
Data are for the previous month. Data for June are released in July. |
| REVISIONS |
Yes |
| IMPORTANCE |
Real Estate - Low Importance |
|
| |
|
|
|
|
|
|
|
|
|
|
|
|