 |
 |
|
|
|
Week 45 -2012 | From Nov 05 to Nov 09, 2012 |
|
 |
|
|
|
|
|
|
| |
|
|
|
|
|
|
|
|
|
|
| |
Economic Data for Week 45-2012 | Global View | Week Rating
| DATE |
DAY |
REPORT/CATEGORY |
HIGHLIGHTS ON WEEK 45-2012 |
Last |
|
Mon |
ISM Non-Mfg Index |
The Institute for Supply Management reports that its ISM non-manufacturing index decreased to 54.2 in October, down from 55.1 in September. |
54.2
Level
|
|
 |
Business Actvity |
This decrease follows four consecutive months of gains. Although below the prior month�s figure, this is yet another reading above 50 and signals economic expansion. |
|
|
Tue |
ICSC Goldman Index |
Store sales in the U.S. saw a sharp decline this week as hurricane Sandy kept many potential shoppers indoors. |
-0.2%
W/W
|
|
|
Sales and Inventories |
ICSC-Goldman same store sales are now up only 1.4% year over year, compared to 2.8% Y/Y just a week ago. |
|
|
Tue |
Johnson Redbook |
The Redbook plummeted as well, and is now up only 0.8% Y/Y compared to 1.8% Y/Y a week ago. This was due to Hurricane Sandy that forced to close stores and keep shoppers at home. |
0.8%
Y/Y
|
|
|
Sales and Inventories |
The latest year-on-year rate is lowest since the Easter distortions of April 2011. Expect a strong rebound week ahead as shoppers attempt to replace all that was lost from the disaster. |
|
|
Wed |
MBA purchase Applications |
Mortgage applications decreased 5.0% from one week earlier, for the week ending November 2, 2012. The Refinance and Purchase Index also decreased 5% from the previous week.� |
-5.0%
W/W
|
|
|
Real Estate |
The Market Composite Index, a measure of mortgage loan application volume, decreased 5.0% on a seasonally adjusted basis from one week earlier. On an unadjusted basis, the Index decreased 5% compared with the previous week. |
|
|
Mon |
Consumer Credit |
The Federal Reserve reports that in September consumer credit rose $11.4 billion to $2.7372 trillion.Revolving credit decreased $2.9 billion to $852.0 billion, following a $4.2 billion increase in August. |
$11.4B |
|
|
Consumer |
Nonrevolving credit on the other hand increased $14.3 billion to $1.8852 trillion, following a $14.1 billion increase in August. The increase in nonrevolving credit was once again led by the federal government, as outstanding student loads have skyrocketed during the recession. |
|
|
Wed |
EIA Crude Oil Report |
In the week ending at November 2, Crude Oil Stocks grew by 1.766M in the US, according to EIA. The indicator showed a decline of -2.045M in the prior week. |
3.3% |
|
|
Commodity |
US: EIA Crude Oil Stocks grow 1.766M in Nov-2 |
|
|
Thu |
U.S. Trade Balance |
The Bureau of Economic analysis reports that the trade deficit in September was $41.5 billion, a decrease from August�s revised figure of $43.8 billion. |
$-41.5B |
|
|
Balance of Payments |
September exports were $187.0 billion, higher than August exports of $181.4 billion. September imports were $228.5 billion, higher than August imports of $225.2 billion |
|
|
Thu |
Jobless/Initial Claims |
The Department of Labor reports that jobless claims declined to 355k last week, reasonably better than the week prior figure of 363k. The prior week�s figure was unrevised. |
355K |
|
|
Employment |
We have gotten used to seeing upward revisions to jobless claims of 3k or more every week like clockwork. This is the first time in what seems like a very, very long time that there has not been an upward revision. |
|
|
Thu |
EIA Natural Gas Report |
Working gas in storage was 3,929 Bcf as of Friday, November 2, 2012, according to EIA estimates. This represents a net increase of 21 Bcf from the previous week. Stocks were 109 Bcf higher than last year at this time and 244 Bcf above the 5-year average of 3,685 Bcf. |
21 bcf |
|
|
Commodity |
Natural gas in storage rose 21 billion cubic feet in the November 2 week to 3,929 bcf. An injection of 25 bcf was expected. |
|
|
Thu |
Fed Balance Sheet |
US Fed balance sheet liabilities fell to USD 2.813trl as of Nov 7 vs. USD 2.805trl the previous week. ed holdings of US Treasuries total USD 1.651trl as of Nov 7 vs. USD 1.645trl the prev. week. |
-8.4B |
|
|
Government |
Currently the Fed is buying mortgage-backed securities at a rate of $40 billion each month. The dashed orange line assumes that if this $40 billion per month continues over the next few years, America�s balance sheet expands to about $4.5 trillion by the end of 2016. |
|
|
Thu |
M2 Money Supply |
|
$-1.9B |
|
|
Money Supply |
|
|
|
Fri |
Fixed Mortgage Rates |
The 30-year fixed mortgage rate hovered between 3.23 and 3.3% for the majority of the week, rising to the current rate this morning. |
3.25% |
|
|
Interest Rates |
Additionally, the 15-year fixed mortgage rate this morning was 2.66%, and for 5/1 ARMs, the rate was 2.4%. |
|
|
Fri |
Import and Export Prices |
The price index for U.S. imports rose 0.5% in October. Higher fuel and nonfuel prices each contributed to the October advance. U.S. export prices were unchanged in October after increasing 0.8 percent in September. |
|
|
|
Inflation |
Imports All Imports: Import prices rose for the third consecutive month in October, increasing 0.5% after a 1.1% advance in September and a 1.2% rise in August. This upturn was largely driven by higher fuel prices, although nonfuel prices. |
|
|
Fri |
Wholesale Trade |
Wholesale inventories rose a steep 1.1% in September in a build that is easily offset by a 2.0% jump in sales at the wholesale level. |
1.1% |
|
|
Sales and Inventories |
The mix makes for a leaner stock-to-sales ratio which is at 1.19. The level of wholesale inventories is one of three components that are plugged into the business inventories report.� |
|
|
Fri |
Consumer Sentiment |
The Reuters / University of Michigan consumer sentiment index rose this morning to a November preliminary reading of 84.9. |
84.9 |
|
|
Consumer |
This is an increase to October�s reading of 82.6, and is the highest reading since July of 2007. In short, consumer sentiment is strong, up 2.3 points to another recovery best of 84.9 at the mid-month reading. |
|
|
|
|
|
|
|
|
|
|
|
|
|
|
|
| |
|
|
|
|
|
|
|
|
|
|
|
|
|
|
|
| |
|
|
|
|
|
| |
|
|
|
|
|
| |
|
|
|
|
|
|
|
|
|
|
| |
|
| WEEK 45-2012 ENDING NOV. 09 |
Reports Commentary
Write commentarys for this week...
|
|
| |
|
|
|
|
|
|
|
|
|
|
|
|
|
|
|
|
|
|
|
|
|
|
|
|
|
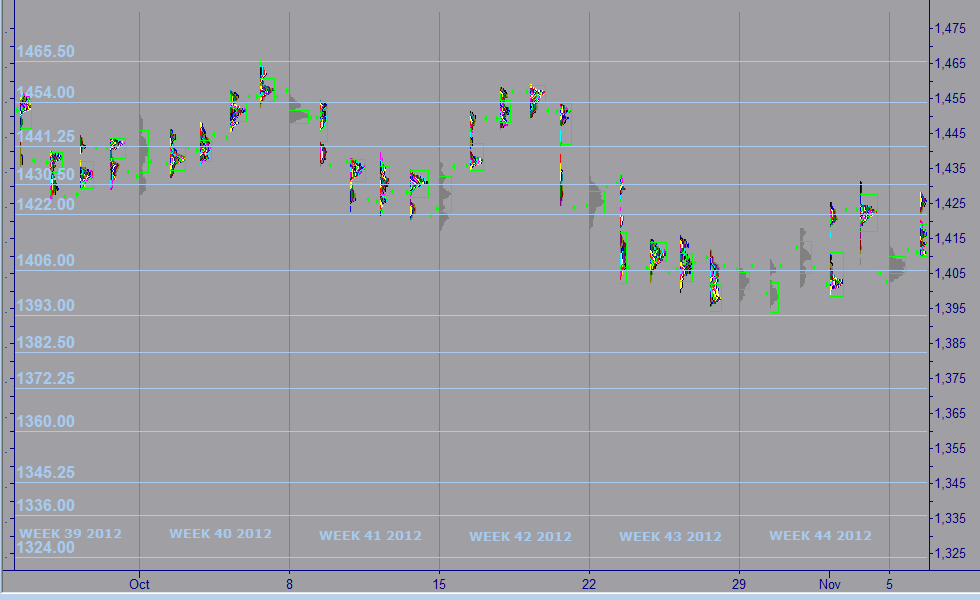
| MARKET PROFILE |
 |
WEEKS 2012 |
WEEK 45 |
% FROM CLOSE |
% FROM OPEN |
 |
RESISTANCE 1 |
1,330.25 |
1.39% |
1.35% |
|
RESISTANCE 2 |
1,326.25 |
1.08% |
1.04% |
 |
CLOSE MAR 02 |
1,350.00 |
|
|
|
OPEN MAR 04 |
1,255.00 |
0.04% |
|
 |
SUPPORT 1 |
1,289.00 |
0.66% |
0.62% |
|
SUPPORT 2 |
1,283.50 |
0.08% |
0.04% |
|
|
|
|
|
|
|
|
|
| |
|
|
|
|
|
| |
|
|
|
|
|
|
IMPORTANT NOTE: In an effort to comply with all applicable rules, regulations and disclosures please be so kind and read the "General Disclosure" below: |
| |
|
|
|
|
| GENERAL DISCLOSURE - TRADINGVESTING.COM |
- The material contained on our Website and Economic Calendar must be used at your own risk. Material is believed to be reliable, but we do not guarantee its accuracy or validity, nor is Tradingvesting.com responsible for any errors or omissions which may occur. The analysis and/or recommendations made by Tradingvesting.com do not provide, imply, or otherwise constitute a guarantee of performance. All contents and recommendations are based on data and sources believed to be reliable, but accuracy and completeness cannot be guaranteed. It should not be assumed that future results will be profitable or will equal past performance, real, indicated or implied.Tradingvesting.com website and material contained therein is not a solicitation to participate in the Futures/Stocks/Options Market. This Economic Calendar does not include Earning Releases, Announced Stock Splits, Upcoming Initial Public Offerings with Underwritings or Rating Changes. Tradingvesting.com has attempted to verify the information contained in this calendar. However, any aspect of such info may change without notice. Unless indicated otherwise: economic data is from the U.S and intraday data is at least 20 minutes delayed; all prices are in the local currency; Time is U.S. Eastern Time. Furthermore, there is a very high degree of risk involved in trading.Tradingvesting.com assumes no responsibilities for your trading and investment results, please red our Risk Disclosure.
- Tradingvesting.com does not provide investment advice, and does not represent that any of the information or related analysis is accurate or complete at any time. All information on this website are for educational purposes only and are not intended to provide financial advice. Any statements about profits or income, expressed or implied, do not represent a guarantee. Your actual trading may result in losses as no trading system is guaranteed. You accept full responsibilities for your actions, trades, profit or loss, and agree to hold Tradingvesting.com and any authorized distributors of this information harmless in any and all ways. We respect your right to privacy, please click here to view our privacy policy.
- U.S. Government Required Disclaimer - Commodity Futures Trading Commission.
Futures and options trading has large potential rewards, but also large potential risk. You must be aware of the risks and be willing to accept them in order to invest in the futures and options markets. Don't trade with money you can't afford to lose. This website is neither a solicitation nor an offer to Buy/Sell futures or options. No representation is being made that any account will or is likely to achieve profits or losses similar to those discussed on this website. The past performance of any trading system or methodology is not necessarily indicative of future results.
- CFTC rule 4.41:Hypothetical or simulated performance results have certain limitations. Unlike an actual performance record, simulated results do not represent actual trading. Also, since the trades have not been executed, the results may have under-or-over compensated for the impact, if any, of certain market factors, such as lack of liquidity. Simulated trading programs in general are also subject to the fact that they are designed with the benefit of hindsight. No representation is being made that any account will or is likely to achieve profit or losses similar to those shown.
- Risk Warning: Trading foreign exchange on margin carries a high level of risk, and may not be suitable for all investors. The high degree of leverage can work against you as well as for you. Before deciding to invest in foreign exchange you should carefully consider your investment objectives, level of experience, and risk appetite. The possibility exists that you could sustain a loss of some or all of your initial investment and therefore you should not invest money that you cannot afford to lose. You should be aware of all the risks associated with foreign exchange trading, and seek advice from an independent financial advisor if you have any doubts. Our linking to these sites does not constitute an endorsement of any products, services or the information found on them. Once you link to another site you are subject to the policies of the new site. By using this site, you agree to the Terms of Service, Privacy Policy and Risk Disclosure. Copyright � 2012 Tradingvesting, LLC. All rights reserved. If you have any questions regarding the Online Economic Calendar application, please contact us: click here.
THIS BRIEF STATEMENT CANNOT, OF COURSE, DISCLOSE ALL THE RISKS AND OTHER ASPECTS OF THE COMMODITY MARKETS AND EQUITY MARKETS. PLEASE READ MORE AT: TERMS OF SERVICE.
|
|
|
| |
|
|
|
|
| |
|
|
|
|
|
| |
|
|
|
|
|