 |
 |
|
|
|
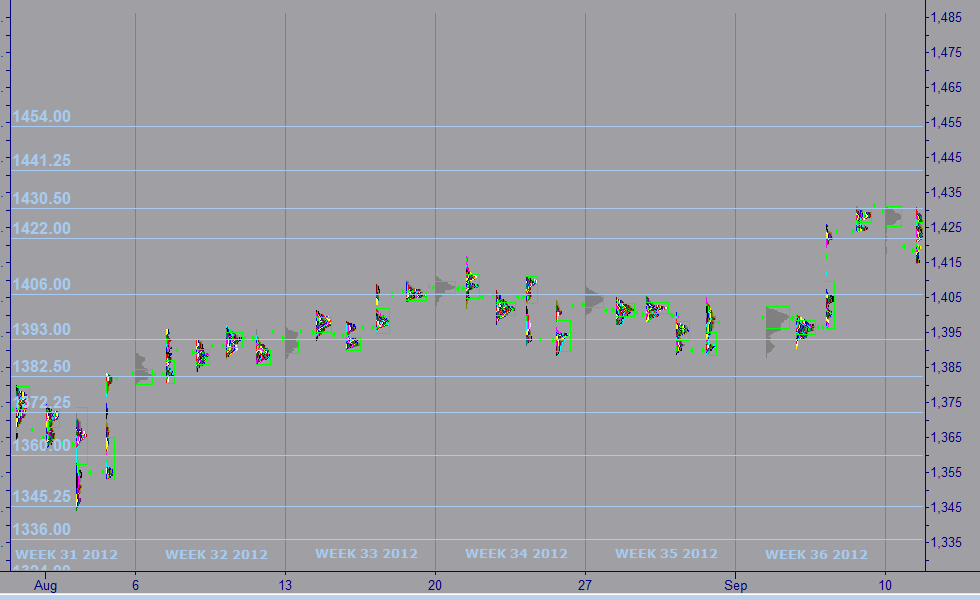
Week 37 -2012 | From Sep 10 to Sep 14, 2012 |
|
 |
|
|
|
|
|
|
| |
|
|
|
|
|
|
|
|
|
|
| |
Economic Data for Week 37-2012 | Global View | Week Rating
| DATE |
DAY |
REPORT/CATEGORY |
HIGHLIGHTS ON WEEK 37-2012 |
LAST |
|
Mon |
Consumer Credit |
Consumer credit fell at a seasonally adjusted annual rate of 1.5% to $2.71 trillion. The Fed also made a substantial upward revision from December 2010 onwards, with June growth reaching 5.3% from a previously reported 3% and May growth of 8.7% from a previous estimate of 7.8%. |
$-3.3B
M/M
|
|
 |
Consumer |
Consumer credit declined in July for the first time in 11 months. Total credit outstanding fell $3.3 billion in July with revolving credit falling $4.8 billion for a second straight monthly decline. June's level of credit was revised up to $2.71 trillion from $2.58 trillion. |
|
|
Tue |
ICSC Goldman Sachs Index |
ICSC/Goldman Retail Sales Index rise 1.0% in Week 36. The store sales reports came with sales little changed from last week. |
1.0%
W/W
|
|
|
Sales and Inventories |
The ICSC-Goldman is up 3.4% from a year ago, compared to 3.7% last week, while the Redbook is up 2.7% from a year ago, up from last week�s reading of 2.5%. |
|
|
Tue |
U.S. Trade Balance |
The trade deficit in July was little changed, with both imports and exports taking a slight dip. The U.S. trade deficit grew slightly in July as exports fell at a slightly faster pace than imports. It it is not looking good for manufacturers as exports declined.� |
$-42.0
Billions
|
|
|
Balance of Payments |
July exports of $183.3 billion and imports of $225.3 billion resulted in a goods and services deficit of $42.0 billion, up from $41.9 billion in June, revised. July exports were $1.9 billion less than June exports of $185.2 billion. July imports were $1.8 billion less than June imports of $227.1 billion. |
|
|
Tue |
Johnson Redbook |
Retail sales grew 2.7% in the week ended Sept. 8, after 2.5% growth the week before, according to the weekly retail sales report released by Johnson Redbook Tuesday. |
2.7%
Y/Y
|
|
|
Sales and Inventories |
This week�s sales are once again attributable to back-to-school shopping and seasonal sales, but the splurge on school supplies should be dwindling now. |
|
|
Wed |
MBA purchase Applications |
The MBA said its seasonally adjusted index of mortgage application activity, which includes both refinancing and home purchase demand, rose 11.1% in the week ended Sept 7. |
11.1%
W/W
|
|
|
Real Estate |
Applications for U.S. home mortgages rose last week as demand for refinancing and new loans jumped. The refinance share of total mortgage activity increased to 80% of applications from 79% the week before. |
|
|
Wed |
FOMC Meeting #6 Day 1 of 2 |
The Federal Reserve has tried a lot of things over the past five years to get the economy back on track: It�s lowered overnight rates nearly to zero, it�s bailed out banks, investment banks and insurance companies, and it�s bought trillions of dollars worth of bonds and mortgage-backed securities. |
N/A |
|
|
Interest Rates |
The Federal Open Market Committee announces its policy decision at 12:30 p.m. Thursday, it will try something new to give the economy some momentum. |
|
|
Wed |
Import and Export Prices |
Oil Pushes Up US Import Prices for First Time in 5 Months. Import prices climbed 0.7% and export prices 0.4% last month. Analysts had expected overall import prices would rise 1.4% and exports 0.4% in August. |
-2.2%
Y/Y
|
|
|
Inflation |
U.S. import prices rose in August for the first time in five months as the cost of imported oil jumped 4.1%, a factor that could weigh on American consumers and boost inflation. |
|
|
Wed |
Wholesale Trade |
Wholesale inventories rise could help growth in third quarter. Wholesale inventories climbed 0.7 % in July to $485.2 billion |
0.7% |
|
|
Sales and Inventories |
Wholesale inventories in July rose by the most in five months, beating forecasts and suggesting economic growth started the third quarter on slightly better footing than expected. |
|
|
Wed |
EIA Crude Oil Report |
Crude-oil futures ended lower Wednesday, breaking a five-session winning streak after a government update showed a surprise increase in inventories. |
N/A |
|
|
Commodity |
The Energy Information Administration reported an increase of 2 million barrels for the week ended Sept. 7. That contrasted with analyst expectations of a decline of 3.3 million barrels. |
|
|
Thu |
Jobless/Initial Claims |
Weekly U.S. jobless claims climb 15,000 to a seasonally adjusted 382,000, the highest in two months. The prior week's figure was revised up to show 2,000 more applications than previously reported. |
382K |
|
|
Employment |
The number of Americans filing new claims for jobless benefits rose more than expected last week, with several states reporting an increase related to Tropical Storm Isaac. |
|
|
Thu |
Producer Price Index |
The producer price index, which measures price changes before they reach the consumer, jumped 1.7% in August. An increase in energy prices makes it more expensive for companies to produce their goods and services and could hurt profits unless businesses pass along the costs to customers. |
1.7% |
|
|
Inflation |
The increase was mostly because gas prices soared 13.6%, the biggest gain in three years. Excluding the volatile categories of food and energy, so-called core wholesale prices rose a much smaller 0.2%. |
|
|
Thu |
EIA Natural Gas Report |
|
N/A |
|
|
Commodity |
|
|
|
Thu |
FOMC Meeting #6 Day 2 of 2 |
Fed to launch QE3 by buying mortgage securities $40 bln of MBS per-month, will do more unless job market strengthens. |
N/A |
|
|
Interest Rates |
The Federal Reserve, worried that improvement in the unemployment rate has stalled, announced a third, large purchase of bonds on Thursday in an effort to bring down long-term interest rates and spur growth. |
|
|
Thu |
Treasury Budget |
The U.S. federal budget deficit increased by $191 billion in August, topping $1 trillion for the fourth straight year. The Treasury Department says the deficit for the first 11 months of the 2012 budget year, which ends Sept. 30, totaled $1.16 trillion. |
$-190.5
Billions |
|
|
Government |
For August alone, the deficit is $190.5 billion. This is much higher than the consensus for a $160.0 billion deficit. After adjustments, the fiscal year-to-date deficit is down 6.7% less than the same period last year. Tax receipts are higher because of modest improvements in the economy. |
|
|
Thu |
Fed Balance Sheet |
The Fed's balance sheet - a broad gauge of its lending to the financial system - stood at $2.806 trillion on September 12, up from $2.804 trillion on September 5. |
N/A |
|
|
Government |
The Fed's holdings of Treasuries totaled $1.651 trillion as of Wednesday versus $1.649 trillion the previous week. |
|
|
Thu |
M2 Money Supply |
|
N/A |
|
|
Money Supply |
|
|
|
Fri |
Fixed Mortgage Rates |
Mortgage buyer Freddie Mac said that the rate on the 30-year loan was unchanged at 3.55%. In July, the rate fell to 3.49%, the lowest since long-term mortgages began in the 1950s. |
3.55%
APR
|
|
|
Interest Rates |
The average on the 15-year fixed mortgage, a popular refinancing option, slipped to 2.85%, down from 2.86% last week. That's above the record low of 2.80%. |
|
|
Fri |
Consumer Price Index |
The cost of living in the U.S. climbed in August by the most in more than three years. Similar to the PPI reading, the gains were supported by increases in food and energy. |
0.6% |
|
|
Inflation |
The 0.6% increase in the consumer-price index was the biggest since June 2009 and followed no change in the previous month. The core CPI, which excludes food and energy, was only up 0.1%, consistent with historical figures. |
|
|
Fri |
Retail Sales |
Retail Sales rose for a second straight month in August, boosted by automobiles and high gasoline prices, but the underlying tone pointed to modest economic growth in the third quarter. |
0.9%
M/M
|
|
|
Sales and Inventories |
Retail sales increased 0.9%, the largest increase since February after a downwardly revised 0.6% rise in July that was previously reported as a 0.8% advance. |
|
|
Fri |
Industrial Production |
Industrial production fell 1.2%. That was the steepest decline since March 2009. Analysts and economists had expected industrial output to be flat last month. |
-1.2% |
|
|
Manufacturing |
U.S. industrial output fell in August by the most in over three years as production slowed in factories and a hurricane temporarily shut down oil and natural gas rigs in the Gulf of Mexico. |
|
|
Fri |
Consumer Sentiment |
The Thomson Reuters/University of Michigan's preliminary September consumer sentiment index rose to 79.2 from 74.3 in August. That topped expectations for a decline to 74.0. |
79.2
Level
|
|
|
Consumer |
U.S. consumer sentiment unexpectedly rose in early September to its highest level in four months as Americans were more upbeat about their economic and job prospects |
|
|
Fri |
Business Inventories |
U.S. business inventories posted their largest gain in six months in July, boosted by an increase in automobile stocks. That could be a lift to third-quarter economic growth. At July's sales pace, it would take 1.28 months for businesses to clear shelves, down slightly from 1.29 months in June. |
N/A |
|
|
Sales and Inventories |
Business inventories increased 0.8% to a record $1.59 trillion, after edging up 0.1% in June. Economistshad forecast inventories rising only 0.3% in July. |
|
|
|
|
|
|
|
|
| |
|
|
|
|
|
|
|
|
|
|
|
|
| |
|
|
|
|
| |
|
|
|
|
|
| |
|
|
|
|
|
| |
|
|
|
|
| |
|
| WEEK 37-2012 ENDING SEP. 14 |
Reports Commentary
China's exports grew at a slower pace than forecast in August posting a wider-than-expected trade surplus as imports unexpectedly contracted from the year-ago period, suggesting anemic domestic demand
Exports grew 2.7% year-on-year last month, below the 3% forecast in a Reuters poll, confirming President Hu Jintao's warning of the "grave challenges" posed by the world economy.
Data for imports was even worse, showing a fall of 2.6% on the year in August, compared with expectations for a 3.5% rise. Remember that China's biggest customers are the debt-ridden, recession-bound European Union and the still struggling United States. The import surprise on the downside is very unusual. It is an alarming sign for the government and they probably saw it coming. Although falling imports might suggest weaker domestic demand, we should note falling prices of commodity imports play a key role. China could potentially purchase more commodities and spend more on infrastructure to take advantage of the low prices.
The drop in credit-card borrowing coincides with a slowdown in hiring this year and a rise in consumer pessimism that indicate households are wary of taking on debt. Employers added fewer workers to payrolls than forecast in August, while a gain in average hourly earnings from a year earlier matched the smallest increase since records began in 2007.
A wider trade deficit acts as a drag on growth because the U.S. is typically spending more on imports while taking in less from the sales of American-made goods.
Weaker growth around the globe is hurting U.S. exports. Exports to Europe fell 11.7%. Many European countries are recession, which has cut demand for American-made goods. The region accounts for about one-fifth of U.S. exports.
The deficit with China grew 7.2% in July to $29.4 billion, the largest with any single country. That reflected a 5.6% jump in imports, which vastly outpaced a smaller 0.4% rise in U.S. exports.
Many economists expect higher fuel costs will contribute to a short-term rise in inflation, however, there was little sign of broader inflation pressures in the import data. Non-petroleum imports declined 0.2%, a sign that the cooling global economy is reducing companies' ability to raise prices.
The U.S. Federal Reserve’s policy-setting meeting got underway. Investors took some risk off the table before the announcement on Thursday at the conclusion of the two-day meeting.
Inventories are a key element in the government's measure of changes in gross domestic product. Weaker growth in inventories dragged on GDP during the second quarter, when the economy expanded at a 1.7 % annual rate.
July's gain in inventories was enough for some economists to slightly raise forecasts for third-quarter GDP, although others said the drop in sales negated the boost.
Applications for U.S. jobless benefits jumped by 15,000 to a seasonally adjusted 382,000 in the week ended Sept. 8,, with about half the increase related to tropical storm Isaac,
U.S. wholesale prices jumped a seasonally adjusted 1.7% in August, mainly because of higher fuel prices, the Labor Department said Thursday. Excluding the volatile categories of food and energy, so-called core wholesale prices rose a much smaller 0.2%.�
Cheap mortgages have helped lift the housing market. Sales of new and previously occupied homes are well above last year's levels. Low rates have also allowed people to refinance, which lowers monthly mortgage payments and helps boosts consumer spending.
Home prices are increasing more consistently this year, largely because the supply of homes has shrunk while sales have risen. And the number of Americans who owe more on their mortgages than their homes are worth declined in the second quarter.
Mortgage rates are low because they tend to track the yield on the 10-year Treasury note. A weaker U.S. economy and uncertainty about how Europe will resolve its debt crisis have led investors to buy more Treasury securities, which are considered safe investments. As demand for Treasurys increase, the yield falls.
By an 11-to-1 vote, the Federal Reserve's monetary-policy panel has decided to launch a new program of open-ended bond purchases, QE3, saying bank will buy $40 billion in agency mortgage-backed securities each month, starting Friday.
The U.S. federal budget deficit increased by $191 billion in August and has topped $1 trillion for the fourth straight year.
The deficit for the first 11 months of the 2012 budget year totaled $1.16 trillion, the Treasury Department said Thursday. That's 6 percent less than the $1.23 trillion in the same period last year. The fiscal year ends Sept. 30.
One reason for the improvement: Income tax receipts are up as the economy improves slowly.
Romney has promised to cut spending to narrow the budget gap. He would cap spending at 20 percent of gross domestic product, a measure of the nation's overall economic output. Spending currently equals about 24 percent of GDP.
Note that 80% of the increase in the consumer price index was due to a jump in gasoline costs.
Consumer prices increased 1.7% in the 12 months ended in August, the report showed. The core CPI climbed 1.9 percent over the past 12 months.
US Industrial Production Falls Most in Three Years. Industrial production encompasses output from factories, utilities, and mining operations, including oil and natural gas production. Utilities output declined 3.6 percent in August. Capacity utilization, a measure of how fully firms are using their resources, was at 78.2 percent in August, below forecasts and declining from 79.2 percent in July.
The Federal Reserve�s declaration of a new bond-buying program will begin bulking back of a balance sheet that has been basically flat for more than a year.
Click for full-size interactive graphic.
Assets on the Fed�s balance sheet sit at around $2.8 trillion as of Wednesday. The level has held pretty stable since June 2011, when the central bank ended its previous bond-buying program, commonly known as QE2.
U.S. consumers paid sharply higher prices for gasoline in August as an extended bout of low inflation was broken, at least temporarily.
The consumer price index jumped 0.6% last month to mark the biggest advance since June 2009, the Labor Department reported.
|
|
|
| |
|
|
|
|
|
|
|
|
|
|
|
|
|
|
|
|
|
|
|
|
|
|
|
|
|
| MARKET PROFILE |
 |
WEEKS 2012 |
WEEK 37 |
% FROM CLOSE |
% FROM OPEN |
 |
RESISTANCE 1 |
1,330.25 |
1.39% |
1.35% |
|
RESISTANCE 2 |
1,326.25 |
1.08% |
1.04% |
 |
CLOSE MAR 02 |
1,350.00 |
|
|
|
OPEN MAR 04 |
1,255.00 |
0.04% |
|
 |
SUPPORT 1 |
1,289.00 |
0.66% |
0.62% |
|
SUPPORT 2 |
1,283.50 |
0.08% |
0.04% |
|
|
|
|
|
|
|
|
|
| |
|
|
|
|
|
| |
|
|
|
|
|
|
IMPORTANT NOTE: In an effort to comply with all applicable rules, regulations and disclosures please be so kind and read the "General Disclosure" below: |
| |
|
|
|
|
| GENERAL DISCLOSURE - TRADINGVESTING.COM |
- The material contained on our Website and Economic Calendar must be used at your own risk. Material is believed to be reliable, but we do not guarantee its accuracy or validity, nor is Tradingvesting.com responsible for any errors or omissions which may occur. The analysis and/or recommendations made by Tradingvesting.com do not provide, imply, or otherwise constitute a guarantee of performance. All contents and recommendations are based on data and sources believed to be reliable, but accuracy and completeness cannot be guaranteed. It should not be assumed that future results will be profitable or will equal past performance, real, indicated or implied.Tradingvesting.com website and material contained therein is not a solicitation to participate in the Futures/Stocks/Options Market. This Economic Calendar does not include Earning Releases, Announced Stock Splits, Upcoming Initial Public Offerings with Underwritings or Rating Changes. Tradingvesting.com has attempted to verify the information contained in this calendar. However, any aspect of such info may change without notice. Unless indicated otherwise: economic data is from the U.S and intraday data is at least 20 minutes delayed; all prices are in the local currency; Time is U.S. Eastern Time. Furthermore, there is a very high degree of risk involved in trading.Tradingvesting.com assumes no responsibilities for your trading and investment results, please red our Risk Disclosure.
- Tradingvesting.com does not provide investment advice, and does not represent that any of the information or related analysis is accurate or complete at any time. All information on this website are for educational purposes only and are not intended to provide financial advice. Any statements about profits or income, expressed or implied, do not represent a guarantee. Your actual trading may result in losses as no trading system is guaranteed. You accept full responsibilities for your actions, trades, profit or loss, and agree to hold Tradingvesting.com and any authorized distributors of this information harmless in any and all ways. We respect your right to privacy, please click here to view our privacy policy.
- U.S. Government Required Disclaimer - Commodity Futures Trading Commission.
Futures and options trading has large potential rewards, but also large potential risk. You must be aware of the risks and be willing to accept them in order to invest in the futures and options markets. Don't trade with money you can't afford to lose. This website is neither a solicitation nor an offer to Buy/Sell futures or options. No representation is being made that any account will or is likely to achieve profits or losses similar to those discussed on this website. The past performance of any trading system or methodology is not necessarily indicative of future results.
- CFTC rule 4.41:Hypothetical or simulated performance results have certain limitations. Unlike an actual performance record, simulated results do not represent actual trading. Also, since the trades have not been executed, the results may have under-or-over compensated for the impact, if any, of certain market factors, such as lack of liquidity. Simulated trading programs in general are also subject to the fact that they are designed with the benefit of hindsight. No representation is being made that any account will or is likely to achieve profit or losses similar to those shown.
- Risk Warning: Trading foreign exchange on margin carries a high level of risk, and may not be suitable for all investors. The high degree of leverage can work against you as well as for you. Before deciding to invest in foreign exchange you should carefully consider your investment objectives, level of experience, and risk appetite. The possibility exists that you could sustain a loss of some or all of your initial investment and therefore you should not invest money that you cannot afford to lose. You should be aware of all the risks associated with foreign exchange trading, and seek advice from an independent financial advisor if you have any doubts. Our linking to these sites does not constitute an endorsement of any products, services or the information found on them. Once you link to another site you are subject to the policies of the new site. By using this site, you agree to the Terms of Service, Privacy Policy and Risk Disclosure. Copyright � 2012 Tradingvesting, LLC. All rights reserved. If you have any questions regarding the Online Economic Calendar application, please contact us: click here.
THIS BRIEF STATEMENT CANNOT, OF COURSE, DISCLOSE ALL THE RISKS AND OTHER ASPECTS OF THE COMMODITY MARKETS AND EQUITY MARKETS. PLEASE READ MORE AT: TERMS OF SERVICE.
|
|
|
| |
|
|
|
|
|
| |
|
|
|
|
|