 |
 |
|
|
|
Week 02 -2012 | From Jan 09 to Jan 13, 2012 |
|
 |
|
|
|
|
|
|
| |
|
|
|
|
|
|
|
|
|
|
| |
Economic Data for Week 02-2012 | Global View
| Week Rating
| DATE |
DAY |
REPORT/CATEGORY |
HIGHLIGHTS ON WEEK 02-2012 |
Last |
|
Mon |
Consumer Credit |
Consumer borrowing in the U.S. surged in November by the most in 10 years. Credit increased by $20.37 billion, the biggest jump since November 2001, to $2.478 trillion |
$20.4B |
|
 |
Consumer |
Households are optimistic enough to take on debt and banks are willing to lend. Consumers are feeling more confident and making more big- ticket purchases |
|
|
Tue |
NFIB Index |
For the second consecutive month, small business optimism rose 1.8 points. The small but notable gain settled the December reading at 93.8. This represents the fourth monthly increase since September. |
93.8 |
|
|
Consumer |
The Index has gained 5.7 points over the last four months with several indicators posting notable gains. The level of the Index is consistent with weak growth and is still in recession territory. |
|
|
Tue |
ICSC Goldman Sachs Index |
The ICSC reported that chain store tumbled 5.4% from the prior week. the largest decline on record since Sep-1989, and increased just 2.8% over the prior-year period during the week Jan 7th. |
-5.4% |
|
|
Sales and Inventories |
January is a low sales volume month and small shifts can be accentuated, which is the case in the first week of the January fiscal month. |
|
|
Tue |
Wholesale Trade |
Wholesale Inventories in U.S. Rise 0.1% less than forecast in November as distributors struggled to keep up with demand, a sign gains in manufacturing will keep the economy growing. |
0.1% M/M |
|
|
Sales and Inventories |
Wholesalers kept enough goods on hand to last 1.15 months at the current sales pace, close to the record low of 1.13 months reached in March last year. Inventory-to-sales ratio holding at 1.15. |
|
|
Tue |
Johnson Redbook |
Redbook Index or same-store sales index slowed to a year-on-year plus 3.3% from the prior week's 4.9% rate. |
3.3% W/W |
|
|
Sales and Inventories |
The January 7 week was a slow one for the retail sector judging by both ICSC-Goldman and by Redbook |
|
|
Wed |
MBA purchase Applications |
After three weeks of very steep declines, the purchase index jumped 8.1% in the January 6 week. The refinancing index rose 3.3% with the four-week average down 0.5%. |
4.5% |
|
|
Real Estate |
Rates mostly edged higher in the week with the average 30-year conforming loan (under $417,500) up four tenths to 4.11%. Composite Index: 4.5%. |
|
|
Wed |
EIA Crude Oil |
January 6 week 5.0 million barrel build for oil stocks to 334.6 million. This is the largest build since August, and the third straight weekly build. |
5.0M |
|
|
Commodity |
Crude futures closed higher Tuesday, aided by a softer U.S. dollar, expectations for monetary policy easing in China, a key oil consumer, and a climb in U.S. stocks lifted by Alcoa good report. |
|
|
Wed |
Beige Book 1 |
The Beige Book survey of business contacts in the Fed�s 12 districts said economic activity increased at a modest to moderate pace. |
N/A |
|
|
Interest Rates |
This rate is an improvement from the mid-November report which said some districts were growing at a �slow� pace. |
|
|
Thu |
Jobless/Initial Claims |
The number of Americans applying for first-time jobless benefits rose on Thursday, reversing a recent decline and suggesting the labor market remains brittle. |
399K |
|
|
Employment |
First-time claims for jobless benefits moved higher last week, signs the economic recovery remains shaky despite a pick-up in growth. |
|
|
Thu |
Retail Sales |
Retail sales rose at the weakest pace in seven months as consumers pulled back late in the holiday season, cutting purchases at department stores and spending less on electronics. |
0.1% |
|
|
Sales and Inventories |
Retail Sales Post Gain of 0.1% as Holiday Buying Fades. Retail sales rose at the weakest pace in seven months in December after rising by an upwardly revised 0.4% in November. |
|
|
Thu |
Business Inventories |
Business Inventories Rose 0.3% in November increasing their stockpiles, a gain that should help boost economic growth. |
0.3% |
|
|
Sales and Inventories |
Companies are building up their stockpiles again after cutting them over the summer. That's a positive sign for growth because it means many businesses are anticipating stronger demand. |
|
|
Thu |
EIA Natural Gas Report |
Natural gas prices increase their downward clip because U.S. supplies are well above normal for this time of year. Natural gas prices fell 9 cents, or 3.1%, to $2.69 per 1,000 cubic feet. |
-95bcf |
|
|
Commodity |
Production is booming as rising crude oil prices encourage the industry to tap new oil and gas fields in North America. |
|
|
Thu |
Treasury Budget |
The gap expanded to $86 billion. The slower economy, weakening receipts and a wider federal budget deficit means that there is pressure to cut spending even further. |
$-86B |
|
|
Government |
The U.S. government�s budget deficit widened 10% in December as spending rose more quickly than tax revenue. The deficit continues to show sizable improvement. |
|
|
Thu |
Fed Balance Sheet |
Total assets for the January 11 week decreased to $2.902 trillion. Remember that changes in total assets are from Wednesday to Wednesday. |
$-18.6B |
|
|
Government |
The Fed's balance sheet fell $18.6 billion after an $8.4 billion drop the prior week. The decline was led by holdings of Treasuries which dropped $12.6 billion, following an $8.7 billion fall the prior week. |
|
|
Thu |
M2 Money Supply |
M2 surged $85.6 billion for the January 2 week. M1 was up $66.4 billion, mostly in demand deposits. US M1 Rose $66.4 Billion In Jan 2 Week; M2 Rose $85.6 Billion |
$85.6B |
|
|
Money Supply |
Seasonally adjusted M1 rose by $66.4 billion to $2.234 trillion, while M2 rose $85.6 billion to $9.751 trillion. |
|
|
Fri |
Fixed Mortgage Rates |
30-year mortgage rate at record low 3.89%. The 15-year fixed-rate mortgage fell to a record low of 3.16% in the latest week from 3.23% in the prior week. |
3.89% |
|
|
Interest Rates |
The average rate on the 30-year fixed-rate mortgage fell to a record low of 3.89% in the week ended Jan. 12, compared with 3.91% in the prior week. |
|
|
Fri |
U.S. Trade Balance |
The gap expanded 10.4% to $47.8 billion, the widest since June, from a $43.3 billion shortfall in October. Domestic demand is a bit stronger than external demand as global growth weakens. |
$-47.8B |
|
|
Balance of Payments |
The U.S. trade deficit widened more than forecast in November as American exports declined and companies stepped up imports of crude oil and automobiles. More Imports and Exports decline. |
|
|
Fri |
Import and Export Prices |
U.S. import prices edged down 0.1% in December, after rising 0.7% the previous month. Prices for overall exports declined 0.5% in December: 0.1% advance in November. |
8.5%
Y/Y |
|
|
Inflation |
In December, declining prices for fuels more than offset a 0.1% rise in nonfuel prices. Export prices also decreased in December, falling 0.5% following a 0.1% advance in November. |
|
|
Fri |
Consumer Sentiment |
A gauge of consumer sentiment reached 74 in the preliminary reading for January, the highest level since May, compared with 69.9 in December |
74.0 Level |
|
|
Consumer |
The sentiment gauge, which covers how consumers view their personal finances as well as business and buying conditions, averaged about 87 in the year before the start of the most recent recession. |
|
|
|
|
|
|
|
|
|
|
|
|
|
|
|
|
|
|
|
|
|
|
|
|
|
| |
|
|
|
|
|
| |
|
|
|
|
|
|
|
|
|
|
| |
|
| WEEK 02-2012 ENDING JAN. 13 |
Reports Commentary
Week 02-2012: U.S. consumer borrowing rose by the most in a decade during November, surging 10% with Americans pulling out their credit cards as the holiday shopping season got rolling.
The Retail Sales suggests that spending isn't really picking up any momentum,sales suggests consumers likely frontloaded their holiday shopping before cutting spending at the end of the year at department stores and on electronic gadgets.
The U.S. unemployment rate has fallen sharply in recent months and was 8.5% December, but some economists worry the drop has been due in part to discouraged workers dropping out of the labor force.Although the economy added 1.6 million jobs in 2011, which was the most since 2006, the unemployment rate remained historically elevated.
Americans are using less NG at a time when energy companies are pumping more from fields around the country. Friday, Oil closes 1.8% lower after sharp reversal on Iran-embargo report.
The Federal Reserve's latest weekly money supply report Thursday shows seasonally adjusted M1 rose by $66.4 billion to $2.234 trillion, while M2 rose $85.6 billion to $9.751 trillion.The figures are preliminary estimates for the week extending through Jan. 2 and are subject to revisions
It appears that the surge in M2 may have been traders parking their money over the holiday period.
U.S. Trade Deficit Widens Beyond Forecast. The U.S. trade deficit widened more than forecast in November as American exports declined and companies stepped up imports of crude oil and automobiles.
Important Red Flags: The larger-than-expected increase in weekly initial U.S. unemployment claims (+24,000 to 399,000 versus expectations of +3,000 to 375,000) and the weaker-than-expected Dec U.S. retail sales (+0.1% and -0.2% less autos versus expectations of +0.3% and +0.3% less autos).
Larger-than-expected increase in weekly U.S. jobless claims, which signals economic weakness that is negative for energy consumption.
Important Green Flag: The weaker dollar, which fuels investment demand in commodities, |
|
| |
|
|
|
|
|
|
|
|
|
|
|
|
|
|
|
|
| |
|
|
|
|
|
|
|
|
|
|
|
|
|
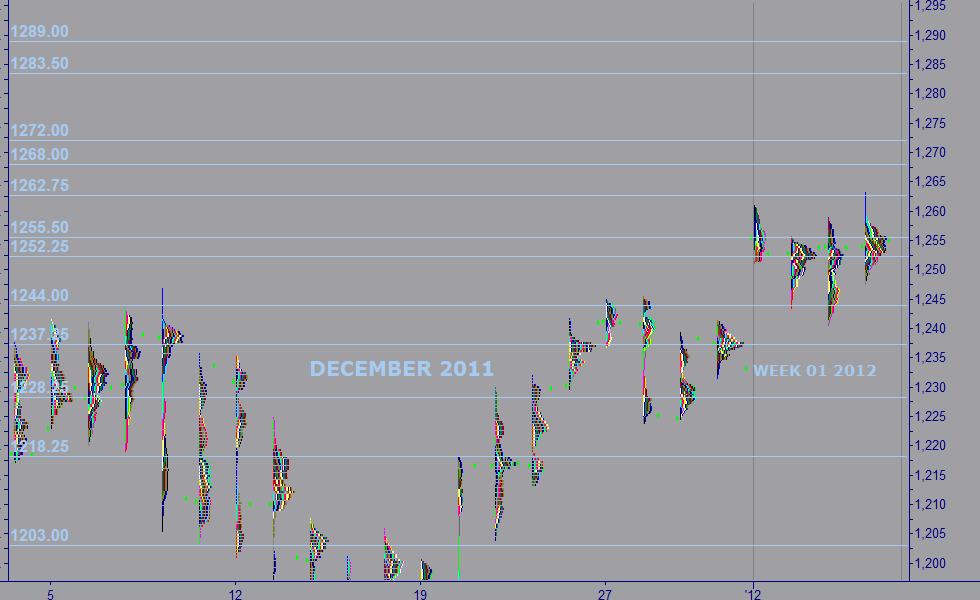
| MARKET PROFILE |
 |
WEEKS 2012 |
WEEK 02 |
% FROM CLOSE |
% FROM OPEN |
 |
RESISTANCE 1 |
1,272.00 |
1.39% |
1.35% |
|
RESISTANCE 2 |
1,268.00 |
1.08% |
1.04% |
 |
CLOSE JAN 05 |
1,254.50 |
|
|
|
OPEN JAN 08 |
1,255.00 |
0.04% |
|
 |
SUPPORT 1 |
1,262.75 |
0.66% |
0.62% |
|
SUPPORT 2 |
1,255.50 |
0.08% |
0.04% |
|
|
|
|
|
|
|
|
|
| |
|
|
|
|
| |
|
|
|
|
|
| |
|
|
|
|
|
|
IMPORTANT NOTE: In an effort to comply with all applicable rules, regulations and disclosures please be so kind and read the "General Disclosure" below: |
| |
|
|
|
|
|
|
| GENERAL DISCLOSURE - TRADINGVESTING.COM |
- The material contained on our Website and Economic Calendar must be used at your own risk. Material is believed to be reliable, but we do not guarantee its accuracy or validity, nor is Tradingvesting.com responsible for any errors or omissions which may occur. The analysis and/or recommendations made by Tradingvesting.com do not provide, imply, or otherwise constitute a guarantee of performance. All contents and recommendations are based on data and sources believed to be reliable, but accuracy and completeness cannot be guaranteed. It should not be assumed that future results will be profitable or will equal past performance, real, indicated or implied.Tradingvesting.com website and material contained therein is not a solicitation to participate in the Futures/Stocks/Options Market. This Economic Calendar does not include Earning Releases, Announced Stock Splits, Upcoming Initial Public Offerings with Underwritings or Rating Changes. Tradingvesting.com has attempted to verify the information contained in this calendar. However, any aspect of such info may change without notice. Unless indicated otherwise: economic data is from the U.S and intraday data is at least 20 minutes delayed; all prices are in the local currency; Time is U.S. Eastern Time. Furthermore, there is a very high degree of risk involved in trading.Tradingvesting.com assumes no responsibilities for your trading and investment results, please red our Risk Disclosure.
- Tradingvesting.com does not provide investment advice, and does not represent that any of the information or related analysis is accurate or complete at any time. All information on this website are for educational purposes only and are not intended to provide financial advice. Any statements about profits or income, expressed or implied, do not represent a guarantee. Your actual trading may result in losses as no trading system is guaranteed. You accept full responsibilities for your actions, trades, profit or loss, and agree to hold Tradingvesting.com and any authorized distributors of this information harmless in any and all ways. We respect your right to privacy, please click here to view our privacy policy.
- U.S. Government Required Disclaimer - Commodity Futures Trading Commission.
Futures and options trading has large potential rewards, but also large potential risk. You must be aware of the risks and be willing to accept them in order to invest in the futures and options markets. Don't trade with money you can't afford to lose. This website is neither a solicitation nor an offer to Buy/Sell futures or options. No representation is being made that any account will or is likely to achieve profits or losses similar to those discussed on this website. The past performance of any trading system or methodology is not necessarily indicative of future results.
- CFTC rule 4.41:Hypothetical or simulated performance results have certain limitations. Unlike an actual performance record, simulated results do not represent actual trading. Also, since the trades have not been executed, the results may have under-or-over compensated for the impact, if any, of certain market factors, such as lack of liquidity. Simulated trading programs in general are also subject to the fact that they are designed with the benefit of hindsight. No representation is being made that any account will or is likely to achieve profit or losses similar to those shown.
- Risk Warning: Trading foreign exchange on margin carries a high level of risk, and may not be suitable for all investors. The high degree of leverage can work against you as well as for you. Before deciding to invest in foreign exchange you should carefully consider your investment objectives, level of experience, and risk appetite. The possibility exists that you could sustain a loss of some or all of your initial investment and therefore you should not invest money that you cannot afford to lose. You should be aware of all the risks associated with foreign exchange trading, and seek advice from an independent financial advisor if you have any doubts. Our linking to these sites does not constitute an endorsement of any products, services or the information found on them. Once you link to another site you are subject to the policies of the new site. By using this site, you agree to the Terms of Service, Privacy Policy and Risk Disclosure. Copyright � 2012 Tradingvesting, LLC. All rights reserved. If you have any questions regarding the Online Economic Calendar application, please contact us: click here.
THIS BRIEF STATEMENT CANNOT, OF COURSE, DISCLOSE ALL THE RISKS AND OTHER ASPECTS OF THE COMMODITY MARKETS AND EQUITY MARKETS. PLEASE READ MORE AT: TERMS OF SERVICE.
|
|
|
| |
|
|
|
|
|
| |
|
|
|
|
|