 |
 |
|
|
|
Week 46 -2012 | From Nov 12 to Nov 16, 2012 |
|
 |
|
|
|
|
|
|
| |
|
|
|
|
|
|
|
|
|
|
| |
Economic Data for Week 46-2012 | Global View | Week Rating
| DATE |
DAY |
REPORT/CATEGORY |
HIGHLIGHTS ON WEEK 46-2012 |
LAST |
|
Mon |
Non Reports for Our Global Vision |
There will be no Economic Reports released on Monday. |
N/A |
|
 |
No Reports |
|
|
|
Tue |
ICSC Goldman Index |
The ICSC-Goldman store sales index is now up 1.8% year over year, better than the 1.4% Y/Y it was up last week, but well worse than the 2.7% Y/Y it was the week prior. |
0.7%
W/W
|
|
|
Sales and Inventories |
Getting a boost from post-hurricane Sandy restocking in the Northeast, same-store sales rose 0.7% in the November 10 week or Week 45. |
|
|
Tue |
Johnson Redbook |
The Redbook store sales index is now up 1.6% year over year, better than the 0.8% Y/Y it was up last week, but below the 1.8% Y/Y it was up the week prior. |
1.6%
Y/Y |
|
|
Sales and Inventories |
Sales improved in the November 10 week but still remain soft, which shows a plus 1.6 percent year-on-year rate. The rate is double that of the prior week but is not much better than the very soft four-week average of plus 1.4%. |
|
|
Tue |
Treasury Budget |
The federal government started the 2013 budget year with a $120 billion deficit in October, an indication that the nation is on a path to its fifth straight $1 trillion-plus annual deficit. |
$-120B |
|
|
Government |
A soaring deficit puts added pressure on President Barack Obama and Congress to seek a budget deal in the coming weeks. |
|
|
Wed |
MBA purchase Applications |
The MBA said its seasonally adjusted index of mortgage application activity, which includes both refinancing and home purchase demand, rose 12.6% in the week ended November 9. |
12.6%
W/W
|
|
|
Real Estate |
Applications for U.S. home mortgages jumped last week, rebounding after a massive storm depressed applications on the East Coast and as a fall in interest rates to a new low spurred demand, data from an industry group showed on Wednesday. |
|
|
Wed |
Producer Price Index |
the Labor Department said its seasonally adjusted producer price index slipped 0.2% last month, the first decline since May, after increasing 1.1% in September. Economists had expected prices at farms, factories, and refineries to increase 0.2% last month. |
-0.2% |
|
|
Inflation |
Wholesale prices excluding volatile food and energy costs also fell 0.2%, the largest fall since October 2010, after being flat in September. Economists had expected core PPI to rise 0.1%. |
|
|
Wed |
Retail Sales |
Retail sales dipped 0.3% last month after a 1.3% increase in September. U.S. retail sales fell in October by the sharpest amount since June, hurt partly by the effects of hurricane Sandy. |
-0.3% |
|
|
Sales and Inventories |
U.S. retail sales fell in October for the first time in three months as super storm Sandy slammed the brakes on automobile purchases, suggesting a loss of momentum in spending early in the fourth quarter. |
|
|
Wed |
Business Inventories |
The Commerce Department said on Wednesday inventories increased 0.7% to a record $1.61 trillion, after rising 0.6% in August. |
0.7% |
|
|
Sales and Inventories |
U.S. business inventories rose more than expected in September but stocks excluding automobiles were flat for a second month, which could prompt economists to lower their estimates for third-quarter growth. |
|
|
Wed |
FOMC Minutes #7 |
Minutes of Fed meeting suggest a new bond-buying program could be unveiled in December The bond purchases would be intended to lower long-term borrowing rates to encourage spending and strengthen the economy. The hope is that more hiring would follow. |
N/A |
|
|
Interest Rates |
Minutes of the Fed's Oct. 23-24 policy meeting released Wednesday suggest that it might unveil a bond buying program in December to replace a program that expires at year's end. |
|
|
Thu |
Jobless/Initial Claims |
Superstorm Sandy drove a surge in new claims for U.S. jobless benefits last week and hurt factory activity in the mid-Atlantic region in November, signs it could deal a substantial blow to economic growth in the fourth quarter. |
439K |
|
|
Employment |
Initial claims for state unemployment benefits rose 78,000 to a seasonally adjusted 439,000, the highest level since April 2011, the Labor Department said on Thursday. It was the biggest one-week jump since a spike caused by Hurricane Katrina in September 2005. |
|
|
Thu |
Consumer Price Index |
CPI (inflation) data came in line exactly as economists expected. The fact that economists got it right for a change is bigger news than the CPI. |
0.1% |
|
|
Consumer |
The Bureau of Labor Statistics reports that in October the consumer price index rose 0.1%, a smaller increase than the 0.6% seen in September |
|
|
Thu |
Empire State Mfg Survey |
Empire State (NY) Manufacturing Survey showed contraction again at -5.22, but was fairly close to expectations of -5.00. Despite the gain, this is still a reading indicating economic contraction, and is the 4th such reading in a row now. |
-5.22 |
|
|
Manufacturing |
The New York Fed reports in the Empire State Manufacturing Survey that the general business conditions index is -5.22 in November, an improvement to October�s -6.16. |
|
|
Thu |
Philadelphia Fed Survey |
The Philly Fed Survey measures manufacturing in the Philly area, which was not seriously affected by the hurricane; however, its results were very bad, again. |
-10.7
Level
|
|
|
Business Activity |
In contrast to the Empire State report, Hurricane Sandy definitely had a major impact on manufacturing data from the Philly Fed. Instead of coming in at the consensus� +4.5, it was a horrendous reading of -10.7. |
|
|
Thu |
EIA Natural Gas Report |
The U.S. Energy Information Administration (EIA) today reported the U.S. natural gas stocks declined by a total of 18 billion cubic feet, more than the 14 billion cubic feet decline that analysts were expecting. Natural gas futures prices were less than 1% higher in advance of the EIA�s report at around $3.78 per thousand cubic feet, and rose to around $3.80 immediately following the EIA report. |
-18 bcf |
|
|
Commodity |
Natural-gas futures for December delivery NGZ12 +1.11% rose 0.5% to $3.72 per million British thermal units. Natural gas in storage fell 18 billion cubic feet in the November 9 week to 3,911 bcf. |
|
|
Thu |
EIA Crude Oil Report |
Crude-oil inventories showed a build of 1.1 million barrels last week, but this was lower than expected, leading to a slight bounce in [Nymex crude futures] prices |
|
|
|
Commodity |
Crude-oil futures traded a touch lower during electronic trading Friday, helped by mild gains for the dollar. |
|
|
Thu |
Fed Balance Sheet |
The U.S. Federal Reserve's balance sheet rose slightly over the past week, as the central bank continued with its easy-money policy.� |
-8.4B |
|
|
Government |
The Fed's asset holdings in the week ended Nov. 14 edged up to $2.879 trillion, from $2.832 trillion a week earlier, it said in a weekly report released Thursday. Thursday's report showed total borrowing from the Fed's discount lending window was $1.02 billion Wednesday, down from $1.17 billion a week earlier.� |
|
|
Thu |
M2 Money Supply |
|
$-1.9B |
|
|
Money Supply |
|
|
|
Fri |
Fixed Mortgage Rates |
Lenders were offering fixed-rate 30-year home loans to solid borrowers at an average of 3.34% this week, the latest in a series of record low mortgage rates, according to home finance giant Freddie Mac. |
3.34% |
|
|
Interest Rates |
The typical rate on a 15-year fixed mortgage of 2.65% with 0.7% in lender fees also was a record, a notch below the previous record low of 2.66% in mid-October. |
|
|
Fri |
Treasury Intal Capital |
Japan continued to threaten China's position as the largest foreign holder of U.S. Treasurys in September, while net sales of Treasurys by private foreigners hit a record high, the Treasury Department said Friday. |
$3.3B |
|
|
Balance of Payments |
Overall, foreigners were net buyers of long-term U.S. securities in September, according to the monthly Treasury International Capital report, known as TIC. |
|
|
Fri |
Industrial Production |
The Federal Reserve reports that industrial production declined 0.4% in October following a 0.2% gain in September. The industrial production index (2007=100) is now at 96.6 compared to 97.0 last month |
-0.4% |
|
|
Business Actvity |
Industrial Production Declined 0.4% In October. U.S. industrial output unexpectedly fell in October as superstorm Sandy disrupted production, but the underlying tone remained consistent with slowing manufacturing activity. |
|
|
Fri |
E-Commerce Sales |
U.S. e-commerce sales reached $56.99 billion, says the U.S. Department of Commerce. Third quarter 2011 e-commerce sales increased 3.7% from $54.94 billion in the second quarter, according to the department�s seasonally adjusted estimates. |
3.91% |
|
|
Sales and Inventories |
U.S. e-commerce sales reached $56.99 billion in the third quarter, up 17.3% from $48.59 billion for the same period a year ago, according to figures released today by the U.S. Department of Commerce. |
|
|
|
|
|
|
|
|
|
|
|
|
|
|
|
| |
|
|
|
|
|
|
|
|
|
|
|
|
|
|
|
| |
|
|
|
|
|
| |
|
|
|
|
|
| |
|
|
|
|
|
|
|
|
|
|
| |
|
| WEEK 46-2012 ENDING NOV. 16 |
Reports Commentary
The retail sales report offered an early read on the storm's impact on the economy. Its full impact will likely be felt in the November data.
Store sales in the U.S. recovered some this week, but remain in a downward trend. Last week’s sales took a plunge, as many shoppers were traveling or contained indoors in the aftermath of hurricane Sandy.
The Treasury Department said Tuesday that the October deficit � the gap between the government’s tax revenue and its spending � was 22 percent higher than the same month last year.
The deficit, in simplest terms, is the amount of money the government has to borrow when revenues fall short of expenses. The government ran a $1.1 trillion annual budget deficit in the fiscal year that ended in September. That was lower than the previous year but still painfully high by historical standards.
Other data on Wednesday showed little inflation, with wholesale prices falling in October for the first time since May, giving the U.S. Federal Reserve latitude to maintain its ultra easy monetary policy stance to nurse the economy back to health. Wholesale prices in the U.S. posted the biggest decline in October in more than a year and a half, mostly because of lower costs of gasoline and motor vehicles.
The benign tone of the producer price inflation report should give the Fed room to keep its low interest rate environment. Consumer inflation is currently hovering around the Fed's 2 percent target.
The U.S. central bank in September launched a third round of asset purchases, committing to buy $40 billion worth of mortgage-backed securities every month until there is a sustained improvement in the labor market. It hopes the purchases will drive down borrowing costs.
Inventories in September were lifted by a 0.9 percent rise in stocks at auto dealers. Auto inventories had increased 1.2 percent in August.
Inventories are a key component of gross domestic product changes. Inventories, excluding autos � which go into the calculation of gross domestic product � were flat for a second straight month.
The Fed's portfolio has tripled since the financial crisis of 2008 and 2009 as the central bank bought government bonds and mortgage-backed securities in an effort to keep interest rates low and to stimulate the economy.�
In September the Fed began buying $40 billion a month of additional mortgage-backed securities on an open-ended basis. Fed officials have said that they plan to continue buying bonds until the labor market improves significantly.� |
|
| |
|
|
|
|
|
|
|
|
|
|
|
|
|
|
|
|
|
|
|
|
|
|
|
|
|
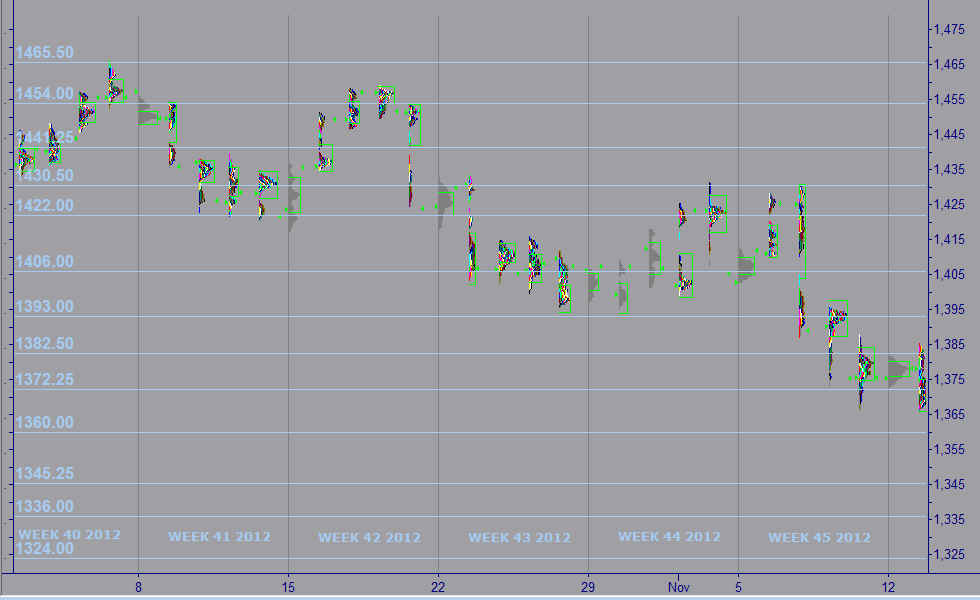
| MARKET PROFILE |
 |
WEEKS 2012 |
WEEK 46 |
% FROM CLOSE |
% FROM OPEN |
 |
RESISTANCE 1 |
1,330.25 |
1.39% |
1.35% |
|
RESISTANCE 2 |
1,326.25 |
1.08% |
1.04% |
 |
CLOSE MAR 02 |
1,350.00 |
|
|
|
OPEN MAR 04 |
1,255.00 |
0.04% |
|
 |
SUPPORT 1 |
1,289.00 |
0.66% |
0.62% |
|
SUPPORT 2 |
1,283.50 |
0.08% |
0.04% |
|
|
|
|
|
|
|
|
|
| |
|
|
|
|
|
| |
|
|
|
|
|
|
IMPORTANT NOTE: In an effort to comply with all applicable rules, regulations and disclosures please be so kind and read the "General Disclosure" below: |
| |
|
|
|
|
| GENERAL DISCLOSURE - TRADINGVESTING.COM |
- The material contained on our Website and Economic Calendar must be used at your own risk. Material is believed to be reliable, but we do not guarantee its accuracy or validity, nor is Tradingvesting.com responsible for any errors or omissions which may occur. The analysis and/or recommendations made by Tradingvesting.com do not provide, imply, or otherwise constitute a guarantee of performance. All contents and recommendations are based on data and sources believed to be reliable, but accuracy and completeness cannot be guaranteed. It should not be assumed that future results will be profitable or will equal past performance, real, indicated or implied.Tradingvesting.com website and material contained therein is not a solicitation to participate in the Futures/Stocks/Options Market. This Economic Calendar does not include Earning Releases, Announced Stock Splits, Upcoming Initial Public Offerings with Underwritings or Rating Changes. Tradingvesting.com has attempted to verify the information contained in this calendar. However, any aspect of such info may change without notice. Unless indicated otherwise: economic data is from the U.S and intraday data is at least 20 minutes delayed; all prices are in the local currency; Time is U.S. Eastern Time. Furthermore, there is a very high degree of risk involved in trading.Tradingvesting.com assumes no responsibilities for your trading and investment results, please red our Risk Disclosure.
- Tradingvesting.com does not provide investment advice, and does not represent that any of the information or related analysis is accurate or complete at any time. All information on this website are for educational purposes only and are not intended to provide financial advice. Any statements about profits or income, expressed or implied, do not represent a guarantee. Your actual trading may result in losses as no trading system is guaranteed. You accept full responsibilities for your actions, trades, profit or loss, and agree to hold Tradingvesting.com and any authorized distributors of this information harmless in any and all ways. We respect your right to privacy, please click here to view our privacy policy.
- U.S. Government Required Disclaimer - Commodity Futures Trading Commission.
Futures and options trading has large potential rewards, but also large potential risk. You must be aware of the risks and be willing to accept them in order to invest in the futures and options markets. Don't trade with money you can't afford to lose. This website is neither a solicitation nor an offer to Buy/Sell futures or options. No representation is being made that any account will or is likely to achieve profits or losses similar to those discussed on this website. The past performance of any trading system or methodology is not necessarily indicative of future results.
- CFTC rule 4.41:Hypothetical or simulated performance results have certain limitations. Unlike an actual performance record, simulated results do not represent actual trading. Also, since the trades have not been executed, the results may have under-or-over compensated for the impact, if any, of certain market factors, such as lack of liquidity. Simulated trading programs in general are also subject to the fact that they are designed with the benefit of hindsight. No representation is being made that any account will or is likely to achieve profit or losses similar to those shown.
- Risk Warning: Trading foreign exchange on margin carries a high level of risk, and may not be suitable for all investors. The high degree of leverage can work against you as well as for you. Before deciding to invest in foreign exchange you should carefully consider your investment objectives, level of experience, and risk appetite. The possibility exists that you could sustain a loss of some or all of your initial investment and therefore you should not invest money that you cannot afford to lose. You should be aware of all the risks associated with foreign exchange trading, and seek advice from an independent financial advisor if you have any doubts. Our linking to these sites does not constitute an endorsement of any products, services or the information found on them. Once you link to another site you are subject to the policies of the new site. By using this site, you agree to the Terms of Service, Privacy Policy and Risk Disclosure. Copyright � 2012 Tradingvesting, LLC. All rights reserved. If you have any questions regarding the Online Economic Calendar application, please contact us: click here.
THIS BRIEF STATEMENT CANNOT, OF COURSE, DISCLOSE ALL THE RISKS AND OTHER ASPECTS OF THE COMMODITY MARKETS AND EQUITY MARKETS. PLEASE READ MORE AT: TERMS OF SERVICE.
|
|
|
| |
|
|
|
|
| |
|
|
|
|
|
| |
|
|
|
|
|