Tradingvesting..com
Dow Jones 30
Stock Market | Dow Jones 30
SP500   Monthly Data   Data Since 1970   52 Weeks DOW 30 NASAQ 100   VIX Top Indexes
SP500 Month 1970 52Wk Dow NQ   VIX   indexes

Big Chart
Release Dates
Brief News
Explain
ECONOMIC REPORTS
1


MARKET CORRELATION
1


5
EXTERNAL FACTORS
1
2
3
 
S&P 500 - Nasdaq 100 - Dow 30 - VIX - Compare
 
 
Stock Market | SP 5003. Stock Market| S&P 500 (3 of 5)
Currencies | US Dollar4. Currencies | US Dollar (4 of 5)
Currencies | US Dollar5. Hedging | Gold (5 of 5)
Currencies | US Dollar1. Commodities | Oil (1 of 5)
Market Correlation2. Bond Market | 10 Year (2 of 5)
Prev Category Prev Oil 10 Year bond Dow US Dollar Gold Compare Next Next Category
    → Big Chart   → Release
MARKET CORRELATION
 
Description
Frequency
Day
Hour
Importance
Rev
 
 
1
Weekly
Thu
10:30
 
 
2
Weekly
Mon
7:00
 
 
3
Weekly
Fri
16:30
 
 
4
Weekly
Mon
16:30
 
 
5
Weekly
Wed
16:30
 
 
Definitions Definitions Big View Big Data Small View Small Data Reports Reports   Snapshot I Snapshot i Snapshot II Snapshot II Slides Slides Economics Reports Global
 
         
Top of Page
       
  Big Chart | Large Data USA Dow Jones 30 | Indexes   Today's Week Today's Week
DOW JONES
Dow 30
 
Previous Large Set Data Small Set Data Definitions Today Next
         
Top of Page
       
  Slides | Five 5 USA Dow Jones 30 | Indexes   Today's Week Today's Week
15. STOCK MARKET | S&P 500
www.tradingvesting.com www.tradingvesting.com www.tradingvesting.com www.tradingvesting.com www.tradingvesting.com www.tradingvesting.com www.tradingvesting.com www.tradingvesting.com www.tradingvesting.com
 
Global Oil 10 Year bond Dow US Dollar Gold Compare
         
Top of Page
  ver    
Tradingvesting.com   Historical Data | Annual USA Dow Jones 30 | Indexes   Today's Week Today's Week
No Year ClosingValue NetChange %Change U/D
130 2025 60.00 5,000.00 10.01% Up
129 2024 42,544.22 4,854.68 12.88% Up
128 2023 37,689.54 4,542.29 13.70% Up
127 2022 33,147.25 -3,191.05 -8.78% Down
126 2021 36,338.30 5,731.82 18.73% Up
125 2020 30,606.48 2,068.04 7.25% Up
124 2019 28,538.44 5,210.98 22.34% Up
123 2018 23,327.46 -1,391.76 -5.63% Down
122 2017 24,719.22 4,956.62 25.08% Up
121 2016 19,762.60 2,337.57 13.42% Up
120 2015 17,425.03 -398.04 -2.23% Down
119 2014 17,823.07 1,246.41 7.52% Up
118 2013 16,576.66 3,472.52 26.50% Up
117 2012 13,104.14 886.58 7.26% Up
116 2011 12,217.56 640.05 5.53% Up
115 2010 11,577.51 1,149.46 11.02% Up
114 2009 10,428.05 1,651.66 18.82% Up
113 2008 8,776.39 -4,488.43 -33.84% Down
112 2007 13,264.82 801.67 6.43% Up
111 2006 12,463.15 1,745.65 16.29% Up
110 2005 10,717.50 -65.51 -0.61% Up
109 2004 10,783.01 329.09 3.15% Up
108 2003 10,453.92 2,112.29 25.32% Up
107 2002 8,341.63 -1,679.87 -16.76% Down
106 2001 10,021.50 -765.35 -7.10% Down
105 2000 10,786.85 -710.27 -6.18% Down
104 1999 11,497.12 2,315.69 25.22% Up
103 1998 9,181.43 1,273.19 16.10% Up
102 1997 7,908.24 1,459.98 22.64% Up
101 1996 6,448.26 1,331.14 26.01% Up
100 1995 5,117.12 1,282.68 33.45% Up
99 1994 3,834.44 80.35 2.14% Up
98 1993 3,754.09 452.98 13.72% Up
97 1992 3,301.11 132.28 4.17% Up
96 1991 3,168.83 535.17 20.32% Up
95 1990 2,633.66 -119.54 -4.34% Down
94 1989 2,753.20 584.63 26.96% Up
93 1988 2,168.57 229.74 11.85% Up
92 1987 1,938.83 42.88 2.26% Up
91 1986 1,895.95 349.28 22.58% Up
90 1985 1,546.67 335.1 27.66% Up
89 1984 1,211.57 -47.07 -3.74% Down
88 1983 1,258.64 212.1 20.27% Up
87 1982 1,046.54 171.54 19.60% Up
86 1981 875.00 -88.99 -9.23% Down
85 1980 963.99 125.25 14.93% Up
84 1979 838.74 33.73 4.19% Up
83 1978 805.01 -26.16 -3.15% Down
82 1977 831.17 -173.48 -17.27% Down
81 1976 1,004.65 152.24 17.86% Up
80 1975 852.41 236.17 38.32% Up
79 1974 616.24 -234.62 -27.57% Down
78 1973 850.86 -169.16 -16.58% Down
77 1972 1,020.02 129.82 14.58% Up
76 1971 890.2 51.28 6.11% Up
75 1970 838.92 38.56 4.82% Up
74 1969 800.36 -143.39 -15.19% Down
73 1968 943.75 38.64 4.27% Up
72 1967 905.11 119.42 15.20% Up
71 1966 785.69 -183.57 -18.94% Down
70 1965 969.26 95.13 10.88% Up
69 1964 874.13 111.18 14.57% Up
68 1963 762.95 110.85 17.00% Up
67 1962 652.1 -79.04 -10.81% Down
66 1961 731.14 115.25 18.71% Up
65 1960 615.89 -63.47 -9.34% Down
64 1959 679.36 95.71 16.40% Up
63 1958 583.65 147.96 33.96% Up
62 1957 435.69 -63.78 -12.77% Down
61 1956 499.47 11.07 2.27% Up
60 1955 488.4 84.01 20.77% Up
59 1954 404.39 123.49 43.96% Up
58 1953 280.9 -11 -3.77% Down
57 1952 291.9 22.67 8.42% Up
56 1951 269.23 33.82 14.37% Up
55 1950 235.41 35.28 17.63% Up
54 1949 200.13 22.83 12.88% Up
53 1948 177.3 -3.86 -2.13% Down
52 1947 181.16 3.96 2.23% Up
51 1946 177.2 -15.71 -8.14% Down
50 1945 192.91 40.59 26.65% Up
49 1944 152.32 16.43 12.09% Up
48 1943 135.89 16.49 13.81% Up
47 1942 119.40 8.44 7.61% Up
46 1941 110.96 -20.17 -15.38% Down
45 1940 131.13 -19.11 -12.72% Down
44 1939 150.24 -4.52 -2.92% Down
43 1938 154.76 33.91 28.06% Up
42 1937 120.85 -59.05 -32.82% Down
41 1936 179.9 35.77 24.82% Up
40 1935 144.13 40.09 38.53% Up
39 1934 104.04 4.14 4.14% Up
38 1933 99.90 39.97 66.69% Up
37 1932 59.93 -17.97 -23.07% Down
36 1931 77.90 -86.68 -52.67% Down
35 1930 164.58 -83.90 -33.77% Down
34 1929 248.48 -51.52 -17.17% Down
33 1928 300.00 97.60 48.22% Up
32 1927 202.40 45.20 28.75% Up
31 1926 157.20 0.54 0.34% Up
30 1925 156.66 36.15 30.00% Up
29 1924 120.51 24.99 26.16% Up
28 1923 95.52 -3.21 -3.25% Down
27 1922 98.73 17.63 21.74% Up
26 1921 81.10 9.15 12.72% Up
25 1920 71.95 -35.28 -32.90% Down
24 1919 107.23 25.03 30.45% Down
23 1918 82.20 7.82 10.51% Up
22 1917 74.38 -20.62 -21.71% Down
21 1916 95.00 -4.15 -4.19% Down
20 1915 99.15 44.57 81.66% Up
19 1914 54.58 -24.2 -30.72% Down
18 1913 78.78 -9.09 -10.34% Down
17 1912 87.87 6.19 7.58% Up
16 1911 81.68 0.32 0.39% Up
15 1910 81.36 -17.69 -17.86% Down
14 1909 99.05 12.9 14.97% Up
13 1908 86.15 27.4 46.64% Up
12 1907 58.75 -35.6 -37.73% Down
11 1906 94.35 -1.85 -1.92% Down
10 1905 96.20 26.59 38.20% Up
9 1904 69.61 20.5 41.74% Up
8 1903 49.11 -15.18 -23.61% Down
7 1902 64.29 -0.27 -0.42% Down
6 1901 64.56 -6.15 -8.70% Down
5 1900 70.71 4.63 7.01% Up
4 1899 66.08 5.56 9.19% Up
3 1898 60.52 11.11 22.49% Up
2 1897 49.41 8.96 22.15% Up
1 1896 40.45 -0.49 -1.20% Down
 
         
Top of Page
       
Tradingvesting.com   Definitions | Explain USA Dow Jones 30 | Indexes   Today's Week Today's Week
     
   
DOW JONES 30
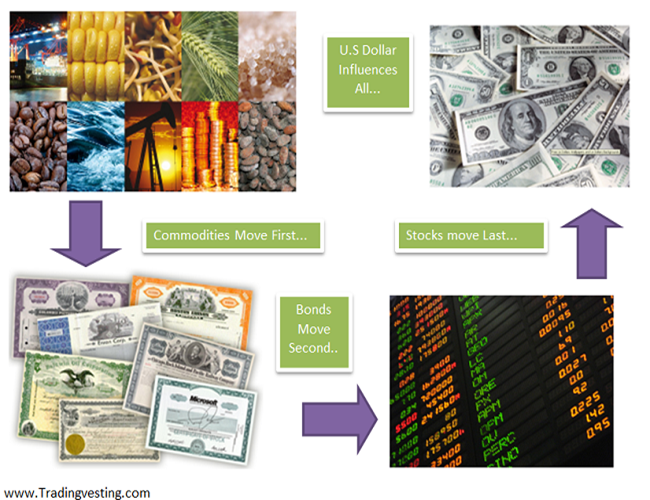
Commodities Move First

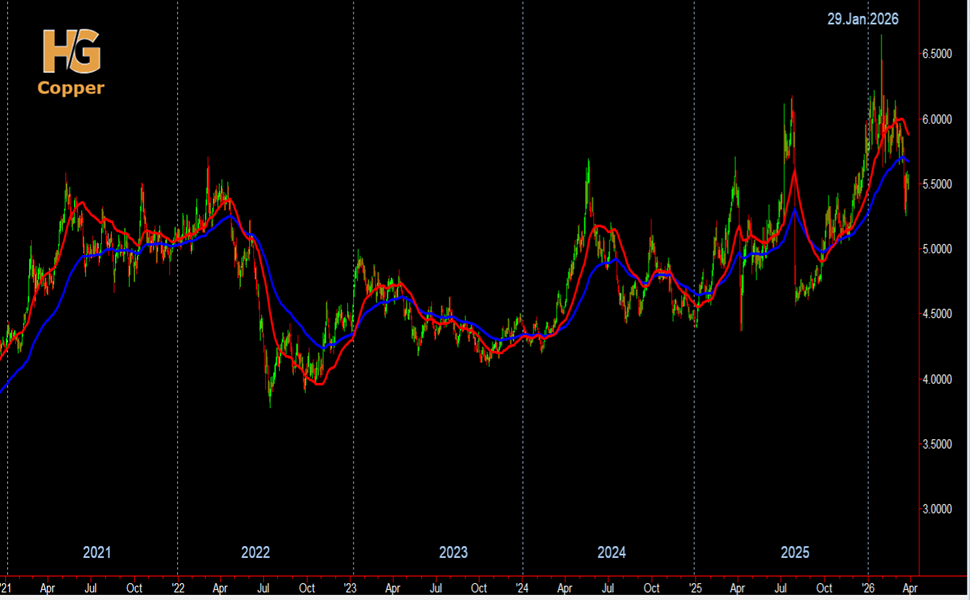
The reason Commodity prices are so important to the Market Correlation picture is that they play a major role as a leading indicator of Inflation. And inflation is the general increase in prices over a 12 month period.

If Commodities start to rise, that means economic strength and that will push Bond prices lower and Interest Rates higher. On the other hand, falling Commodity prices means economic weakness.

A period of rising Commodity prices arouses fears of Inflation which prompts monetary authorities to raise Interest Rates to combat that inflation. Eventually, the rise in Interest Rates chokes off the economic expansion which leads to the inevitable economic slowdown and recession.
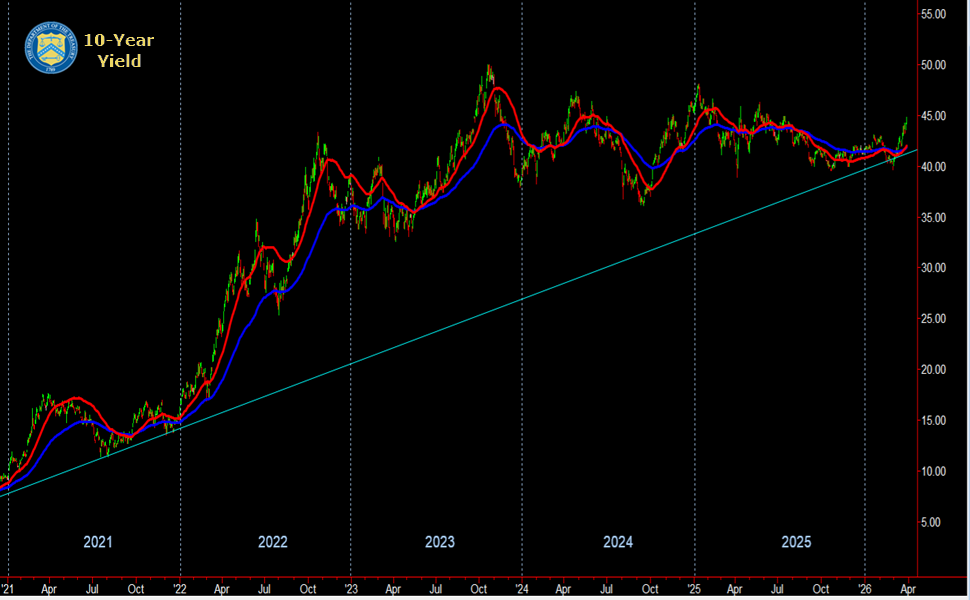
Bonds Move Second

If Interest Rates rise to fight Inflation, Bonds will go down. People will take money from the Bond Market and place into the Stock Market for better profits. That creates and inverse correlatio between Stocks and Bonds.

The relationship between bond price and interest rate can be seen in the following example:

If you have a bond paying 5% and inflation is 3% your "real return" is 2%. But if inflation goes to 4% that return is only 1%. Therefore the bond is worth less. The longer you have it the worse off you are. Furthermore you can expect the government to raise the price they will be paying on new bonds to compensate for the rise in inflation. Which means your bond will likely be worth even less.
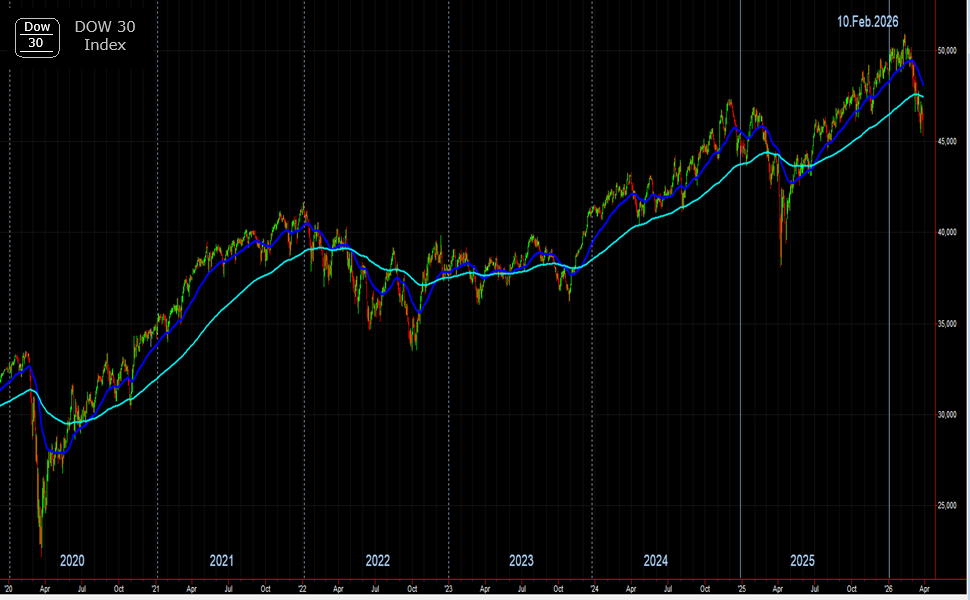
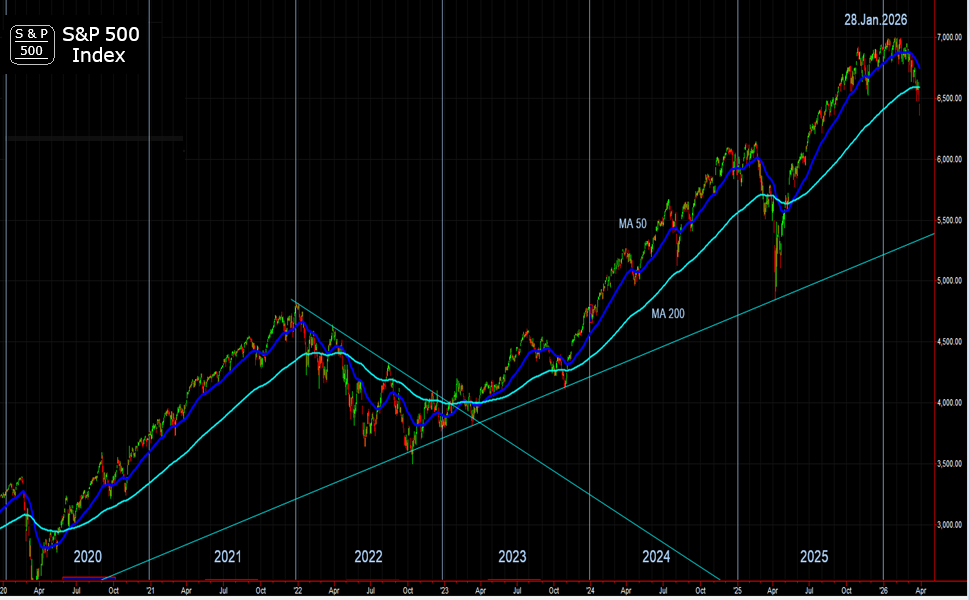
Stocks Move Third

During boom times, most eyes will be on inflation as people watch for signs that the economy is overheating. For example, during peak periods of the business cycle when the economy is experiencing rapid growth in real GDP, employment will increase, and unemployment decrease, as businesses seek workers to produce a higher output. But economists will be worried about inflation, the higher cost of living that diminishes growth.

The more the entrepreneur extends the employment opportunity the more he has to pay to that particular factor of production and the more payment to factor of production the increase in the cost of producing a unit will be observed and in order to maintain the profitability of the product the entrepreneur will inflate the price of that product.

There has been an inverse relation between rate of inflation and the rate of unemployment in an economy.

During tough times, the employment numbers are center stage as economists look for a rebound in job losses. During the recession demand for raw materials and money decreases, resulting in lower commodity prices and interest rates. A similar process will be observed through out the economy when the government intends to create job.

The price of products or services, where the workforce is installed, will increase hence an increase in the rate of inflation will be visible through out the economy. It can be concluded from the aforesaid explanation that when a government intend to lower down the rate of unemployment it had to bear the increase rate of inflation in the national economy.

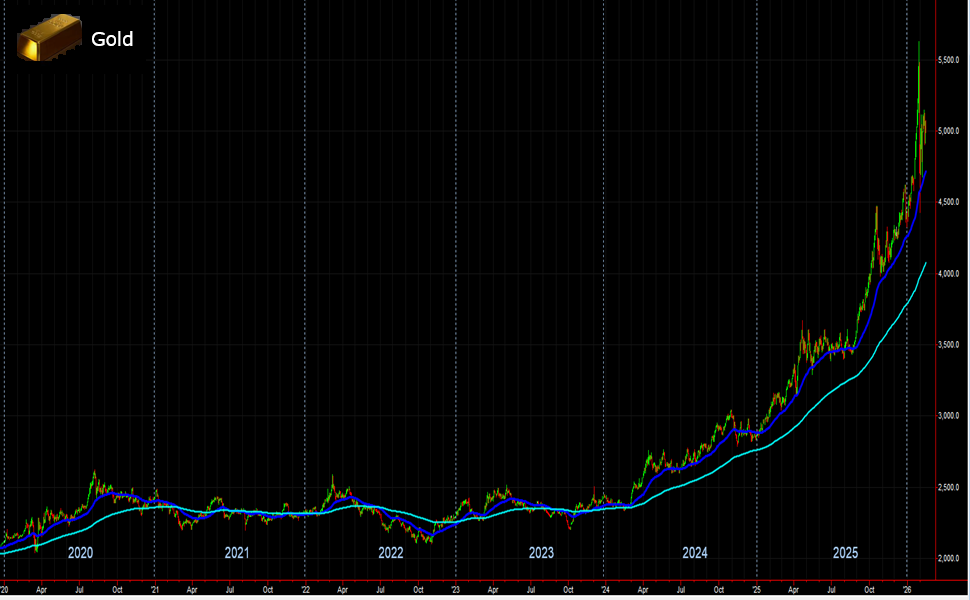
Currencies and Major Economies influenced all

Gold is seen as a hedge against inflation. As the dollar weakens, gold becomes more expensive. Gold becomes more valuable in times of crisis.

When the economy starts to improve, the dollar will strengthen and gold will become less expensive.


China...

What is the relationship between unemployment and GDP?

if you have a 1 % increase in unemployment then you have a 2% lose in GDP

What is the relationship of unemployment and GDP?

The relationship between unemployment and GDP is called Okun's law. It is the association of a higher national economic output with the decrease in national unemployment. This is because in order to...

Interest rates are low now. But when they rise -- and some day they will -- home prices may suffer

For now, mortgage rates are still near historically low levels. But more and more, economists are beginning to worry about a resurgence in inflation and thus rates. That, of course, would remove one of the key underpinnings of the recent boom in real estate.

Other economists say the relationship between home prices and interest rates isn't quite as direct. For one, when rising rates go hand-in-hand with an economic recovery, as they often do, better job prospects partially offset the effects of higher rates.
If rates rise it's because the economy is getting better,"

What will happen if interest rates start going up?

It is nearly a year since the Bank of England, desperate to stave off recession and the potential collapse of the banking system, cut its bank rate to its lowest level yet of just 0.5%.
Inflation, as measured by the Consumer Prices Index (CPI), has jumped to 2.9% and economic activity appears to be picking up with the UK now emerging, just, from recession

But if you want interest rate protection, you really need to go for a five-year fix - starting from 4.75% to 6%, depending on the loan-to-value," he explains
If rates go up and incomes do not, some people are going to be under pressure,"

, because there is no if, just a when. Interest rates have to go up since they can't go any lower. So that just leaves the question of when.

How to Play Rising Interest Rates

The riskiest and most profitable way to play rising yields and a decline in bond prices is to buy call options on the ProShares UltraShort 20+ Year Treasury ETF (NYSE: TBT).

This exchange-traded fund is a double inverse ETF on the value of 20-year-plus Treasuries. When their daily value falls 1%, this ETF theoretically rises 2%. Because it tracks daily movements in bonds, it is more volatile than the long-term movement of the underlying bond.
If you like the idea underpinning the trade interest rates will rise and the market will price this in six months or more before it happens look at TBT January 2012 calls.

         
Top of Page
       
Tradingvesting.com   Data | Source USA Dow Jones 30 | Indexes   Today's Week Today's Week
         
Related Links
Global View  
  Core PCE  
  Producer Price Index  
  Import and Export Prices  
  Employment Cost Injdex (PPI)  
  Cosumer Price Index (CPI)  
 
DATA INFORMATION 10 YEAR
SOURCE Bureau of Labor Statistics (BLS), U.S. Department of Labor
WEB www.bls.gov
FREQUENCY Monthly
AVAILABILITY Mid-month
COVERAGE Data are for the previous month. Data for June are released in July.
REVISIONS No
IMPORTANCE Inflation - Very Important
         
Top of Page
     
Interest Rates
Interest Rates
Meetings
Minutes
Beige Book
Growth
Growth
GDP
US Balance
Spending
Inflation
Growth
CPI
Core PCE
PPI
Employment
Employment
Payroll
Rate
ADP
Manufacturing
Manufacturing
ISM Mfg
Industrial
Factory
Real Estate
Real Estate
Starts
Permits
Shiller
stock market, online trading, ETF, portfolio, dividends, crypto, day trading, shares, how to start investing, broker, day trading, IPO, bull market, bear market, how to invest, margin account, futures, stock market today, stock market futures, investing, stock signals, stock alerts, stockmarket, alerts
 
 
Portfolio | 52-Weeks | Global | Trend500 | Top News | Reports | Charts | Indexes | Today
Vix | Oil | ETFs | Stocks | Futures | 10-Year | S&P 500 | Markets | Register
About | Contact | Log-in | Register | WeDo | Times | Links
Disclaimer | Risk Disclosure | Calendar
 
YouTube Tradingvesting.com | Trading and Investing Twitter
 
All Rights Reserved | www.tradingvesting.com | © Copyright 2008
Discipline - Confidence - Patience