 |
 |
|
 |
PMI Manufacturing Flash | Manufacturing |
|
 |
|
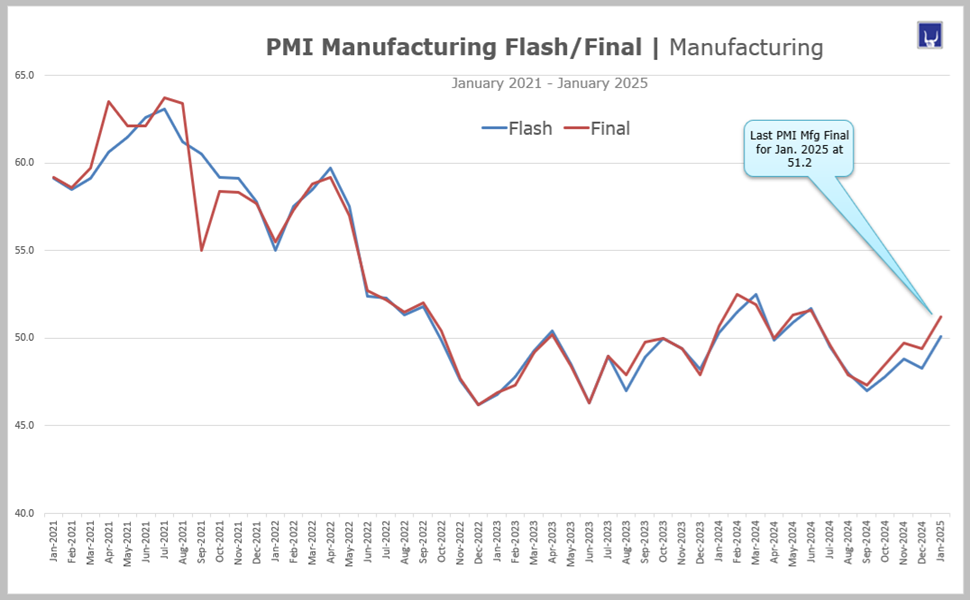
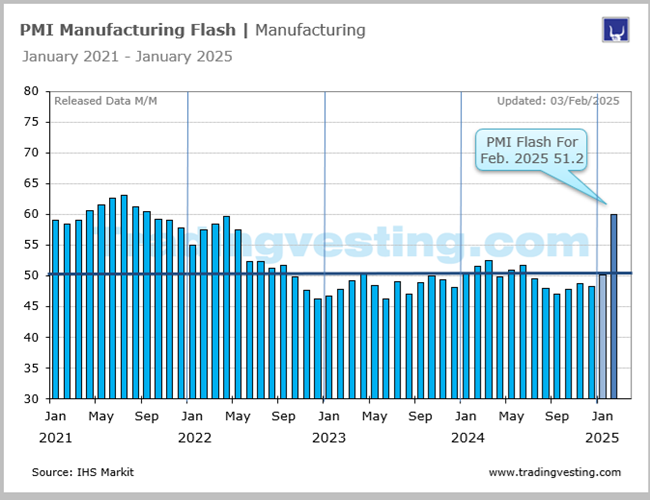
The flash data are released around 10 days ahead of the final report and are typically based upon around 85 percent of the full survey sample. Composite - Manufactuiring - Services, also called PMI Composite Flash.→ Read more
|
|
|
|
|
|
|
| |
|
| |
 7. PMI Composite Flash (7 of 9)
 8. Chicago PMI (8 of 9)
 9. Philadelphia Mfg Index (9 of 9)
 1. ISM Manufacturing Index (1 of 9)
 2. Industrial Production (2 of 9)
 3. Durable Goods Orders (3 of 9)
 4. Factory Orders (4 of 9)
 5. Empire State Mafg Index (5 of 9)
 6. PMI Mfg Final (6 of 9)
|
 |
|
|
|
|
| |
|
→ Big Chart |
|
→ Release |
|
| Este reporte tine 3: composite, mfg y service |
|
hay que dividirlo en 2 y crera nuevo en business activiyy |
|
|
|
|
|
|
|
|
|
|
|
|
|
|
|
|
|
 |
|
Big Chart | Large Data |
 |
|
PMI Manufacturing Flash | Manufacturing |
|
Today's Week |
 |
|
|
|
|
|
|
|
|
|
|
|
|
|
| |
|
|
|
|
|
|
|
|
|
|
|
|
|
|
|
|
|
|
|
|
|
Slides | Ten 10 |
|
|
PMI Manufacturing Flash | Manufacturing |
|
Today's Week |
|
|
|
|
|
|
|
|
|
|
|
|
|
|
| |
|
|
|
|
|
|
|
|
|
|
|
|
|
|
|
|
|
|
|
|
|
Release Schedule | 2026 |
|
|
PMI Manufacturing Flash | Manufacturing |
|
Today's Week |
|
|
|
|
|
|
|
|
|
|
|
|
|
PMI Composite Flash (At 9:45 a.m ET)
| SCHEDULE 2026 |
No 1 |
No 2 |
No 3 |
No 4 |
No 5 |
No 6 |
No 7 |
No 8 |
No 9 |
No 10 |
No 11 |
No 12 |
| Release | Week |
|
|
|
|
|
|
|
|
|
|
|
|
| Release | Date |
|
|
|
|
|
|
|
|
|
|
|
|
| Release | Day |
|
|
|
|
|
|
|
|
|
|
|
|
 |
|
|
|
|
|
|
|
|
|
|
|
|
| Prior |
53.0 |
52.8 |
52.3 |
51.4 |
... |
... |
... |
... |
... |
... |
... |
... |
| Prior Final |
52.7 |
53.0 |
51.9 |
50.3 |
... |
... |
... |
... |
... |
... |
... |
... |
| CONSENSUS |
... |
... |
... |
50.5 |
... |
... |
... |
... |
... |
... |
... |
... |
| COMPOSITE |
52.8 |
52.3 |
51.4 |
52.0 |
... |
... |
... |
... |
... |
... |
... |
... |
|
|
|
|
|
|
|
|
|
|
|
|
|
| MANUFACTURING |
No 1 |
No 2 |
No 3 |
No 4 |
No 5 |
No 6 |
No 7 |
No 8 |
No 9 |
No 10 |
No 11 |
No 12 |
| Prior |
51.8 |
51.9 |
51.2 |
52.4 |
... |
... |
... |
... |
... |
... |
... |
... |
| Prior Final |
51.8 |
52.4 |
51.6 |
52.3 |
... |
... |
... |
... |
... |
... |
... |
... |
| CONSENSUS |
52.0 |
51.9 |
51.0 |
52.5 |
... |
... |
... |
... |
... |
... |
... |
... |
| MANUFACTURING |
51.9 |
51.2 |
52.4 |
54.0 |
... |
... |
... |
... |
... |
... |
... |
... |
| RATING |
|
|
|
|
|
|
|
|
|
|
|
|
|
|
|
|
|
|
|
|
|
|
|
|
|
| SERVICES |
No 1 |
No 2 |
No 3 |
No 4 |
No 5 |
No 6 |
No 7 |
No 8 |
No 9 |
No 10 |
No 11 |
No 12 |
| Prior |
52.9 |
52.5 |
52.3 |
51.1 |
... |
... |
... |
... |
... |
... |
... |
... |
| Prior Final |
52.5 |
52.7 |
51.7 |
49.8 |
... |
... |
... |
... |
... |
... |
... |
... |
| CONSENSUS |
52.8 |
... |
... |
50.0 |
... |
... |
... |
... |
... |
... |
... |
... |
| SERVICES |
52.5 |
52.3 |
51.1 |
54.0 |
... |
... |
... |
... |
... |
... |
... |
... |
| PMI Type |
Flash |
Flash |
Flash |
Flash |
Flash |
Flash |
Flash |
Flash |
Flash |
Flash |
Flash |
Flash |
| Month For: |
Jan-26 |
Feb-26 |
Mar-26 |
Apr-26 |
May-26 |
Jun-26 |
Jul-26 |
Aug-26 |
Sep-26 |
Oct-26 |
Nov-26 |
Dec-26 |
|
|
|
|
|
|
|
|
|
|
|
|
|
|
|
| |
|
| |
|
|
|
|
|
|
|
|
|
|
|
Release Schedule | 2025 |
|
|
PMI Manufacturing Flash | Manufacturing |
|
Today's Week |
|
|
|
|
|
|
|
|
|
|
|
|
|
PMI Composite Flash (At 9:45 a.m ET)
| SCHEDULE 2025 |
No 1 |
No 2 |
No 3 |
No 4 |
No 5 |
No 6 |
No 7 |
No 8 |
No 9 |
No 10 |
No 11 |
No 12 |
| Release | Week |
|
|
|
|
|
|
|
|
|
|
|
|
| Release | Date |
|
|
|
|
|
|
|
|
|
|
|
|
| Release | Day |
|
|
|
|
|
|
|
|
|
|
|
|
|
|
|
|
|
|
|
|
|
|
|
|
|
| Prior |
56.6 |
52.4 |
50.4 |
53.5 |
51.2 |
52.1 |
52.8 |
54.6 |
55.4 |
53.6 |
54.8 |
54.8 |
| Prior Final |
55.4 |
52.7 |
51.6 |
53.5 |
50.6 |
53.0 |
52.9 |
55.1 |
54.6 |
53.9 |
54.6 |
54.2 |
| CONSENSUS |
... |
... |
... |
... |
... |
... |
... |
... |
... |
... |
... |
... |
| COMPOSITE |
52.4 |
50.4 |
53.5 |
51.2 |
52.1 |
52.8 |
54.6 |
55.4 |
53.6 |
54.8 |
54.8 |
54.2 |
|
|
|
|
|
|
|
|
|
|
|
|
|
| MANUFACTURING |
No 1 |
No 2 |
No 3 |
No 4 |
No 5 |
No 6 |
No 7 |
No 8 |
No 9 |
No 10 |
No 11 |
No 12 |
| Prior |
48.3 |
50.1 |
51.6 |
49.8 |
50.7 |
52.3 |
52.0 |
49.5 |
53.3 |
52.0 |
52.2 |
51.9 |
| Prior Final |
49.4 |
51.2 |
52.7 |
50.2 |
50.2 |
52.0 |
52.9 |
49.8 |
53.0 |
52.0 |
52.5 |
52.2 |
| CONSENSUS |
48.9 |
51.3 |
51.8 |
49.4 |
49.8 |
51.0 |
52.7 |
49.7 |
52.0 |
52.1 |
52.3 |
52.0 |
| MANUFACTURING |
50.1 |
51.6 |
49.8 |
50.7 |
52.3 |
52.0 |
49.5 |
53.3 |
52.0 |
52.2 |
51.9 |
51.8 |
| RATING |
|
|
|
|
|
|
|
|
|
|
|
|
|
|
|
|
|
|
|
|
|
|
|
|
|
| SERVICES |
No 1 |
No 2 |
No 3 |
No 4 |
No 5 |
No 6 |
No 7 |
No 8 |
No 9 |
No 10 |
No 11 |
No 12 |
| Prior |
58.5 |
52.8 |
49.7 |
54.3 |
51.4 |
52.3 |
53.1 |
55.2 |
55.4 |
53.9 |
55.2 |
55.0 |
| Prior Final |
56.8 |
52.9 |
51.0 |
54.4 |
50.8 |
53.7 |
52.9 |
55.7 |
54.5 |
54.2 |
54.8 |
54.1 |
| CONSENSUS |
56.7 |
53.0 |
51.2 |
52.5 |
50.6 |
53.0 |
52.7 |
53.0 |
53.5 |
54.0 |
54.8 |
52.0 |
| SERVICES |
52.8 |
49.7 |
54.3 |
51.4 |
52.3 |
53.1 |
55.2 |
55.4 |
53.9 |
55.2 |
55.0 |
52.9 |
| PMI Type |
Flash |
Flash |
Flash |
Flash |
Flash |
Flash |
Flash |
Flash |
Flash |
Flash |
Flash |
Flash |
| Month For: |
Jan-25 |
Feb-25 |
Mar-25 |
Apr-25 |
May-25 |
Jun-25 |
Jul-25 |
Aug-25 |
Sep-25 |
Oct-25 |
Nov-25 |
Dec-25 |
|
|
|
| |
|
| |
|
|
|
|
|
|
|
|
|
|
|
Release Schedule | 2024 |
|
|
PMI Manufacturing Flash | Manufacturing |
|
Today's Week |
|
|
|
|
|
|
|
|
|
|
|
|
|
PMI Composite Flash (At 9:45 a.m ET)
| SCHEDULE 2024 |
No 1 |
No 2 |
No 3 |
No 4 |
No 5 |
No 6 |
No 7 |
No 8 |
No 9 |
No 10 |
No 11 |
No 12 |
| Release | Week |
|
|
|
|
|
|
|
|
|
|
|
|
| Release | Date |
|
|
|
|
|
|
|
|
|
|
|
|
| Release | Day |
|
|
|
|
|
|
|
|
|
|
|
|
|
|
|
|
|
|
|
|
|
|
|
|
|
| Prior: |
51.0 |
52.3 |
51.4 |
52.2 |
50.9 |
54.4 |
54.6 |
55.0 |
54.1 |
54.4 |
54.3 |
55.3 |
| Prior Final: |
50.9 |
52.0 |
52.5 |
52.1 |
51.3 |
54.5 |
54.8 |
54.3 |
54.6 |
54.0 |
54.1 |
54.9 |
| Consensus |
... |
... |
51.5 |
... |
... |
... |
... |
53.3 |
53.0 |
... |
... |
54.6 |
| COMPOSITE |
52.3 |
51.4 |
52.2 |
50.9 |
54.4 |
54.6 |
55.0 |
54.1 |
54.4 |
54.3 |
55.3 |
56.6 |
|
|
|
|
|
|
|
|
|
|
|
|
|
| Consensus |
47.7 |
50.1 |
51.8 |
51.9 |
50.1 |
51.0 |
51.6 |
49.5 |
48.5 |
47.6 |
48.8 |
49.6 |
| MANUFACTURING |
50.3 |
51.5 |
52.5 |
49.9 |
50.9 |
51.7 |
49.5 |
48.0 |
47.0 |
47.8 |
48.8 |
48.3 |
|
|
|
|
|
|
|
|
|
|
|
|
|
| Consensus |
51.0 |
52.0 |
52.0 |
51.9 |
51.4 |
53.7 |
55.0 |
55.0 |
55.2 |
55.0 |
55.1 |
55.9 |
| SERVICES |
52.9 |
51.3 |
51.7 |
50.9 |
54.8 |
55.1 |
56.0 |
55.2 |
55.4 |
55.3 |
57.0 |
58.5 |
| RATING |
|
|
|
|
|
|
|
|
|
|
|
|
| Month For: |
Jan-24 |
Feb-24 |
Mar-24 |
Apr-24 |
May-24 |
Jun-24 |
Jul-24 |
Aug-24 |
Sep-24 |
Oct-24 |
Nov-24 |
Dec-24 |
|
|
|
|
|
|
|
|
|
|
|
|
|
|
|
| |
|
| |
|
|
|
|
|
|
|
|
|
|
|
Release Schedule | 2023 |
|
|
PMI Manufacturing Flash | Manufacturing |
|
Today's Week |
|
|
|
|
|
|
|
|
|
|
|
|
|
PMI Composite Flash (At 9:45 a.m ET)
| SCHEDULE 2023 |
No 1 |
No 2 |
No 3 |
No 4 |
No 5 |
No 6 |
No 7 |
No 8 |
No 9 |
No 10 |
No 11 |
No 12 |
| Release | Week |
|
|
|
|
|
|
|
|
|
|
|
|
| Release | Date |
|
|
|
|
|
|
|
|
|
|
|
|
| Release | Day |
|
|
|
|
|
|
|
|
|
|
|
|
|
|
|
|
|
|
|
|
|
|
|
|
|
| Prior: |
44.7 |
46.6 |
50.2 |
53.3 |
53.5 |
54.5 |
53.8 |
52.0 |
50.4 |
50.1 |
51.0 |
50.7 |
| Prior Revised: |
No |
No |
No |
No |
No |
No |
No |
No |
No |
No |
No |
No |
| Consensus |
No |
No |
No |
No |
No |
No |
No |
No |
No |
No |
No |
No |
| COMPOSITE |
46.6 |
50.2 |
53.3 |
53.5 |
54.5 |
53.0 |
52.0 |
50.4 |
50.1 |
51.0 |
50.7 |
51.0 |
|
|
|
|
|
|
|
|
|
|
|
|
|
| Consensus |
46.5 |
47.3 |
47.2 |
49.2 |
50.0 |
48.5 |
46.0 |
48.8 |
47.8 |
49.5 |
49.9 |
49.2 |
| MANUFACTURING |
46.8 |
47.8 |
49.3 |
50.4 |
48.5 |
46.3 |
49.0 |
47.0 |
48.9 |
50.0 |
49.4 |
48.2 |
|
|
|
|
|
|
|
|
|
|
|
|
|
| Consensus |
45.5 |
47.2 |
50.3 |
51.5 |
52.6 |
53.5 |
54.0 |
52.0 |
50.2 |
49.4 |
50.5 |
50.6 |
| SERVICE |
46.6 |
50.5 |
53.8 |
53.7 |
55.1 |
54.1 |
52.4 |
51.0 |
50.2 |
50.9 |
50.8 |
51.3 |
| RATING |
|
|
|
|
|
|
|
|
|
|
|
|
| Month For: |
Jan-23 |
Feb-23 |
Mar-23 |
Apr-23 |
May-23 |
Jun-23 |
Jul-23 |
Aug-23 |
Sep-23 |
Oct-23 |
Nov-23 |
Dec-23 |
|
|
|
|
|
|
|
|
|
|
|
|
|
|
|
| |
|
| |
|
|
|
|
|
|
|
|
|
|
|
Release Schedule | 2022 |
|
|
PMI Manufacturing Flash | Manufacturing |
|
Today's Week |
|
|
|
|
|
|
|
|
|
|
|
|
|
PMI Composite Flash (At 9:45 a.m ET)
| SCHEDULE 2022 |
No 1 |
No 2 |
No 3 |
No 4 |
No 5 |
No 6 |
No 7 |
No 8 |
No 9 |
No 10 |
No 11 |
No 12 |
| Release | Week |
|
|
|
|
|
|
|
|
|
|
|
|
| Release | Date |
|
|
|
|
|
|
|
|
|
|
|
|
| Release | Day |
|
|
|
|
|
|
|
|
|
|
|
|
|
|
|
|
|
|
|
|
|
|
|
|
|
| Prior: |
56.5 |
50.8 |
56.0 |
58.5 |
55.1 |
53.8 |
53.8 |
47.5 |
45.0 |
49.3 |
49.3 |
46.3 |
| Prior Revised: |
No |
No |
55.9 |
No |
No |
No |
52.3 |
47.7 |
44.6 |
49.5 |
48.2 |
46.4 |
| Consensus |
56.7 |
51.9 |
... |
57.5 |
55.5 |
00 |
00 |
49.2 |
47.0 |
No |
No |
46.7 |
| COMPOSITE |
50.8 |
56.0 |
58.5 |
55.1 |
53.8 |
51.2 |
47.5 |
45.0 |
49.3 |
47.3 |
46.3 |
44.6 |
|
|
|
|
|
|
|
|
|
|
|
|
|
| Consensus |
57.0 |
56.0 |
56.6 |
58.1 |
58.9 |
56.3 |
51.8 |
51.8 |
51.3 |
52.0 |
50.0 |
47.8 |
| MANUFACTURING |
55.0 |
57.5 |
58.5 |
59.7 |
57.5 |
52.4 |
52.3 |
51.3 |
51.8 |
49.9 |
47.6 |
46.2 |
|
|
|
|
|
|
|
|
|
|
|
|
|
| Consensus |
55.0 |
52.2 |
56.0 |
57.9 |
55.3 |
53.6 |
52.3 |
49.0 |
45.0 |
49.3 |
48.0 |
46.5 |
| SERVICEDS |
50.9 |
56.7 |
58.9 |
54.7 |
53.5 |
51.6 |
47.0 |
44.1 |
49.2 |
46.6 |
46.1 |
44.4 |
| RATING |
|
|
|
|
|
|
|
|
|
|
|
|
| Month For: |
Jan-22 |
Feb-22 |
Mar-22 |
Apr-22 |
May-22 |
Jun-22 |
Jul-22 |
Aug-22 |
Sep-22 |
Oct-22 |
Nov-22 |
Dec-22 |
|
|
|
|
|
|
|
|
|
|
|
|
|
|
|
| |
|
| |
|
|
|
|
|
|
|
|
|
|
|
Release Schedule | 2021 |
|
|
PMI Manufacturing Flash | Manufacturing |
|
Today's Week |
|
|
|
|
|
|
|
|
|
|
|
|
|
PMI Composite Flash (At 9:45 a.m ET)
| SCHEDULE 2021 |
No 1 |
No 2 |
No 3 |
No 4 |
No 5 |
No 6 |
No 7 |
No 8 |
No 9 |
No 10 |
No 11 |
No 12 |
| Release | Week |
|
|
|
|
|
|
|
|
|
|
|
|
| Release | Date |
|
|
|
|
|
|
|
|
|
|
|
|
| Release | Day |
|
|
|
|
|
|
|
|
|
|
|
|
|
|
|
|
|
|
|
|
|
|
|
|
|
| Prior |
55.7 |
58.0 |
58.8 |
59.1 |
62.2 |
68.1 |
63.9 |
59.7 |
55.4 |
54.5 |
57.3 |
56.5 |
| Prior Revised |
55.3 |
58.7 |
59.5 |
59.7 |
63.5 |
68.7 |
63.7 |
59.7 |
55.4 |
54.9 |
57.6 |
57.2 |
| CONSENSUS |
55.5 |
57.0 |
... |
... |
.. |
.. |
63.9 |
59.5 |
55.5 |
57.5 |
57.8 |
56.5 |
| COMPOSITE |
58.0 |
58.8 |
59.1 |
62.2 |
68.1 |
63.9 |
59.7 |
55.4 |
54.5 |
57.3 |
56.5 |
56.9 |
|
|
|
|
|
|
|
|
|
|
|
|
|
| CONSENSUS |
57.1 |
59.0 |
... |
60.5 |
... |
... |
62.1 |
63.1 |
60.8 |
60.7 |
58.6 |
58.5 |
| MANUFACTURING |
59.1 |
58.5 |
59.1 |
60.6 |
61.5 |
62.6 |
63.1 |
61.2 |
60.5 |
59.2 |
59.1 |
57.8 |
|
|
|
|
|
|
|
|
|
|
|
|
|
| CONSENSUS |
53.8 |
58.0 |
.. |
61.9 |
... |
... |
64.6 |
59.7 |
55.1 |
55.2 |
59.0 |
58.5 |
| SERVICES |
57.5 |
58.9 |
60.4 |
63.1 |
70.1 |
64.8 |
59.8 |
55.2 |
54.4 |
58.2 |
57.0 |
57.5 |
| RATING |
|
|
|
|
|
|
|
|
|
|
|
|
| Month For: |
Jan-21 |
Feb-21 |
Mar-21 |
Apr-21 |
May-21 |
Jun-21 |
Jul-21 |
Aug-21 |
Sep-21 |
Oct-21 |
Nov-21 |
Dec-21 |
|
|
|
|
|
|
|
|
|
|
|
|
|
|
|
| |
|
|
| |
|
|
|
|
|
|
|
|
|
|
|
|
|
|
|
|
|
|
|
|
|
Brief News | 2026 |
|
|
PMI Manufacturing Flash | Manufacturing |
|
Today's Week |
|
|
|
|
|
|
|
|
|
|
|
|
|
PMI Composite Flash (At 9:45 a.m ET)
| DATE/WEEK |
HIGHLIGHTS |
FOR |
MFG |
|
Composite PMI Flash |
No 12 |
... |
|
Dec-2026 |
|
| |
|
|
|
Composite PMI Flash |
No 11 |
... |
|
Nov-2026 |
|
| |
|
|
|
Composite PMI Flash |
No 10 |
... |
|
Oct-2026 |
|
| |
|
|
|
Composite PMI Flash |
No 9 |
... |
|
Sep-2026 |
|
| |
|
|
|
Composite PMI Flash |
No 8 |
... |
|
Aug 2026 |
|
| |
|
|
|
Composite PMI Flash |
No 7 |
... |
|
Jul-2026 |
|
| |
|
|
|
Composite PMI Flash |
No 6 |
... |
|
Jun-2026 |
|
| |
|
|
|
Composite PMI Flash |
No 5 |
... |
|
May-2026 |
|
| |
|
|
|
Composite PMI Flash |
No 4 |
... |
|
Apr-2026 |
|
| |
|
|
|
Recent data shows the Flash Manufacturing PMI came in at 52.4, beating estimates, indicating a positive outlook for the manufacturing sector. The index reflects the first impacts of economic conditions, such as inflation and supply chain disruptions, on manufacturing activity.This data is crucial for businesses and policymakers to make informed decisions regarding production and procurement strategies. |
No 3 |
52.4 |
|
Mar-2026 |
|
| |
|
|
|
Flash PMI indicates slowest business growth for ten months in February amid weak demand, high prices and bad weather. U.S. business activity expanded in February at the slowest rate in 10 months as orders receded at factories, new business growth slackened for services firms and employment growth stalled across the board, a survey showed on Friday. S&P Global said its flash U.S. Composite PMI Output Index, which tracks the manufacturing and services sectors, slipped this month to 51.2 - the lowest since April - from 51.9 in January. A reading above 50 indicates expansion in the private sector. Both services and manufacturing flash PMIs edged down this month. |
No 2 |
51.2 |
|
Feb-2026 |
|
| |
|
|
|
The S&P Global US Manufacturing PMI rose from 51.8 in December to 51.9 in January 2026. Despite the rise, the PMI still signalled the second-weakest improvement in factory business. The flash PMI for manufacturing in January 2026 is 52.8, indicating a slight improvement in business activity compared to December. However, this reading remains below the typical expansion rates seen in the second half of 2025, suggesting that underlying demand is softening, particularly in new orders. |
No 1 |
51.9 |
|
Jan-2026 |
|
| |
|
|
|
|
|
|
|
|
| |
|
|
|
|
|
| |
|
|
|
|
|
|
|
|
|
|
|
|
|
|
|
Brief News | 2025 |
|
|
PMI Manufacturing Flash | Manufacturing |
|
Today's Week |
|
|
|
|
|
|
|
|
|
|
|
|
|
PMI Composite Flash (At 9:45 a.m ET)
| DATE/WEEK |
HIGHLIGHTS |
FOR |
MFG |
|
The Flash Manufacturing PMI is an early estimate of a country's manufacturing sector's health, based on approximately 85% to 90% of total PMI survey responses each month. It provides insights into economic activity, with readings above 50 indicating expansion and below 50 indicating contraction. The latest data for December shows a slight decline in the Flash Manufacturing PMI, with a reading of 51.8, compared to an estimate of 52.0. This index is crucial for investors and policymakers as it serves as a leading indicator of economic trends and can significantly influence market movements. |
No 12 |
51.8 |
|
Dec-2025 |
|
| |
|
|
|
The S&P Global Flash US Manufacturing PMI for November 2025 fell to 51.9, the lowest in four months. This decline was attributed to a weakening in new order book growth and a lengthening of lead times, while inventories of inputs remained largely unchanged. Despite the decline, the PMI still indicated an improvement in factory business conditions for the tenth time in the past eleven months. The manufacturing PMI's decline was offset by resilience in services, where the PMI rose to 55 from 54.8 in October, with new orders for services firms also strengthening. Overall, the composite output index, which tracks both manufacturing and services, edged up to 54.8 from 54.6, signaling continued expansion across the broader economy. |
No 11 |
51.9 |
|
Nov-2025 |
|
| |
|
|
|
Flash US Manufacturing PMI: 52.2 (September: 52.0). 2-month high. US business activity growth accelerated in October to the second-fastest so far this year, according to early ‘flash’ PMI data, accompanied by the largest rise in new business seen in 2025 to date. Improvements in output and new work were recorded in manufacturing and services, though both sectors signaled falling exports. Factories also reported falling input buying amid a steep drop in backlogs of work and an unprecedented build-up of unsold stock. |
No 10 |
52.1 |
|
Oct-2025 |
|
| |
|
|
|
Flash US S&P Global Manufacturing PMI came in at 52 in September 2025. US business activity lost momentum in September, according to the flash reading of S&P Global’s Composite PMI, which ticked down to 53.6 from 54.6 in August. The index, where any reading above 50 indicates expansion, points to a private sector that seems to be struggling to strengthen furt. |
No 9 |
52.0 |
|
Sep-2025 |
|
| |
|
|
|
The latest S&P Global U.S. PMI Composite Flash data showed accelerated business activity growth in August 2025, with the headline index rising to an eight-month high of 55.4, driven by stronger expansions in both manufacturing and service sectors. This marked the strongest back-to-back growth since Spring 2022, with factories leading the way. However, price pressures also increased, with input costs rising at their steepest rate since May 2023, with businesses citing tariffs as a primary driver of these higher costs. The Manufacturing PMI surged to 53.3 in August, its highest level since May 2022, after a dip in July. |
No 8 |
53.3 |
|
Aug 2025 |
|
| |
|
|
|
The S&P Global U.S. PMI Composite Flash for July 2025 showed robust growth, with the composite output index rising to 54.6, indicating the fastest expansion of the year. This was driven by strong services activity, though the manufacturing sector experienced a contraction due to tariff impacts, leading to uneven growth and increased selling price inflation. Despite higher output, business sentiment eased to a three-month low, raising concerns about future growth sustainability.Output in the manufacturing sector contracted 49.5 for the first time in 2025, falling into a contractionary zone. |
No 7 |
49.5 |
|
Jul-2025 |
|
| |
|
|
|
Composite PMI Flash, the S&P Global U.S. PMI Composite Flash for June 2025 registered 52.8, slightly down from 53.0 in the May final, indicating a minor loss of momentum in overall U.S. private sector activity, While manufacturing saw a renewed fall in June, the services sector continued to show growth, with the overall composite index reflecting this dynamic. |
No 6 |
52.0 |
|
Jun-2025 |
|
| |
|
|
|
Composite PMI Flash, The US S&P PMI manufacturing flash rises to 52.3 in May, a three-month high, from 50.2 in the April final, and well above the 49.8 Econoday consensus. Meanwhile, the US S&P PMI services flash also rises to 52.3 in May, a two-month high, from 50.8 in the April final, and also topping the 50.6 Econoday consensus. The US S&P PMI composite flash is up to 52.1 in May, a two-month high, from 50.8 in the April final. |
No 5 |
52.3 |
|
May-2025 |
|
| |
|
|
|
Composite PMI Flash, The expected hit from tariffs was less than anticipated in the S&P PMI manufacturing index, which actually edged up to 50.7 in the April flash, a two-month high, from 50.2 in the March final. The Econoday consensus saw the index slipping into modest contraction at 49.4 for the April flash. The flash services PMI remained positive at 51.4, a two-month low, versus 54.4 in March, and versus the expected 52.5. The composite eased to 51.2 in the April flash, a 16-month low, from 53.5.
|
No 4 |
50.7 |
|
Apr-2025 |
|
| |
|
|
|
The S&P Global US Composite Purchasing Managers' Index came in at 53.5 in March, up from 51.6 in February. The US Manufacturing PMI was 49.8 in March, compared to 52.7 in February, and below expectations for 51.8 in the Econoday survey of forecasters. The US Services PMI Business Activity Index recorded 54.3 in March, up from 51.0 in February, and above expectations of 51.2. |
No 3 |
49.8 |
|
Mar-2025 |
|
| |
|
|
|
Composite PMI Flash, The S&P Global U.S. Composite PMI flash reading for February 2025 indicated a significant deceleration in business activity, with the index falling to 50.4 from 52.7 in January, reaching its lowest level in 17 months. This decline suggests a near-stalling of overall economic expansion in the private sector, with services sector momentum particularly waning, although manufacturing showed a slight increase |
No 2 |
51.6 |
|
Feb-2025 |
|
| |
|
|
|
Composite PMI Flash, The S&P Global U.S. Composite PMI Flash for January 2025 showed a slowdown in output growth, with the Composite Output Index falling to 52.4 from a 32-month high of 55.4 in December 2024, indicating the slowest growth since April 2024, according to S&P Global. While the U.S. continued to outpace other developed economies like the eurozone and Japan in terms of PMI, its rate of expansion slowed, unlike the improvement seen elsewhere, according to S&P Globa |
No 1 |
50.1 |
|
Jan-2025 |
|
| |
|
|
|
|
|
|
|
|
| |
|
|
|
|
|
| |
|
|
|
|
|
|
|
|
|
|
|
|
|
|
|
Brief News | 2024 |
|
|
PMI Manufacturing Flash | Manufacturing |
|
Today's Week |
|
|
|
|
|
|
|
|
|
|
|
|
|
PMI Composite Flash (At 9:45 a.m ET)
| DATE/WEEK |
HIGHLIGHTS |
FOR |
COMPO |
|
U.S. Composite PMI rises to highest since March 2022 in December 2024. The S&P Global's U.S. Composite PMI rose to 56.6 in December's flash estimate from 54.9 in November, indicating the fastest expansion of business activity since March 2022 amid strength in the services economy and further deterioration in manufacturing production. A further climb in service sector activity (services PMI: 58.5 vs. 55.7 consensus and 56.1 prior) contrasted with a steeper fall in manufacturing production. |
No 12 |
56.6 |
|
Dec-2024 |
|
| |
|
|
|
US S&P Global Composite PMI rose to 55.3 in November's flash estimate from 54.1 in October, showing that the business activity in the US' private sector continued to expand at an accelerating pace. S&P Global Manufacturing PMI improved to 48.8 from 48.5, highlighting an ongoing contraction, while the Services PMI rose to 57 from 55. Assessing the survey's findings, "the business mood has brightened in November, with confidence about the year ahead hitting a two-and-a-half year high," Chris Williamson, Chief Business Economist at S&P Global Market Intelligence said. The prospect of lower interest rates and a more probusiness approach from the incoming administration has fueled greater optimism, in turn helping drive output and order book inflows higher in November. |
No 11 |
55.3 |
|
Nov-2024 |
|
| |
|
|
|
The flash US S&P Global October Composite PMI edged higher to 54.3 after printing at 54.0 final in September. Manufacturing activity improved to 47.8 from 47.3 in September, beating the anticipated 47.5. The services index printed at 55.3, up from 55.2 in the previous month and above the 55 forecast. "October’s flash US PMI survey signalled a further solid rise in business activity to mark a robust start to the fourth quarter. Growth was driven solely by the service sector, however, as manufacturing output contracted for a third month running. Meanwhile, employment fell slightly for a third successive month amid uncertainty ahead of the Presidential Election," the official report states. |
No 10 |
54.3 |
|
Oct-2024 |
|
| |
|
|
|
U.S. PMI Composite Flash at 54.4 better than expected consensus of 53.0 in September 2024. The S&P Global U.S. PMI Composite edged down to 54.4 in September 2024 from Prior Final of 54.6 in August 2024. The manufacturing Index edged down to 47.0 from Prior Final of 47.9 and a consensus of 48.5. The Services Index also down to 55.4 from a Prior Final of 55.7 and little better than consensus of 55.2. All three components were down from thedir Prior Final. US Composite PMI declined from 54.6 in August to 54.4 in September 2024. US Manufacturing PMI down from 47.9 in August to 47.0 in September 2024. US Services PMI decreased from 55.7 in August to 55.4 in September 2024. |
No 9 |
54.4 |
|
Sep-2024 |
|
| |
|
|
|
US S&P Manufacturing PMI falls to 48 in August, Composite PMI declines to 54.1. US S&P Global Composite PMI edged lower to 54.1 in August's flash estimate from 54.3 in July, showing that the business activity in the US' private sector continued to expand at a healthy pace. This reading came in better than the market expectation of 53.5. S&P Global Manufacturing PMI slumped to 48 in the same period from 49.6, highlighting an ongoing contraction, while the Services PMI rose to 55.2 from 55. |
No 8 |
54.1 |
|
Aug 2024 |
|
| |
|
|
|
US July flash services PMI 56.0 vs 55.0 expected. The flash PMI data signal a ‘Goldilocks’ scenario at the start of the third quarter, with the economy growing at a robust pace while inflation moderates Manufacturing PMI 49.5 vs. 51.7 expected and 51.6 prior. Composite PMI 55.0 vs. 54.8 prior. S&P Global said on Wednesday that its flash U.S. Composite PMI Output Index, which tracks the manufacturing and services sectors, edged up to 55.0 this month. That was the highest level since April 2022 and followed a final reading of 54.8 in June. |
No 7 |
55.0 |
|
Jul-2024 |
|
| |
|
|
|
US business activity inches up in June; price pressures abating. Both the services and manufacturing sectors contributed to the gain in activity. US business activity crept up to a 26-month high in June amid a rebound in employment, but price pressures subsided considerably, offering hope that a recent slowdown in inflation was likely to be sustained. S&P Global said on Friday (Jun 21) that its flash US Composite PMI Output Index, which tracks the manufacturing and services sectors, nudged up to 54.6 this month. That was the highest level since April 2022 and followed a final reading of 54.5 in May. A reading above 50 indicates expansion in the private sector. Both the services and manufacturing sectors contributed to the gain in activity. |
No 6 |
54.6 |
|
Jun-2024 |
|
| |
|
|
|
US Business Activity Expands Most in Two Years, Prices Pick Up. S&P Global’s flash May gauge advanced to 54.4 from 51.3. Composite measures of prices paid, received both rise. US business activity accelerated in early May at the fastest pace in two years, largely reflecting stronger growth at service providers and accompanied by a pickup in inflation. The S&P Global flash May composite purchasing managers index advanced by more than 3 points to 54.4, the highest since April 2022. Figures higher than 50 indicate expansion. The gauge topped all estimates in a Bloomberg survey of economists. |
No 5 |
54.4 |
|
May-2024 |
|
| |
|
|
|
US PMI composite falls to 50.9, economic upturn loses momentum. US PMI Manufacturing fell from 51.9 to 49.9 in April. PMI Services fell from 51.7 to 50.9. PMI Composite fell from 52.1 to 50.9. The US economic upturn lost momentum at the start of the second quarter, with the flash PMI survey respondents reporting below-trend business activity growth in April. Further pace may be lost in the coming months, as April saw inflows of new business fall for the first time in six months and firms’ future output expectations slipped to a five-month low amid heightened concern about the outlook. |
No 4 |
50.9 |
|
Apr-2024 |
|
| |
|
|
|
US Composite PMI declined from 51.4 in June to 52.2 in March 2024. US Manufacturing PMI grew from 51.5 in February to 52.5 in March 2024. US Services PMI increased from 51.3 in February to 51.7 in March 2024. |
No 3 |
52.2 |
|
Mar-2024 |
|
| |
|
|
|
Flash February PMI Indicates Favorable Growth for US Economy. Strength in manufacturing bolstered job creation, and initial data suggests inflation pressures eased during the month. S&P Global's preliminary take on February Manufacturing and Services PMI data is out and while it was down compared to January, the composite reading of 51.4 tells us the economy continued to grow in February. Parsing the data we find the Manufacturing economy accelerated month over month, hitting a 17-month high, while the pace of the Services economy slowed. The combined picture points to an economy continuing to grow above trend, and the continued strength in new orders suggests that will continue. |
No 2 |
51.4 |
|
Feb-2024 |
|
| |
|
|
|
U.S. Business Activity Picks Up Pace at Start of Year, PMIs Show. U.S. business activity grew more quickly in January thanks to a strong services sector and recovery in manufacturing, a purchasing managers' survey showed Wednesday. The S&P Global Flash U.S. Composite PMI--which gauges activity in the manufacturing and services sectors--rose to 52.3 from 50.9 in the last month of last year. The reading suggests that U.S. economic activity is accelerating as 2024 gets going. The index for services showed the sector growing at a faster rate, rising to 52.9 from 51.4 in December. The manufacturing index meanwhile turned positive, hitting 50.3 compared with 47.9 previously. Both exceeded economists' forecasts set out in a poll compiled by The Wall Street Journal. |
No 1 |
52.3 |
|
Jan-2024 |
|
| |
|
|
|
|
|
|
|
|
| |
|
|
|
|
|
| |
|
|
|
|
|
|
|
|
|
|
|
|
|
|
|
Brief News | 2023 |
|
|
PMI Manufacturing Flash | Manufacturing |
|
Today's Week |
|
|
|
|
|
|
|
|
|
|
|
|
|
PMI Composite Flash (At 9:45 a.m ET)
| DATE/WEEK |
HIGHLIGHTS |
FOR |
COMPO |
|
U.S. Business Activity Expands at Fastest Pace in Five Months, PMI Data Suggest. S&P Global Flash U.S. Composite PMI climbed to 51.0 in December. U.S. business activity expanded slightly in December, a little stronger than the prior month, as new orders improved despite a still weak environment for the manufacturing sector, a purchasing managers’ survey said Friday. The S&P Global Flash U.S. Composite PMI—which gauges activity in the manufacturing and services sectors—climbed to a five-month high of 51.0 in December, from 50.7 in November. |
No 12 |
51.0 |
|
Dec-2023 |
|
| |
|
|
|
U.S. business activity held steady in November, but employment in the private sector declined for the first time in almost three-and-a-half years, consistent with expectations for an economic slowdown in the fourth quarter. S&P Global said on Friday that its flash U.S. Composite PMI Output Index, which tracks the manufacturing and services sectors, was unchanged at 50.7 this month as a modest rise in services sector activity offset a contraction in manufacturing. A reading above 50 indicates expansion in the private sector. The survey's flash manufacturing PMI dropped to 49.4 this month from 50.0 in October. Its flash services sector PMI edged up to 50.8 from 50.6 in the prior month. Economists expect overall economic activity to moderate considerably this quarter as the lagged effects of higher interest rates from the Federal Reserve start to have a greater impact. Since March 2022, the U.S. central bank has raised its policy rate by 525 basis points to the current 5.25%-5.50% band. The flash composite new orders index increased to 50.4 in November, ending three straight monthly declines. The modest rise from a reading of 49.0 in October was mostly driven by the services sector, with factory orders stagnant. |
No 11 |
50.7 |
|
Nov-2023 |
|
| |
|
|
|
US business activity ticked up last month, driving hopes of soft landing. Business activity accelerated in October, reversing a downward trend many economists had expected to continue. S&P Global's flash US composite PMI for October, which captures activity in both the services and manufacturing sectors, came in at 51 in October, up from 50.2 in September and better than the 50 that had been expected by economists. The US manufacturing PMI improved to a reading above 50, considered a sign of expansion. S&P Global noted in the release that October marked the first time manufacturing demand picked up in six months. And, importantly, the long-term outlook for business participants has picked up too. Service providers are now the most confident they've been about the next 12 months since May 2022. |
No 10 |
51.0 |
|
Oct-2023 |
|
| |
|
|
|
U.S. business activity nears stand-still in September, survey says. U.S. business activity showed little change in September, with the vast services sector essentially idling at the slowest pace since February, and overall new order activity slipping to the lowest level this year, a survey published Friday showed. S&P Global said its flash U.S. Composite PMI index, which tracks the manufacturing and service sectors, dipped to a reading of 50.1 in September from a final reading for August of 50.2. September's result was negligibly above the 50 level that separates expansion and contraction. The survey's composite new orders index slid to the lowest since December at 47.7 from 49.2 last month, marking the second straight month of declining new business. Input cost pressures ticked higher for a second month as well. |
No 9 |
50.1 |
|
Sep- 2023 |
|
| |
|
|
|
The headline S&P Global Flash US PMI Composite Output Index indicated only a fractional increase in output across the private sector midway through the third quarter. At 50.4 in August, down from 52.0 in July, the latest reading signalled the weakest upturn in activity since February. Persistent challenges stimulating demand in the manufacturing sector were accompanied by slower growth in service sector output. At 47.0, down from 49.0 in July, the S&P Global Flash US Manufacturing PMI signalled a solid deterioration in operating conditions midway through the third quarter. At 51.0, down from 52.3 in July, US Services PMI Business Activity Index registered its 6-month low. Manufacturing PMI Output Index rose to 47.5 in August from 50.2 in July. |
No 8 |
50.4 |
|
Aug-2023 |
|
| |
|
|
|
U.S. Composite PMI Falls Amid Slowing Growth In Services. The report indicated that the overall rate of output growth was consistent with GDP expanding at approximately 1.5% at the start of the third quarter. Manufacturing PMI grew from 46.3 in June to 49 in July. Services PMI decreased from 54.4 in June to 52.4 in July. Composite PMI declined from 53.2 in June to 52 in July. On July 24, S&P Global released Flash PMI reports for July. Manufacturing PMI increased from 46.3 in June to 49 in July, compared to analyst consensus of 46.4. Numbers below 50 show contraction. Services PMI declined 54.4 to 52.4, compared to analyst consensus of 54. Numbers above 50 show expansion. Composite PMI decreased from 53.2 to 52 due to the weaker-than-expected performance of the Services sector. |
No 7 |
52.0 |
|
Jul-2023 |
|
| |
|
|
|
U.S. business activity fell to a three-month low in June as services growth eased for the first time this year and the contraction in the manufacturing sector deepened, closely watched survey data out Friday showed. S&P Global said its flash U.S. Composite PMI Output Index, which tracks the manufacturing and services sectors, fell to a reading of 53.0 this month, the lowest since March. Nonetheless, it was the fifth straight month that the PMI remained above 50, indicating growth in the private sector. The survey data, which was collected between June 12-22, added to evidence the U.S. economy has continued expanding in the April-through-June period, although it is increasingly reliant on the vast services sector for overall growth in gross domestic product. "The overall rate of expansion of business activity in the US remained robust in June, consistent with GDP rising at a rate of 1.7% to put second quarter growth in the region of 2%," said Chris Williamson, chief business economist at S&P Global Market Intelligence. |
No 6 |
53.0 |
|
Jun-2023 |
|
| |
|
|
|
U.S. business activity increased to a 13-month high in May, lifted by strong growth in the services sector, the latest indication that the economy regained momentum early in the second quarter despite rising risks of a recession. S&P Global said on Tuesday its flash U.S. Composite PMI Output Index, which tracks the manufacturing and services sectors, rose to a reading of 54.5 this month. That was the highest level since April 2022 and followed a final reading of 53.4 in April. It was the fourth straight month that the PMI remained above 50, indicating growth in the private sector. The survey data, which was collected between May 12-22, added to data this month that showed labor market resilience, with job growth accelerating in April and the unemployment rate falling back to a 53-year low of 3.4%. Retail sales excluding motor vehicles, gasoline, building materials and food services rebounded strongly, while production at factories and homebuilding picked up. |
No 5 |
54.5 |
|
May-2023 |
|
| |
|
|
|
United States: Composite PMI hits 11-month high in April 2023. The S&P Global Flash Composite Purchasing Managers’ Index (PMI) came in at 53.5 in April, up from March’s 52.3. April’s result marked the strongest reading since May 2022. As such, the index moved further above the 50.0 no-change threshold, signaling a faster improvement in private sector operating conditions compared to the previous month. The Manufacturing PMI stood at 50.4 in April, up from March’s 49.2. Lastly, the services PMI activity index rose to 53.7 in April (March: 52.6). In the private sector as a whole, employment growth accelerated and output rose at the fastest pace in nearly a year, supported by improved supply chains, stronger demand and rising new orders. That said, new export orders continued to decline in April, and both input and output price inflation intensified. |
No 4 |
53.5 |
|
Apr-2023 |
|
| |
|
|
|
Business Activity Rebounded in March on Higher Demand, Service Sector Strength. S&P Global's Composite Purchasing Managers' Index (PMI) rose to 53.3 from 50.1 in February. U.S. companies reported a big jump in business activity this month as demand surged, especially in the services industry. The S&P Global Flash US Composite Purchasing Managers’ Index (PMI) for March was 53.3, up from 50.1 in February. The Services Business Activity Index rose to 53.8 from 50.6, while the Manufacturing Output Index rose to 49.3 from 47.3. S&P Global. "S&P Global Flash US Composite PMI: March 24, 2023 News Release." All exceeded economists' forecasts. Any reading above 50 indicates an expansion in business activity. |
No 3 |
53.3 |
|
Mar-2023 |
|
| |
|
|
|
United States: Composite PMI hits highest reading since June 2022 in February 2023. The S&P Global Flash Composite Purchasing Managers’ Index (PMI) rose to 50.2 in February from January’s 46.8. February’s result marked the strongest reading since June 2022. As a result, the index rose above the 50.0 no-change threshold, signaling an improvement in private sector operating conditions from the previous month. The Manufacturing PMI came in at 47.8 in February, up from January’s 46.9. Lastly, the services PMI activity index rose to 50.5 in February (January: 46.8). Across the private sector as a whole, in February employment growth accelerated, the contraction in new orders eased and input cost inflation ebbed. Moreover, business sentiment rose to the highest level since May 2022. |
No 2 |
50.2 |
|
Feb-2023 |
|
| |
|
|
|
A marginally slower rate of contraction is the best news in what are otherwise weak PMI flashes for January. Services rose 1.6 points from December to 46.6 while manufacturing rose 6 tenths to 46.8; both readings remain well below breakeven 50 to indicate that significantly more respondents are reporting month-over-month declines in composite volumes. The biggest negative in the report, one tied to high costs for finished goods, is a sharp drop in manufacturing orders. This echoes last week's results from the Empire State and Philadelphia surveys. In contrast, contraction in new orders eased among service providers. The PMI's have been sinking deeper into contraction, and no relief is expected for January. Manufacturing is seen at 46.5 with services at 45.5. |
No 1 |
46.6 |
|
Jan-2023 |
|
| |
|
|
|
|
|
|
|
|
| |
|
|
|
|
|
| |
|
|
|
|
|
|
|
|
|
|
|
|
|
|
|
Brief News | 2022 |
|
|
PMI Manufacturing Flash | Manufacturing |
|
Today's Week |
|
|
|
|
|
|
|
|
|
|
|
|
|
PMI Composite Flash (At 9:45 a.m ET)
| DATE/WEEK |
HIGHLIGHTS |
FOR |
COMPO |
|
The headline Flash US PMI Composite Output Index registered 44.6 in December, down from 46.4 in November, to signal the joint-fastest decline in business activity for over two-and-a-half years as 2022 was brought to a close. Excluding the initial pandemic period, however, the downturn was the joint-sharpest since 2009.PMI Composite Flash comes in lower than expected in Decedmber 2022. December S&P Global U.S. PMI Composite: 44.6 vs. 46.7 consensus and 46.3 prior. The gauge indicates a further decline in output this month. |
No 12 |
44.6 |
|
Dec-2022 |
|
| |
|
|
|
U.S. business activity contracted for a fifth straight month in November, with a measure of new orders dropping to its lowest level in 2-1/2 years as higher interest rates slowed demand. S&P Global said on Wednesday its flash U.S. Composite PMI Output Index, which tracks the manufacturing and services sectors, fell to 46.3 this month from a final reading of 48.2 in October. A reading below 50 indicates contraction in the private sector. Activity is slumping under the weight of the Federal Reserve's most aggressive interest rate-hiking cycle since the 1980s aimed at curbing inflation by dampening economic demand. The flash composite new orders index dropped to 46.4, the lowest level since May 2020, from a final reading of 49.2 in October. Outside the initial wave of the COVID-19 pandemic, this was the worst reading since 2009. |
No 11 |
46.3 |
|
Nov-2022 |
|
| |
|
|
|
US Manufacturing PMI at 28-Month Low, Services Back in Contraction With Strong Declines. Private sector firms in the US recorded a further downturn in output at the start of the fourth quarter, according to latest ‘flash’ PMI™ data from S&P Global. The fall in business activity was solid and stronger than that seen in September, as service providers signalled a quicker decline. Manufacturers, on the other hand, saw output rise for the second month running, albeit only marginally. The headline Flash US PMI Composite Output Index registered 47.3 in October, down from 49.5 in September. With the exception of the initial pandemic period, the rate of decrease was the second-fastest since 2009. |
No 10 |
47.3 |
|
Oct-2022 |
|
| |
|
|
|
The S&P Global Flash Composite Purchasing Managers’ Index (PMI) came in at 49.3 in September, up from August’s 44.6. As such, the index moved closer to the 50.0 no-change threshold, signaling a softer deterioration in private sector operating conditions compared to the previous month. The Manufacturing PMI came in at 51.8 in September, up from August’s 51.5, while the services PMI activity index increased to 49.2 in September (August: 43.7). The slower downturn in private-sector activity in September was driven by a rebound in new orders. Moreover, cost pressures and supply constraints eased in the month, while business optimism for the 12-month outlook improved. However, new export orders continued to contract, and employment growth slowed. September data points to resilient economic activity, and should allay fears that the economy is currently in a steep downturn. However, the economy will almost inevitably lose steam ahead as the Fed continues its aggressive tightening path. |
No 9 |
49.3 |
|
Sep-2022 |
|
| |
|
|
|
US business activity falls at its fastest rate since May 2020. Customers browse racks of clothing as they shop inside a discount department retail store in Las Vegas, Nevada, on May 7, 2022. - The US economy added a better-than-expected 428,000 jobs in April, with the unemployment rate remaining at a low 3.6 percent, the Labor Department reported. The data pointed to continued strong employment growth and contained hints that some inflationary pressures may be easing, with workers' wages rising less than in March. But investors remain anxious that rising prices and higher interest rates will hit consumers, slowing the economy's expansion in the second half of 2022. Business activity at private US companies in early August dropped off at some of the sharpest rates seen since the beginning of the pandemic as rising interest rates and high inflation crimped consumer spending, according to data released Tuesday. The latest S&P Global preliminary flash composite purchasing managers index, or PMI, registered a level of 45 as of August 22, down from 47.7 in July. |
No 8 |
45.0 |
|
Aug-2022 |
|
| |
|
|
|
U.S. July flash PMI data show ‘worrying deterioration’ in economy. Service sector contracts for first time in over two years. The numbers: The U.S. services PMI fell to a 26-month low of 47 in July from 51.6 in the prior month, based on a “flash” survey from S&P Global Market Intelligence. Readings below 50 signifies contraction. The manufacturing flash PMI slid to 52.3 from 52.7 in June. This was the weakest level in two years. |
No 7 |
47.5 |
|
Jul-2022 |
|
| |
|
|
|
U.S. manufacturing and services PMI come in lower than expected for June 2022. We've got the PMIs coming from S&P Global and they're not good. So we have the June preliminary reading, 52.4. That is a big drop from 57 that was registered the prior month. Services, 51.6, down from 53.4. And the composite-- the manufacturing PMI, excuse me, at 52.4. The composite PMI at 51.2. All of these are decreases. The manufacturing one is especially sharp. But it's interesting that the services one is seeing that kind of a drop, considering that services are supposed to be holding up better. Remember 50, the dividing line between expansion and contraction. And speaking of contraction, there was the first drop in new orders since July of 2020. According to S&P Global, new export orders contracted at the steepest pace since June of 2020. |
No 6 |
51.2 |
|
Jun-2022 |
|
| |
|
|
|
U.S. PMI composite flash signals composite index well below consensus. May U.S. PMI Composite Index (Flash): 53.8 vs. 55.5 consensus vs. 56.0 prior. Manufacturing Index: 57.5 vs. 58.9 consensus vs. 59.7 prior. Services Index: 53.5 vs. 55.3 consensus vs. 55.6 prior. |
No 5 |
53.8 |
|
May-2022 |
|
| |
|
|
|
U.S. PMI composite flash signals composite index well below consensus. April 2022 U.S. PMI Composite Index (Flash): 55.1 vs. 57.0 consensus vs. 57.7 prior. Manufacturing Index: 59.7 vs. 58.2 consensus vs. 58.8 prior. Services Index: 54.7 vs. 58.0 consensus vs. 58.0 prior. |
No 4 |
55.1 |
|
Apr-2022 |
|
| |
|
|
|
U.S. PMI Composite Flash expands to 8-month high levels. March 2022 IHS Markit U.S. PMI Composite Index (Flash) for March 2022: 58.5 vs. 56 prior (revised: 55.9). Manufacturing Index: 58.5 vs. 56.3 consensus vs. 57.5 prior (revised: 57.3). Manufacturers and service providers recorded stronger upturns in activity amidst rising demand and easing of Cobid-19 restrictions. New orders led the growth as a bounce in client demand strengthened for the second month peaking to 9-month high; new export orders rose at faster pace at the end of Q1. Service Index: 58.9 vs. 56.0 consensus vs. 56.7 prior (revised: 56.5). The rate of overall job creation was the sharpest since April 2021, as manufacturers and service providers alike recorded steeper upturns in employment. |
No 3 |
58.5 |
|
Mar-2022 |
|
| |
|
|
|
U.S. PMI Composite Flash rises M/M in February, at 2-month high. IHS Markit manufacturing and service-sector PMI readings higher in February 2022. The PMIs have been slowing from the high 50s to the mid-50s for manufacturing and to the low 50s for services. Modest improvement is expected for February with manufacturing seen at 56.0 and services at 52.2. |
No 2 |
56.0 |
|
Feb-2022 |
|
| |
|
|
|
U.S. PMI Composite Flash falls more than expected in January. The PMIs have been slowing from the higher mid-to-high 50s to the lower mid-to-high 50s, consistent with strong but easing growth. More of the same is expected for January with an incremental decline expected for manufacturing, to 57.0, and a slightly more tangible decline for services, to 55.0. |
No 1 |
50.8 |
|
Jan-2022 |
|
| |
|
|
|
|
|
|
|
|
| |
|
|
|
|
|
| |
|
|
|
|
|
|
|
|
|
|
|
|
|
|
|
Brief News | 2021 |
|
|
PMI Manufacturing Flash | Manufacturing |
|
Today's Week |
|
|
|
|
|
|
|
|
|
|
|
|
|
PMI Composite Flash (At 9:45 a.m ET)
| DATE/WEEK |
HIGHLIGHTS |
FOR |
COMPO |
|
December PMI Composite Flash print inches marginally lower M/M, comes in above consensus. Thu, Dec. 16, 2021 for December 2021 U.S. PMI Composite Index (Flash): 56.9 vs. 56.5 consensus and 57.2 prior. U.S. private sector businesses indicated a strong upturn in output at 2021 end, despite the rate of expansion easing to the slowest for three. According to IHS Markit's flash PMI survey, the US Manufacturing PMI Index dropped to 57.8 in December from 58.3 in November. That was below expectations for a small rise to 58.5. The Services PMI Index fell to 57.5 in December from 58.0 last month, below expectations for a rise to 58.5. As a result, the Composite PMI Index also fell on the month to 56.9 in December 2021 from 57.2 in November 2021. |
No 12 |
56.9 |
|
Dec-2021 |
|
| |
|
|
|
PMI Composite flash signals slower expansion in November 2021. November U.S. PMI Composite Flash: 56.5 vs. 57.8 consensus and 57.6 prior (revised from 57.3). Manufacturing PMI: 59.1 vs. 58.6 consensus and 58.4 prior (revised from 59.2). Service PMI: 57.0 vs. 59.0 consenus. |
No 11 |
56.5 |
|
Nov-2021 |
|
| |
|
|
|
PMI composite flash signals jump in business activity. October 2021 U.S. PMI Composite Flash: 57.3 vs. 55.5 consensus and 54.9 prior. Manufacturing PMI: 59.2 vs. 60.7 consensus and 60.5 prior. Service PMI: 58.2 vs. 55.2 consensus and 54.4 prior... |
No 10 |
57.3 |
|
Oct-2021 |
|
| |
|
|
|
PMI composite flash signals softer September 2021 than August 2021. September U.S. PMI Composite Flash: 54.5 vs. 55.5 consensus and 55.4 prior. Manufacturing PMI: 60.5 vs. 60.8 consensus and 61.1 prior. Service PMI: 54.4 vs. 55.1 consensus and 55.1 prior. Private sector output growth hampered by severe supply chain .. |
No 9 |
54.5 |
|
Sep-2021 |
|
| |
|
|
|
PMI composite flash signals fall in August 2021 amid capacity constraints and delta variant. Mon, Aug. 23, 2021. U.S. PMI Composite Flash: 55.4 vs. 59.5 consensus and 59.7 prior. Manufacturing PMI: 61.2 vs. 63.1 consensus and 63.1 prior. Service PMI: 55.2 vs. 59.7 consensus and 59.8 prior. Private sector expansion slows sharply amid capacity constraints . |
No 8 |
55.4 |
|
Aug-2021 |
|
| |
|
|
|
The flash US PMI fell for the second consecutive month to 59.7 in July 2021, below economists’ expectations and down from 63.7 in the previous month although it remained high by historical standards, IHS Markit said. PMI composite flash signals fall in July 2021 activity. Fri, Jul. 23, 2021. July U.S. PMI Composite Flash: 59.7 vs. 63.9 prior. Manufacturing PMI: 63.1 vs. 62.1 consensus and 62.6 prior Services PMI: 59.8 vs. 64.6 consensus and 64.8 prior. |
No 7 |
59.7 |
|
Jul-2021 |
|
| |
|
|
|
Adjusted for seasonal factors, the IHS Markit Flash U.S. Composite PMI Output Index posted 63.9 in June 2021, down from 68.7 in May 2021, but nonetheless signaling a historically elevated rate of expansion in output across the private sector. Price pressures also remained elevated in June 2021. The rate of input price inflation softened slightly but was the second-fastest on record. Manufacturers continued to note rapid increases in raw material and fuel costs, whilst service providers highlighted higher wage bills to attract workers plus greater transportation fees and fuel costs.
The seasonally adjusted IHS Markit Flash U.S. Services PMI Business Activity Index registered 64.8 in June 2021, down from May's series record of 70.4. The marked expansion was the second-sharpest since data collection began in October 2009.June data signaled the greatest improvement in operating conditions among goods producers on record, as highlighted by the IHS Markit Flash U.S. Manufacturing Purchasing Managers' Index (PMI) posting 62.6 in June 2021, up from 62.1 in May. |
No 6 |
63.9 |
|
Jun-2021 |
|
| |
|
|
|
The flash reading of the IHS Market U.S. composite purchasing managers index rose to record 68.1 in May 2021 from 63.5 in April. Flash U.S. Composite Output Index at 68.1 (63.5 in April). Series record high. Flash U.S. Services Business Activity Index at 70.1 (64.7 in April). Series record high. Flash U.S. Manufacturing PMI at 61.5 (60.5 in April). Series record high. Flash U.S. Manufacturing Output Index at 58.1 (57.2 in April). 4-month high. Adjusted for seasonal factors, the IHS Markit Flash U.S. Composite PMI Output Index posted 68.1 in May 2021, up from 63.5 in April 2021. The rate of expansion was unprecedented after surpassing April’s previous series record. May U.S. PMI Composite ahead of consensus and higher M/M.Fri, May 21, 2021 for May U.S. PMI Composite Flash: 68.1 vs. 63.5 prior PMI rate of expansion came in unmatched after exceeding April's previous series record; goods producers and service providers alike noted stronger paces of activity growth midway through Q2. |
No 5 |
68.1 |
|
May-2021 |
|
| |
|
|
|
IHS Markit’s “flash” US composite purchasing managers index came in at 62.2 in April 2021 versus 59.7 in March 2021 . April 2021 U.S. PMI composite moves higher, highest since October 2020. Fri, Apr. 23, 2021 for April U.S. PMI Composite Flash: 62.2 vs prior 59.7. Manufacturing PMI: 60.6 vs. 60.5 consensus and prior 59.1. Services PMI: 63.1 vs. 61.9 consensus and prior 60.4. Notably, any reading above 50 suggests improving conditions. IHS Markit said its the “flash” services purchasing managers index rose to a record 63.1 in April 2021 from 60.4 in March 2021. Economists polled by the Wall Street Journal were expecting a 61 reading. Similarly, the flash services purchasing managers index advanced to a record 63.1 in April from 60.4 in the previous month, added IHS Markit, as cited in the MarketWatch article. The firm's “flash” manufacturing purchasing managers index rose to a record 60.6 in April from 59.1 in the previous month. What’s more, the flash manufacturing purchasing managers index rose to a record 60.6 in April from 59.1 last month. |
No 4 |
62.2 |
|
Apr-2021 |
|
| |
|
|
|
Flash PMI survey data showed business activity in the United States rising sharply at the end of the first quarter of 2021, rounding off the economy's best performance since the third quarter of 2014. The IHS Markit composite PMI registered 59.1 in March 2021 compared to 59.5 in February 2021, resulting in a first quarter average of 59.1. The quarterly average signifies strong economic growth of around 1.5%, or approximately 5% on an annualised basis, which builds on a 1.0% rise in the fourth quarter of last year
|
No 3 |
59.7 |
|
Mar-2021 |
|
| |
|
|
|
The flash reading of the IHS Markit U.S. composite purchasing managers index rose to 58.8 in February 2021 from 58.7 in the prior month. Any reading over 50 indicates improving conditions. It is the strongest reading in almost six years. What happened: The index for services rose to 58.9 in February from 58.3 in the prior month. Economists polled by the Wall Street Journal were expecting a 58 reading. The index for the U.S. manufacturing sector, fell to 58.5 from 59.2. Economists had forecast a 59 reading. Big picture: The economy is starting to pick up speed as COVID-19 cases are declining and more people are being vaccinated. |
No 2 |
58.8 |
|
Feb-2021 |
|
| |
|
|
|
January 2021 U.S. PMI composite flash index jumps more than expected. Fri, Jan. 22, 2021 January 2021 U.S. PMI Composite Flash: 58.0 vs. 55.5 consensus and 55.3 prior (revised from 55.7). Services PMI: 57.5 vs. 53.8 consensus, 54.8 prior (revised from 55.3). Manufacturing PMI rises to 59.1 vs. 57.1 in December, a series record high. |
No 1 |
58.0 |
|
Jan-2021 |
|
| |
|
|
|
|
|
|
|
|
| |
|
|
|
|
|
|
| |
|
|
|
|
|
|
|
|
|
|
|
|
|
|
|
|
|
|
|
|
|
Definitions | Explain |
|
|
PMI Manufacturing Flash | Manufacturing |
|
Today's Week |
|
|
|
|
|
|
|
|
|
|
|
|
| |
|
|
|
|
| |
|
| PMI COMPOSITE |
PMI Composite Flash
The flash Composite Purchasing Managers' Index (PMI) provides an early estimate of current private sector output by combining information obtained from surveys of around 1,000 manufacturing and service sector companies.
The flash data are released around 10 days ahead of the final report and are typically based upon around 85 percent of the full survey sample.
The report tracks changes in variables such as new orders, stock levels, employment and prices across both manufacturing and services. Production is also tracked, defined as "production" for manufacturing and "output" for services.
Results are synthesized into a single index which can range between zero and 100. A reading above (below) 50 signals rising (falling) output versus the previous month and the closer to 100 (zero) the faster output is growing (contracting).
The report also contains flash estimates of the manufacturing and services PMIs. The data are produced by IHS Markit.
PMI Composite Final
US Services Purchasing Managers' Index (PMI) is based on monthly questionnaire surveys collected from over 400 U.S. companies which provide a leading indication of what is happening in the private sector services economy. It is seasonally adjusted and is calculated from seven components, including New Business, Employment and Business Expectations.
Why Investors Care
Investors need to keep their fingers on the pulse of the economy because it indicates how various types of investments will perform. The Markit Services PMI provides advance insight into the services sector, which gives investors a better understanding of business conditions and valuable information about the economic backdrop of various markets.
The stock market likes to see healthy economic growth which generally translates to higher corporate profits. The bond market prefers less rapid growth and is extremely sensitive to whether the economy is growing too quickly and causing potential inflationary pressures.
The PMI data are also used by many Central Banks to help make interest rate decisions.
The IHS Markit Services Flash data give a detailed look at the services sector, the pace of growth and the direction of this sector. Since the service sector accounts for more than three-quarters of U.S. GDP, this report has a significant influence on the markets. In addition, its sub-indexes provide a picture of new business, employment, business expectations and prices.
|
|
|
| |
|
|
|
|
|
|
|
|
|
|
|
|
|
|
|
|
|
|
|
|
|
Data | Source |
|
|
PMI Manufacturing Flash | Manufacturing |
|
Today's Week |
|
|
|
|
|
|
|
|
|
|
|
|
| |
|
|
|
|
|
|
| DATA INFORMATION |
PMI COMPOSITE FLASH |
| SOURCE |
Institute for Supply Management. |
| WEB |
www.hts.com |
| FREQUENCY |
Monthly |
| AVAILABILITY |
The first business day of the month. |
| COVERAGE |
Data are for the previous month. Data for June are released in July. |
| REVISIONS |
Yes |
| IMPORTANCE |
Manufacturing - Very Important |
|
| |
|
|
|
|
|
|
|
|
|
|
|
|