|
 |
|
 |
Employment Cost Index | Inflation |
|
 |
|
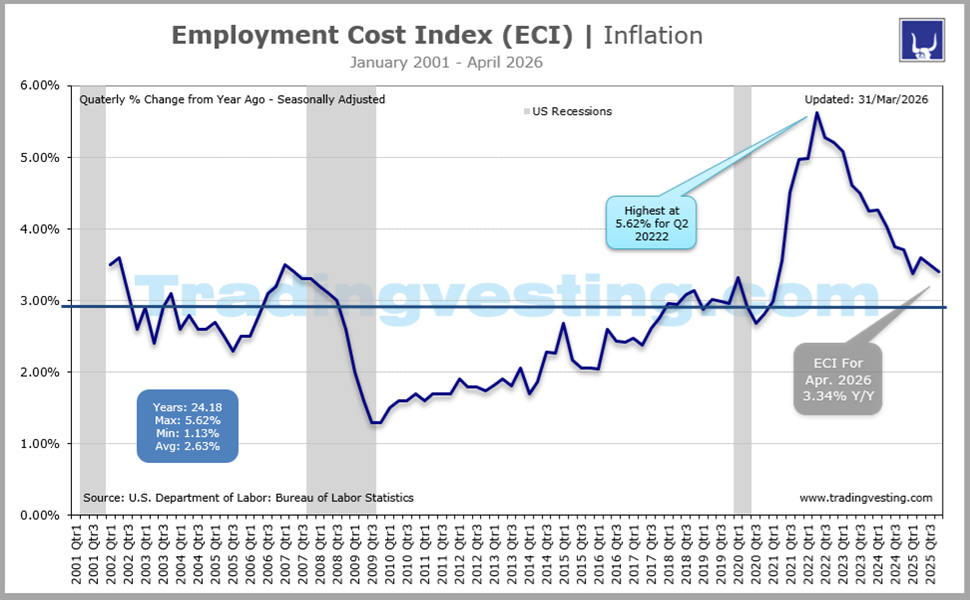
The Employment Cost Index (ECI) measures the change in the hourly labor cost to employers over time. The ECI uses a fixed “basket” of labor to produce a pure cost changes...Read More...
|
|
|
|
|
|
|
| |
|
| |
 5. Employment Cost Index ECI (5 of 5) 5. Employment Cost Index ECI (5 of 5) 1. Consumer Price Index CPI (1 of 5) 1. Consumer Price Index CPI (1 of 5)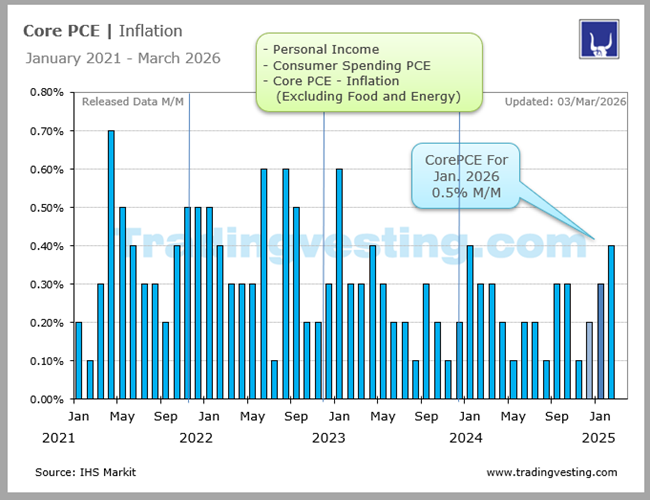 2. Core PCE (2 of 5) 2. Core PCE (2 of 5)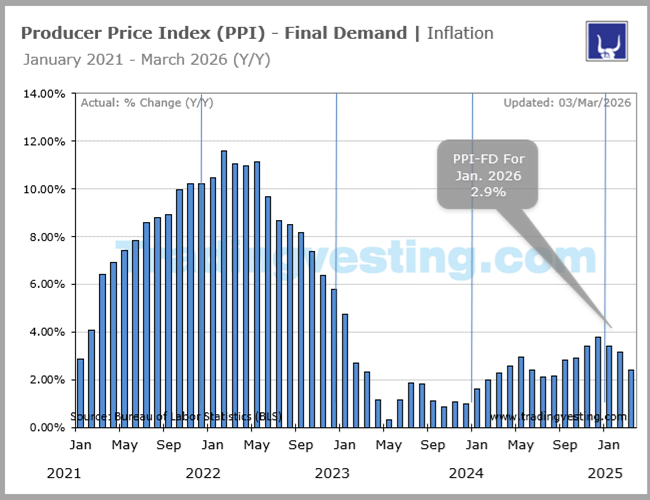 3. Producer Price Index PPI (3 of 5) 3. Producer Price Index PPI (3 of 5)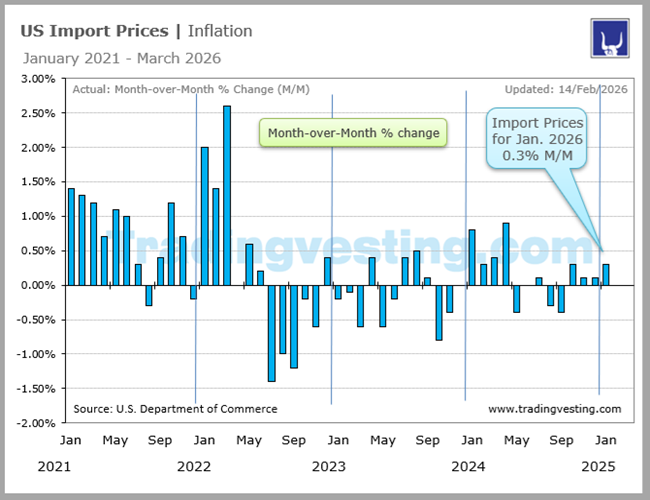 4. Import and Exports Prices (4 of 5) 4. Import and Exports Prices (4 of 5)
|
 |
|
|
|
|
| |
|
→ Big Chart |
|
→ Release |
|
| |
|
|
|
|
|
|
|
|
|
|
|
|
|
|
|
|
|
|
|
 |
|
Big Chart | Large Data |
 |
|
Employment Cost Index (ECI) | Inflation |
|
Today's Week |
 |
|
|
|
|
|
|
|
|
|
|
|
|
|
| |
|
|
|
|
|
|
|
|
|
|
|
|
|
|
|
|
|
|
|
|
|
Slides | Five 5 |
|
|
Employment Cost Index (ECI) | Inflation |
|
Today's Week |
|
|
|
|
|
|
|
|
|
|
|
|
|
|
| |
|
|
|
|
|
| |
|
|
|
|
|
|
|
|
|
|
|
|
|
|
|
|
|
|
|
|
Release Schedule | 2026 |
|
|
Employment Cost Index (ECI) | Inflation |
|
Today's Week |
|
|
|
|
|
|
|
|
|
|
|
|
|
Employment Cost Index (ECI) (8:30 a.m ET) | Inflation
| EMPLOYMENT COST INDEX |
ECI No 1 |
ECI No 2 |
ECI No 3 |
ECI No 4 |
| Release | Week |
|
|
|
|
| Release | Date |
|
|
|
|
| Release | Day |
|
|
|
|
 |
|
|
|
|
| Prior ECI Q/Q Change: |
0.8% |
0.7% |
... |
... |
| Consensus ECI: |
0.8% |
0.8% |
... |
... |
| Consensus Range ECI: |
0.8% to 0.9% |
0.7% to 0.9% |
... |
... |
| ACTUAL ECI Q/Q: |
0.7% |
0.9% |
... |
... |
|
|
|
|
|
| ECi year over Year |
ECI No 1 |
ECI No 2 |
ECI No 3 |
ECI No 4 |
| Prior Y/Y ECI: |
3.5% |
3.4% |
... |
... |
| Prior Y/Y Revised |
... |
... |
... |
... |
| Consensus Y/Y |
3.5% |
... |
... |
... |
| Consensus Range Y/Y |
3.4% to 3.5% |
... |
... |
... |
| ACTUAL Y/Y |
3.4% |
3.4% |
... |
... |
| Released Rating:: |
|
|
|
|
| Released For: |
QUARTER 4 - 2025 |
QUARTER 1- 2026 |
QUARTER 2 - 2026 |
QUARTER 3 - 2026 |
|
|
| TOTAL COMPENSATION: 3-month % change (SA) and TOTAL COMPENSATION: 12-month % change (SA) |
|
| |
|
|
|
|
|
|
|
|
|
|
|
Release Schedule | 2025 |
|
|
Employment Cost Index (ECI) | Inflation |
|
Today's Week |
|
|
|
|
|
|
|
|
|
|
|
|
|
Employment Cost Index (ECI) (8:30 a.m ET) | Inflation
| EMPLOYMENT COST INDEX |
ECI No 1 |
ECI No 2 |
ECI No 3 |
ECI No 4 |
| Release | Week |
|
|
|
|
| Release | Date |
|
|
|
|
| Release | Day |
|
|
|
|
|
|
|
|
|
| Prior ECI Q/Q Change: |
1.1% |
0.9% |
0.9% |
0.9% |
| Consensus ECI: |
1.0% |
0.9% |
0.8% |
0.8% |
| Consensus Range ECI: |
0.8% to 1.0% |
0.8% to 1.0% |
0.8% to 0.9% |
0.8% to 0.9% |
| ACTUAL ECI Q/Q: |
0.9% |
0.9% |
0.9% |
0.8% |
|
|
|
|
|
| ECi year over Year |
ECI No 1 |
ECI No 2 |
ECI No 3 |
ECI No 4 |
| Prior Y/Y ECI: |
4.3% |
3.8% |
3.6% |
3.6% |
| Prior Y/Y Revised |
... |
... |
... |
... |
| Consensus Y/Y |
... |
... |
... |
3.7% |
| Consensus Range Y/Y |
... |
... |
... |
... |
| ACTUAL Y/Y |
3.8% |
3.6% |
3.6% |
3.5% |
| Released Rating:: |
|
|
|
|
| Released For: |
QUARTER 4 - 2024 |
QUARTER 1- 2025 |
QUARTER 2 - 2025 |
QUARTER 3 - 2025 |
|
|
| |
|
| |
|
|
|
|
|
|
|
|
|
|
|
Release Schedule | 2024 |
|
|
Employment Cost Index (ECI) | Inflation |
|
Today's Week |
|
|
|
|
|
|
|
|
|
|
|
|
|
Employment Cost Index (ECI) (8:30 a.m ET) | Inflation
| EMPLOYMENT COST INDEX |
ECI No 1 |
ECI No 2 |
ECI No 3 |
ECI No 4 |
| Week: |
|
|
|
|
| Released Date: |
|
|
|
|
| Released Day: |
|
|
|
|
|
|
|
|
|
| Prior ECI Q/Q Change: |
1.1% |
0.9% |
1.2% |
0.9% |
| Consensus ECI: |
1.0% |
0.9% |
1.0% |
1.0% |
| Consensus Range ECI: |
0.8% to 1.0% |
0.8% to 1.0% |
0.9% to 1.1% |
0.7% to 1.0% |
| ACTUAL ECI Q/Q: |
0.9% |
1.2% |
0.9% |
0.8% |
|
|
|
|
|
| ECi year over Year |
ECI No 1 |
ECI No 2 |
ECI No 3 |
ECI No 4 |
| Prior Y/Y ECI: |
4.3% |
4.2% |
4.2% |
4.1% |
| Prior Y/Y Revised |
... |
4.3% |
... |
4.2% |
| Consensus Y/Y |
... |
... |
... |
4.1% |
| Consensus Range Y/Y |
... |
... |
... |
4.1% to 4.2% |
| Actual Y/Y |
4.2% |
4.2% |
4.1% |
3.9% |
| Released Rating:: |
|
|
|
|
| Released For: |
QUARTER 4 - 2023 |
QUARTER 1- 2024 |
QUARTER 2 - 2024 |
QUARTER 3 - 2024 |
|
|
|
|
|
|
|
| . |
|
| |
|
|
|
|
|
|
|
|
|
|
|
Release Schedule | 2023 |
|
|
Employment Cost Index (ECI) | Inflation |
|
Today's Week |
|
|
|
|
|
|
|
|
|
|
|
|
|
Employment Cost Index (ECI) | Inflation
| EMPLOYMENT COST INDEX |
ECI No 1 |
ECI No 2 |
ECI No 3 |
ECI No 4 |
| Week: |
|
|
|
|
| Released Date: |
|
|
|
|
| Released For: |
QUARTER 4 - 2022 |
QUARTER 1- 2023 |
QUARTER 2 - 2023 |
QUARTER 3 - 2023 |
| Prior ECI Q/Q Change: |
1.3% |
1.0% |
1.2% |
1.0% |
| Consensus ECI: |
... |
... |
... |
1.2% |
| Consensus Range ECI: |
... |
... |
... |
1.0% to 1.3% |
| ACTUAL ECI Q/Q: |
1.0% |
1.2% |
1.0% |
1.1% |
| Consensus Y/Y ECI: |
... |
... |
... |
5.0% |
| Year to Year ECI: |
... |
... |
... |
5.0% |
| Released Rating:: |
|
|
|
|
|
|
|
|
|
|
|
| |
|
| |
|
|
|
|
|
|
|
|
|
|
|
Release Schedule | 2022 |
|
|
Employment Cost Index (ECI) | Inflation |
|
Today's Week |
|
|
|
|
|
|
|
|
|
|
|
|
|
Employment Cost Index (ECI) | Inflation
| EMPLOYMENT COST INDEX |
ECI No 1 |
ECI No 2 |
ECI No 3 |
ECI No 4 |
| Week: |
|
|
|
|
| Released Date: |
|
|
|
|
| Released For: |
QUARTER 4 - 2021 |
QUARTER 1- 2022 |
QUARTER 2 - 2022 |
QUARTER 3 - 2022 |
| Prior ECI Q/Q Change: |
1.3% |
1.0% |
1.4% |
1.3% |
| Consensus ECI: |
1.2% |
1.1% |
1.1% |
1.2% |
| Consensus Range ECI: |
0.9% to 1.8% |
0.9% to 1.4% |
1.0% to 1.3% |
1.0% to 1.3% |
| ACTUAL ECI Q/Q: |
1.0% |
1.4% |
1.3% |
1.2% |
| Consensus Y/Y ECI: |
4.1% |
4.3% |
4.6% |
5.0% |
| Year to Year ECI: |
4.0% |
4.5% |
5.1% |
5.0% |
| Released Rating:: |
|
|
|
|
|
|
|
|
|
|
|
| |
|
| |
|
|
|
|
|
|
|
|
|
|
|
Release Schedule | 2021 |
|
|
Employment Cost Index (ECI) | Inflation |
|
Today's Week |
|
|
|
|
|
|
|
|
|
|
|
|
|
Employment Cost Index (ECI) | Inflation
| EMPLOYMENT COST INDEX |
ECI No 1 |
ECI No 2 |
ECI No 3 |
ECI No 4 |
| Week: |
|
|
|
|
| Released Date: |
|
|
|
|
| Released For: |
QUARTER 4 - 2020 |
QUARTER 1 - 2021 |
QUARTER 2 - 2021 |
QUARTER 3 - 2021 |
| Prior ECI Q/Q Change: |
0.4% |
0.7% |
0.9% |
0.7% |
| Consensus ECI: |
0.5% |
0.7% |
... |
0.9% |
| Consensus Range ECI: |
0.4% to 0.6% |
0.3% to 0.9% |
.... |
|
| ACTUAL ECI Q/Q: |
0.7% |
0.9% |
0.7% |
1.3% |
| Year to Year ECI: |
2.5% |
2.6% |
... |
|
| Released Rating:: |
|
|
|
|
|
|
|
|
|
|
|
| |
|
| |
|
Legends: |
 |
Delayed |
 |
Positive View |
 |
Negative View |
 |
Neutral View |
 |
Non Available |
|
|
|
|
|
|
|
|
|
|
|
|
|
|
|
|
|
|
|
|
| |
|
|
|
|
|
|
|
|
|
|
|
|
|
|
|
|
|
|
|
|
|
Brief News | 2026 |
|
|
Employment Cost Index (ECI) | Inflation |
|
Today's Week |
|
|
|
|
|
|
|
|
|
|
|
|
|
Employment Cost Index (ECI) | Inflation (8:30)
| DATE/WEEK |
HIGHLIGHTS |
FOR |
ECI |
|
ECI |
No 4 |
... |
|
Q3-2026 |
|
| |
|
|
|
ECI |
No 4 |
... |
|
Q3-2026 |
|
| |
|
|
|
ECI |
No 3 |
... |
|
Q2-2026 |
|
| |
|
|
|
ECI |
No 2 |
... |
|
Q1-2026 |
|
| |
|
|
|
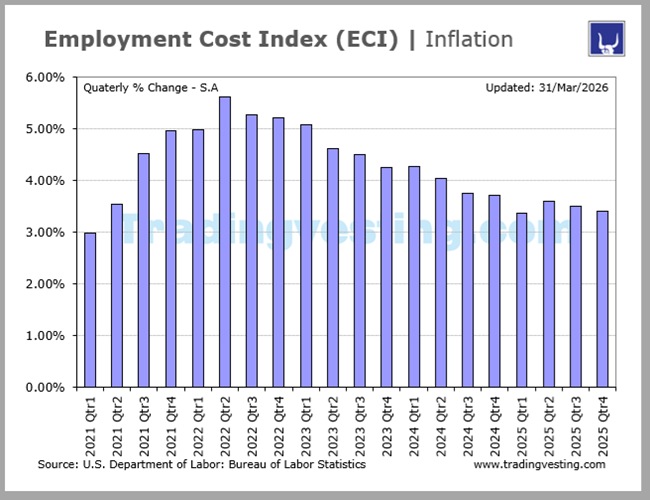
Q4 of 2025 at 07%. The employment cost index posted a seasonally adjusted 0.7% increase for the fourth quarter of 2025, according to the Bureau of Labor Statistics, below the 0.8% forecast. For the year, total compensation costs rose 3.4%, or a bit above the inflation rate. The quarterly rate was the slowest gain since Q3 of 2020. |
No 1 |
3.4% |
|
Q4-2025 |
|
| |
|
|
|
|
|
|
|
|
| |
|
|
|
|
|
| |
|
|
|
|
|
|
|
|
|
|
|
|
|
|
|
Brief News | 2025 |
|
|
Employment Cost Index (ECI) | Inflation |
|
Today's Week |
|
|
|
|
|
|
|
|
|
|
|
|
|
Employment Cost Index (ECI) | Inflation (8:30)
| DATE/WEEK |
HIGHLIGHTS |
FOR |
ECI |
|
ECI |
No 4 |
3.5% |
|
Q3-2025 |
|
| |
|
|
|
ECI Q3-2025 : Delayed due to the government shut down, |
No 4 |
... |
|
Q3-2025 |
|
| |
|
|
|
ECI |
No 3 |
3.6% |
|
Q2-2025 |
|
| |
|
|
|
US labor costs rise moderately in first quarter. U.S. labor costs increased moderately in the first quarter as economic uncertainty caused by tariffs cools demand for labor. The Employment Cost Index (ECI), the broadest measure of labor costs, rose 0.9% in the first quarter after a similar increase in the October-December period, the Labor Department's Bureau of Labor Statistics said on Wednesday. |
No 2 |
3.6% |
|
Q1-2025 |
|
| |
|
|
|
US labor costs rise moderately in fourth quarter. U.S. labor costs rose marginally in the fourth quarter, offering some comfort to Federal Reserve officials after progress lowering inflation stalled at the end of 2024. The employment cost index (ECI), the broadest measure of labor costs, gained 0.9% last quarter after rising 0.8% in the third quarter, the Labor Department's Bureau of Labor Statistics said on Friday. Economists polled by Reuters had forecast the ECI would climb 0.9%. Labor costs increased 3.8% in the 12 months through December after rising 3.9% in the year through September. The ECI is viewed by policymakers as one of the better measures of labor market slack and a predictor of core inflation because it adjusts for composition and job-quality changes. |
No 1 |
3.8% |
|
Q4-2024 |
|
| |
|
|
|
|
|
|
|
|
| |
|
|
|
|
|
| |
|
|
|
|
|
|
|
|
|
|
|
|
|
|
|
Brief News | 2024 |
|
|
Employment Cost Index (ECI) | Inflation |
|
Today's Week |
|
|
|
|
|
|
|
|
|
|
|
|
|
Employment Cost Index (ECI) | Inflation (8:30)
| DATE/WEEK |
HIGHLIGHTS |
FOR |
ACTUAL |
|
U.S. labor costs recorded their smallest increase in more than three years in the third quarter amid cooling wage growth, indicating that inflation was firmly on a downward trend. The employment cost index (ECI), the broadest measure of labor costs, rose 0.8% last quarter, the Labor Department's Bureau of Labor Statistics said on Thursday. That was the smallest gain since the second quarter of 2021 and followed an unrevised 0.9% increase in the second quarter. |
No 4 |
2.3% |
|
Q3-2024 |
|
| |
|
|
|
Employment cost index rises 0.9% in second quarter. Slowing wage gains restrain US labor costs in second quarter. Labor costs increase 4.1% on annual basis. Wages, salaries gain 0.9%; up 4.2% on annual basis. U.S. labor costs increased moderately in the second quarter as private sector wages grew at the slowest pace in 3-1/2 years, more evidence that inflation was firmly on a downward trend and could help facilitate an interest rate cut in September. The report from the Labor Department on Wednesday followed data last week showing inflation subsided considerably last quarter, with sub-3% readings in all the measures. Labor costs are likely to cool further as the jobs market continues to ease. The employment cost index (ECI), the broadest measure of labor costs, increased 0.9% last quarter after rising by an unrevised 1.2% in the first quarter, the Labor Department's Bureau of Labor Statistics said. Economists polled by Reuters had forecast the ECI would rise 1.0%. Labor costs advanced 4.1% in the 12 months through June, the smallest gain since the fourth quarter of 2021, after climbing 4.2% in the year through March. Annual labor cost growth has slowed from 4.5% in June 2023. The ECI is viewed by policymakers as one of the better measures of labor market slack and a predictor of core inflation because it adjusts for composition and job-quality changes. The U.S. central bank has a 2% inflation target. |
No 3 |
0.9% |
|
Q2-2024 |
|
| |
|
|
|
Growth in US labor costs accelerates in first quarter. Employment cost index rises 1.2% in first quarter. Wages increase 1.1%; up 4.4% year-on-year. House prices surge 7.0% year-on-year in February. U.S. labor costs increased more than expected in the first quarter amid a rise in wages and benefits, confirming the surge in inflation early in the year that will likely delay a much- anticipated interest rate cut later this year. The Employment Cost Index (ECI), the broadest measure of labor costs, increased 1.2% last quarter after rising by 0.9% in the fourth quarter, the Labor Department's Bureau of Labor Statistics said. Economists polled by Reuters had forecast the ECI would advance 1.0%. Labor costs increased 4.2% on a year-on-year basis after rising by the same margin in the fourth quarter. They have declined from a peak of 5.1% at the end of 2022. Some economists blamed the quarterly rise in wages on challenges adjusting the data at the start of the year for seasonal fluctuations.The ECI is viewed by policymakers as one of the better measures of labor market slack and a predictor of core inflation because it adjusts for composition and job-quality changes. The report followed data last week that showed price pressures heating up in the first quarter. |
No 2 |
0.2% |
|
Q1-2024 |
|
| |
|
|
|
Employment cost index rises 0.9% in fourth quarter. Labor costs increase 4.2% year-on-year. Wages and salaries gain 0.9%, up 4.3% year-on-year. U.S. labor costs rose less than expected in the fourth quarter and the annual increase was the smallest in two years, signs of moderating wage inflation that could give the Federal Reserve room to start cutting interest rates by June. Compensation costs growth is slowing as labor market conditions ease in response to the U.S. central bank's tight monetary policy stance. Government data on Tuesday showed Americans were becoming less enthusiastic about job-hopping, with the number of people quitting their jobs near a three-year low in December, a trend that could further slow wage inflation. The Employment Cost Index (ECI), the broadest measure of labor costs, increased 0.9% last quarter, the Labor Department's Bureau of Labor Statistics said on Wednesday. That was the smallest quarterly gain since the second quarter of 2021 and followed a 1.1% advance in the July-September period. Economists polled by Reuters had forecast the ECI rising 1.0%. Labor costs increased 4.2% year-on-year, the smallest rise since the fourth quarter of 2021, after climbing 4.3% in the third quarter. |
No 1 |
0.9% |
|
Q4-2023 |
|
| |
|
|
|
|
|
|
|
|
| |
|
|
|
|
|
| |
|
|
|
|
|
|
|
|
|
|
|
|
|
|
|
Brief News | 2023 |
|
|
Employment Cost Index (ECI) | Inflation |
|
Today's Week |
|
|
|
|
|
|
|
|
|
|
|
|
|
Employment Cost Index (ECI) | Inflation (8:30)
| DATE/WEEK |
HIGHLIGHTS |
FOR |
ACTUAL |
|
Employment cost index increases 1.1% in third quarter. Wages, salaries rise 1.2%; benefits advance 0.9%. Consumer confidence softens further in October. House price inflation accelerates in September. U.S. labor costs increased solidly in the third quarter amid strong wage growth while house price inflation accelerated in August, the latest signs that the Federal Reserve could keep interest rates high for some time. The reports on Tuesday pose a threat to efforts by the U.S. central bank to bring inflation to its 2% target. Fed officials started a two-day policy meeting on Tuesday. The U.S. central bank is expected to leave interest rates unchanged but maintain its hawkish bias at the conclusion of that meeting as a recent spike in U.S. Treasury yields and stock market sell-off have tightened financial conditions. The Employment Cost Index (ECI), the broadest measure of labor costs, rose 1.1% last quarter after increasing 1.0% in the April-June period, the Labor Department's Bureau of Labor Statistics reported. Economists polled by Reuters had forecast the ECI would rise 1.0%. The ECI is widely viewed by policymakers and economists as one of the better measures of labor market slack and a predictor of core inflation because it adjusts for composition and job-quality changes. Since March 2022, the Fed has raised its policy rate by 525 basis points to the current 5.25%-5.50% range. |
No 4 |
1.1% |
|
Q3-2023 |
|
| |
|
|
|
U.S. labor costs increased less than expected in the second quarter as wage growth cooled a bit, offering a boost to the Federal Reserve in the fight against inflation. The Employment Cost Index, the broadest measure of labor costs, rose 1.0% last quarter after advancing 1.2% in the January-March period, the Labor Department said on Friday. Economists polled by Reuters had forecast the ECI rising 1.1%. Labor costs increased 4.5% on a year-on-year basis after shooting up 4.8% in the first quarter. The ECI is widely viewed by policymakers and economists as one of the better measures of labor market slack and a predictor of core inflation, because it adjusts for composition and job-quality changes. |
No 3 |
1.0% |
|
Q2-2023 |
|
| |
|
|
|
U.S. labor costs increased solidly in the first quarter as strong wage gains persisted amid a tight labor market, suggesting inflation could remain elevated for a while. The Employment Cost Index, the broadest measure of labor costs, rose 1.2% last quarter after increasing 1.1% in the October-December period, the Labor Department said on Friday. Economists polled by Reuters had forecast the ECI rising 1.1%. Labor costs increased 4.8% on a year-on-year basis after advancing 5.1% in the fourth quarter. The ECI is widely viewed by policymakers and economists as one of the better measures of labor market slack and a predictor of core inflation, because it adjusts for composition and job-quality changes. In another key inflation measure for the Fed, the employment cost index increased 1.2% for the first quarter, higher than the 1% estimate. The inflationary pressures were reflected in the willingness of consumers to keep spending. Personal income rose 0.3% for the month but consumer spending was flat, as expected. |
No 2 |
1.2% |
|
Q1-2023 |
|
| |
|
|
|
Employment cost index rises 1.0% in fourth quarter. Wages, salaries increase 1.0%; up 5.1% year-on-year. Consumer confidence index drops to 107.1 in January. House price inflation slows further in November. U.S. labor costs increased at their slowest pace in a year in the fourth quarter as wage growth slowed, giving the Federal Reserve a boost in its fight against inflation. The Employment Cost Index, the broadest measure of labor costs, rose 1.0% last quarter, the Labor Department said. That was the smallest advance since the fourth quarter of 2021 and followed a 1.2% gain in the July-September period. Economists polled by Reuters had forecast the ECI would rise 1.1%. Labor costs increased 5.1% on a year-on-year basis after climbing 5.0% in the third quarter. They remain higher than the 3.5% that Fed officials and economists view as consistent with tame inflation. The Fed has a 2% inflation target. The ECI is viewed by policymakers as one of the better measures of labor market slack and a predictor of core inflation because it adjusts for composition and job-quality changes. |
No 1 |
1.0% |
|
Q4-2022 |
|
| |
|
|
|
|
|
|
|
|
| |
|
|
|
|
|
| |
|
|
|
|
|
|
|
|
|
|
|
|
|
|
|
Brief News | 2022 |
|
|
Employment Cost Index (ECI) | Inflation |
|
Today's Week |
|
|
|
|
|
|
|
|
|
|
|
|
|
Employment Cost Index (ECI) | Inflation (8:30)
| DATE/WEEK |
HIGHLIGHTS |
FOR |
ACTUAL |
|
A separate release Friday showed that employment costs rose 1.2% for the third quarter, in line with estimates, according to the Bureau of Labor Statistics. On an annual basis, the employment cost index increased 5%, slightly lower than the 5.1% pace in the second quarter. Fed officials watch Friday’s data points closely for clues about where costs are headed, particularly with a tight labor market in which there are 1.7 jobs per every available worker, according to recent BLS data. The Fed prefers the PCE price reading to the more widely followed consumer price index from the BLS. The BEA measure adjusts for consumer behavior, in particular substitution of less expensive goods, to determine cost-of-living increases rather than simple price moves. Markets think the Fed might downshift the pace of its rate hikes ahead. Futures pricing Friday morning indicated a nearly 60% chance that the central bank will increase rates 0.5 percentage point in December. |
No 4 |
18.6% |
|
Q3-2022 |
|
| |
|
|
|
There was other bad inflation news Thursday.The employment cost index, another figure Fed policymakers follow closely, rose 1.3% in the second quarter. That represented a slight decline from the 1.4% gain in the previous quarter, but was ahead of the 1.1% estimate. Further, the 5.1% increase on a 12-month basis marked a record for a data series that goes back to the first quarter of 2002. |
No 3 |
6.9% |
|
Q2-2022 |
|
| |
|
|
|
Employment costs accelerated 1.4% in the past quarter, while inflation-adjusted income declined 0.4% in March. A separate inflation measure, the employment cost index, increased 1.4% in the first quarter from the previous period, according to the Bureau of Labor Statistics. The Dow Jones estimate for that level was 1.1%. The index, which measures total compensation cost for nongovernment workers, was up 4.5% over the past year. Separating out wages and salaries, the increase was 5%, the highest growth rate ever in a data series that dates to 2002 though only slightly above the previous quarter’s 4.9% gain. The bigger story from today’s data releases was further evidence that inflation is starting to ease. |
No 2 |
18.6% |
|
Q1-2022 |
|
| |
|
|
|
A separate Labor Department data point that Fed officials also watch closely showed that total compensation costs for civilian workers increased 4% over the past 12 months. That is the fastest pace in history for the employment cost index, a data set that goes back to the beginning of 2002.The Labor Department's Bureau of Labor Statistics said the employment cost index also increased 4% over the past 12 months, the fastest increase since that data set began in 2002. Wages and salaries increased 4.5% for 2021, while benefits costs were up 2.5%, according to the Bureau of Labor Statistics. The Federal Reserve is planning to raise interest rates later this year in an effort to combat the inflation. According to CNBC, "market pricing is pointing to five quarter-percentage-point increases this year for benchmark short-term borrowing rates." |
No 1 |
6.9% |
|
Q4-2021 |
|
| |
|
|
|
|
|
|
|
|
| |
|
|
|
|
|
| |
|
|
|
|
|
|
|
|
|
|
|
|
|
|
|
Brief News | 2021 |
|
|
Employment Cost Index (ECI) | Inflation |
|
Today's Week |
|
|
|
|
|
|
|
|
|
|
|
|
|
Employment Cost Index (ECI) | Inflation (8:30)
| DATE/WEEK |
HIGHLIGHTS |
FOR |
Q/Q |
|
Strong inflation pressures were underscored by a separate report from the Labor Department on Friday showing the Employment Cost Index, the broadest measure of labor costs, surged 1.3% in the third quarter. The largest gain since the first quarter of 2001, when the government started tracking the series, reflected an increase across industries and followed a 0.7% rise in the April-June period. Labor costs powered ahead 3.7% on a year-on-year basis, the largest rise since the fourth quarter of 2004, after increasing 2.9% in the second quarter. The ECI is viewed by policymakers and economists as one of the better measures of labor market slack and a predictor of core inflation as it adjusts for composition and job quality changes. Economists had forecast the ECI advancing 0.9% in the third quarter. Wages and salaries soared a record 1.5% last quarter after increasing 0.9% in the April-June quarter. They were up 4.2% year-on-year. Benefits gained 0.9% after rising 0.4% in the second quarter. The COVID-19 pandemic has upended labor market dynamics, creating an economy-wide acute shortage of workers. There were 10.4 million job openings at the end of August. |
No 4 |
1.3% |
|
Q3-2021 |
|
| |
|
|
|
U.S. labor costs increased solidly in the second quarter as companies raised wages and benefits to attract workers, supporting views that high inflation could persist beyond this year amid supply constraints. The Employment Cost Index, the broadest measure of labor costs, rose 0.7% last quarter after gaining 0.9% in the January-March period, the Labor Department said on Friday. That raised the year-on-year rate of increase to 2.9%, the largest gain since the fourth quarter of 2018, from 2.6% in the first quarter. The ECI is widely viewed by policymakers and economists as one of the better measures of labor market slack and a predictor of core inflation as it adjusts for composition and job quality changes. Economists polled by Reuters had forecast the ECI advancing 0.9% in the second quarter. |
No 3 |
0.7% |
|
Q2-2021 |
|
| |
|
|
|
Compensation costs for civilian workers increased 0.9 percent, seasonally adjusted, for the 3-month period ending in March 2021, the U.S. Bureau of Labor Statistics reported today. Wages and salaries increased 1.0 percent and benefit costs increased 0.6 percent from December 2020. |
No 2 |
0.9% |
|
Q1-2021 |
|
| |
|
|
|
Gradually firming inflation was reinforced by a fourth report from the Labor Department showing its Employment Cost Index, the broadest measure of labor costs, rose 0.7% last quarter after advancing 0.5% in the third quarter.The ECI is widely viewed by policymakers and economists as one of the better measures of labor market slack and a predictor of core inflation, as it adjusts for composition and job quality changes. Wages jumped 0.9% last quarter. read more But with employment still 10 million jobs below the pre-pandemic peak, the rise is probably unsustainable. Still, inflation is seen accelerating in the months ahead as weak readings last March and April drop from the calculation. |
No 1 |
0.7% |
|
Q4-2020 |
|
| |
|
|
|
|
|
|
|
|
| |
|
|
|
|
|
| |
|
Legends: |
|
Delayed |
|
Positive View |
|
Negative View |
|
Neutral View |
|
Non Available |
|
|
|
|
|
|
|
|
|
|
|
|
|
|
|
|
|
|
|
|
| |
|
|
|
|
|
|
|
|
|
|
|
|
|
|
|
|
|
|
|
|
|
Definitions | Explain |
|
|
Employment Cost Index (ECI) | Inflation |
|
Today's Week |
|
|
|
|
|
|
|
|
|
|
|
|
| |
|
|
|
|
| |
|
| How the ECI Affects You? |
ECI
The employment cost index is composed of two elements: wages and benefits.
The employment cost index measured total compensation costs which include wages and salaries and also benefits. Benefits include vacations, but the primary mover is health insurance premiums.
The employment cost index is an easy way to evaluate wage trends and the risk of wage inflation. Wage inflation is high on the Federal Reserve's enemy list. Fed officials are always on the lookout for the prospects of inflationary pressures.
Wage pressures tend to percolate when economic activity is booming and the demand for labor is rising rapidly. During economic downturns, wage pressures tend to be subdued because labor demand is down.
The Employment Cost Index (ECI) measures the change in the hourly labor cost to employers over time. The ECI uses a fixed “basket” of labor to produce a pure cost change, free from the effects of workers moving between occupations and industries and includes both the cost of wages and salaries and the cost of benefits
|
|
|
| |
|
|
|
|
|
|
|
|
|
|
|
|
|
|
|
|
|
|
|
|
|
Data | Source |
|
|
Employment Cost Index (ECI) | Inflation |
|
Today's Week |
|
|
|
|
|
|
|
|
|
|
|
|
| |
|
|
|
|
|
|
| DATA INFORMATION |
EMPLOYMENT COST INDEX |
| SOURCE |
Bureau of Labor Statistics (BLS), U.S. Department of Labor
|
| WEB |
www.bls.gov |
| FREQUENCY |
Monthly |
| AVAILABILITY |
Mid-month |
| COVERAGE |
Data are for the previous month. Data for June are released in July. |
| REVISIONS |
No |
| IMPORTANCE |
Inflation - Very Important |
|
| |
|
|
|
|
|
|
|
|
|
|
|